Actualités
Article d'analyse exclusif avec les dernières mises à jour du marché et des flux d'actualités en temps réel.

John Paulson déclare que nous sommes aux premiers stades d'un marché haussier de long terme pour l'or.
Publié le mercredi 22 juillet 2026 à 16h41 EDT John Paulson, le gestionnaire de fonds spéculatifs qui a gagné des milliards en pariant contre le marché immobilier américain avant de devenir haussier sur l’or, a déclaré qu’il pense que le métal précieux n’en est qu’aux premiers stades d’une reprise à long terme. « Je pense vraiment que nous sommes aux débuts ou aux premiers stades d’un marché haussier à long terme pour l’or », a déclaré Paulson mercredi sur « The Exchange » de CNBC. « À mesure que les gens perdent confiance dans les monnaies papier, l’or comme alternative continuera de croître. » Paulson, dont le pari contre les prêts hypothécaires à risque est devenu l’une des transactions les plus rentables de l’histoire de Wall Street, s’est tourné vers l’or en 2009, estimant que les mesures de relance budgétaire et monétaire sans précédent après la crise financière finiraient par affaiblir le dollar américain. Depuis lors, les prix de l’or ont à peu près quadruplé, dépassant le seuil des 5 000 dollars avant de refluer. L’investisseur milliardaire a déclaré que la demande de lingots continue de s’élargir, portée par les banques centrales qui renforcent leurs réserves, ainsi que par l’intérêt croissant du secteur privé. « L’or est en train de devenir la monnaie de réserve la plus appropriée au monde, remplaçant les monnaies fiduciaires », a déclaré Paulson. « La demande des banques centrales, par exemple, n’a cessé de croître, tout comme celle du secteur privé. » Paulson a également soutenu que les investisseurs ont davantage intérêt à détenir des actions de sociétés minières aurifères que des lingots eux-mêmes, en particulier les entreprises disposant d’importantes réserves non exploitées. « Je pense que la meilleure façon d’investir est d’investir dans des actions aurifères en phase de démarrage », a-t-il déclaré. Paulson a fait ces commentaires alors que annonçait l’acquisition de la participation de 40 % de Paulson Advisers dans le en Alaska. Paulson, qui est coprésident de NovaGold, a déclaré que la société offre aux investisseurs une exposition avec effet de levier à la hausse du prix de l’or grâce à sa base de ressources considérable. « NovaGold possède 40 millions d’onces d’or en ressources indiquées et mesurées et en réserves, pour une capitalisation boursière de 4,2 milliards de dollars », a déclaré Paulson. « Je pense que la meilleure façon de jouer l’or est via des actions comme NovaGold, sinon NovaGold elle-même. » Source :
23 Jul 2026 16:17
Décret exécutif de Trump resserre les règles sur les terres rares, mais l'écart d'approvisionnement en aimants aux États-Unis persiste jusqu'en 2027【Analyse SMM】
Le décret de Trump renforce les règles de défense sur les terres rares, mais l’écart d’approvisionnement en aimants des États-Unis ne sera pas comblé d’ici 2027 Le 20 juillet, le président Donald Trump a signé un décret exécutif ordonnant au département de la Défense de supprimer progressivement d’ici le 1er janvier 2027 la plupart des dérogations qui permettaient aux entrepreneurs de la défense de se procurer des aimants en samarium-cobalt (SmCo) et en néodyme-fer-bore (NdFeB), du tantale et ses alliages, de la poudre de tungstène et des alliages lourds, ainsi que du molybdène auprès de « pays étrangers non alliés » — à savoir la Chine, la Russie, l’Iran et la Corée du Nord. À partir de 2027, tout entrepreneur ou sous-traitant sollicitant une dérogation devra soumettre un plan d’atténuation approuvé par le DoD, prouver l’origine précise des matériaux non conformes, démontrer des efforts considérables pour trouver des alternatives conformes et présenter un calendrier pour éliminer les matériaux interdits de leurs chaînes d’approvisionnement. Parallèlement, le décret demande au DoD de publier des orientations politiques dans les 180 jours, incitant les entrepreneurs à cartographier les chaînes d’approvisionnement critiques « des matières premières aux produits finaux » et à commencer à qualifier les sources nationales de minéraux, matériaux et composants critiques. Le véritable enjeu du décret : combler les failles, pas innover Pour mesurer la portée réelle de ce décret, il faut le lire à la lumière de l’article 4872 du titre 10 du Code des États-Unis, adopté en 2018, qui interdisait déjà au DoD d’acheter les matériaux sensibles susmentionnés à des « pays adversaires », les aimants SmCo et NdFeB étant les principaux produits de terres rares concernés. Le problème était que, depuis des années, l’industrie nationale américaine d’aimants permanents à base de terres rares restait trop faible pour répondre à la demande de la défense, si bien que le DoD n’a cessé d’accorder des dérogations au cas par cas pour maintenir légalement les importations chinoises. Le véritable mordant du décret de Trump ne réside pas dans l’interdiction d’achat elle-même — la loi l’exigeait déjà — mais dans le passage des dérogations d’une « attribution par défaut » à une « révision stricte au cas par cas », l’« incapacité de constituer un approvisionnement national » étant explicitement exclue comme excuse valable. Le conseiller commercial de la Maison-Blanche, Peter Navarro, l’a dit sans détour : les entrepreneurs ne pourront plus prétendre qu’ils n’avaient pas le choix sans avoir tenté quoi que ce soit. Symboliquement, cela marque la volonté de l’administration Trump de faire passer la « dé-sinisation de la chaîne d’approvisionnement de défense » du slogan à une institution contraignante. Pourquoi les États-Unis s’inspirent désormais de la méthode chinoise La disposition la plus révélatrice est l’obligation, dans les 180 jours, de mettre en place un système de traçabilité complet de la chaîne — une référence claire à la Chine. Depuis l’entrée en vigueur de la Réglementation sur les terres rares le 1er octobre 2024, la Chine exige des entreprises minières et de fusion-séparation qu’elles tiennent des registres de flux. En février 2025, le ministère de l’Industrie et des Technologies de l’information (MIIT) a diffusé pour commentaires publics le Projet de mesures provisoires pour la gestion de la traçabilité des produits à base de terres rares , instaurant un système de traçabilité des terres rares géré conjointement par le MIIT, le ministère des Ressources naturelles, le ministère du Commerce, l’Administration générale des douanes et l’Administration fiscale d’État, couvrant l’ensemble de la chaîne, de la production à l’utilisation, en passant par la circulation. Les entreprises doivent télécharger les données de flux de produits sur la plateforme gouvernementale de traçabilité avant le 10 de chaque mois. À cela s’ajoutent les contrôles à l’exportation sur les terres rares moyennes et lourdes mis en œuvre depuis avril 2025, la règle de « traçabilité de minimis » exigeant des licences pour les produits réexportés contenant des terres rares chinoises au-delà de certains seuils, et les mécanismes de récompense des lanceurs d’alerte déployés en juillet 2026. Ces éléments forment ensemble un système réglementaire en boucle fermée : quotas – traçabilité – examen des exportations – lutte contre la contrebande. L’exigence américaine de cartographier les chaînes d’approvisionnement « des matières premières aux produits militaires finaux » est, au fond, une reconnaissance du fait que toute interdiction d’achat reste lettre morte sans visibilité sur les flux en aval. La Chine a utilisé son système de traçabilité pour affiner son levier sur les terres rares ; les États-Unis sont désormais contraints d’en tirer la même leçon. La réalité pour la défense américaine : l’écart en aimants ne pourra pas être comblé d’ici 2027 Le consensus du marché selon lequel cette interdiction a une portée bien plus symbolique que pratique se vérifie — la cause profonde étant la situation embarrassante des capacités américaines en aimants permanents à base de terres rares. La ligne de production commerciale d’aimants NdFeB frittés d’USA Rare Earth à Stillwater, en Oklahoma, n’a commencé sa mise en service qu’en mars 2026. L’entreprise prévoit d’atteindre un rythme de 600 tonnes métriques par an (tpa) d’ici la fin du quatrième trimestre 2026, pour passer à un total de 1 200 tpa sur deux lignes au premier trimestre 2027. Même en ajoutant la nouvelle base prévue de 6 400 tpa au parc industriel Bailey en Caroline du Sud, ainsi que les projets de soutien tels que la conversion de NdPr de MP Materials au Texas et l’usine de séparation des terres rares lourdes de Lynas au Texas, les progrès restent dans la phase de montée en puissance « de 0 à 1 ». À titre de comparaison, les fabricants d’aimants japonais bien établis — Proterial, Shin-Etsu — affichent chacun des capacités de 2 000 à 3 000 tpa sur un seul site, avec de profondes barrières techniques, tandis que la Chine domine la production et le raffinage mondiaux d’aimants à base de terres rares. La demande annuelle américaine d’aimants NdFeB pour la défense et l’industrie de pointe dépasse de loin la somme de toutes les capacités prévues sur le territoire national, ce qui signifie qu’à l’échéance de 2027, l’offre intérieure sera nettement insuffisante pour compenser le vide. Le segment des terres rares lourdes est encore plus précaire. L’oxyde de NdPr de MP Materials n’a pas encore été effectivement converti en métal et en aimants à court terme. L’usine de séparation des terres rares lourdes de Lynas au Texas reste à la traîne. Energy Fuels a dépensé des sommes considérables pour acquérir le fabricant européen d’aimants VAC afin d’étendre sa capacité d’aimants contenant des terres rares lourdes, mais l’offre à court terme d’aimants haute performance à base de dysprosium et de terbium reste insuffisante, la matière première étant encore largement dépendante des transbordements chinois ou de pays alliés. Impact prévu sur les exportations chinoises de terres rares Pour la Chine, ce décret ajoute une incertitude supplémentaire à la prolongation des contrôles à l’exportation fin 2026 et à la délivrance de licences générales. Compte tenu des ajustements du marché après le durcissement d’avril 2025 et de l’affinement progressif des cadres juridiques et politiques pertinents, la probabilité d’une répétition des restrictions agressives d’avril 2025 est relativement faible. Cependant, les volumes totaux d’exportation de NdFeB en 2026 devraient en pâtir. À moyen et long terme, la « dé-sinisation » américaine progressera sur deux voies : l’une est le modèle d’intégration verticale « de la mine à l’aimant » illustré par USA Rare Earth, visant une capacité de 10 000 tpa de NdFeB ; l’autre est l’expansion des capacités des bases d’aimants haut de gamme au Japon et en Europe (VAC, Neo, etc.). Les deux voies pointent vers la même réalité : les États-Unis mettent 5 à 10 ans pour combler l’écart en aimants, mais avec une demande rigide de la chaîne d’approvisionnement de défense, la courbe de diminution de la dépendance à la Chine pendant la période de transition sera bien plus plate que ne le suggère le discours politique. Un détail facile à négliger : le décret exclut explicitement de son champ d’application la Réserve stratégique américaine de minéraux critiques (le dénommé « Project Vault ») et les minéraux critiques produits par des projets soutenus financièrement par l’EXIM ou la DFC. Cela laisse en fait une « porte dérobée » aux États-Unis : le stockage stratégique et les projets financés par le gouvernement fédéral peuvent encore être gérés avec souplesse. Cela confirme aussi, de manière indirecte, que la véritable intention de ce décret penche davantage vers « établir des règles et renforcer la responsabilité » que vers « couper l’approvisionnement demain ». Évaluation finale Placé dans le contexte plus large de la compétition sino-américaine sur les terres rares, ce décret n’est ni la frappe décisive de « découplage », ni un simple geste politique symbolique. Il s’agit d’un acte d’ alignement institutionnel : les États-Unis ont compris que, pour disposer d’un levier équivalent dans le jeu des terres rares, ils doivent d’abord se doter d’une visibilité de la chaîne d’approvisionnement comparable à celle de la Chine. Mais les institutions peuvent être signées du jour au lendemain ; les capacités doivent être augmentées tonne par tonne.
23 Jul 2026 12:27
Une violente tempête de neige frappe la province argentine de Catamarca, menaçant la production et les expéditions de lithium [Analyse SMM]
Le plateau de la Puna, dans la province de Catamarca en Argentine, a récemment été frappé par une tempête de neige historique, accompagnée de vents violents et de températures extrêmement basses. Les températures dans la région de Tres Quebradas seraient descendues à environ -27 °C, tandis que les chutes de neige ont dépassé un mètre par endroits, immobilisant temporairement plusieurs travailleurs de projets sur les sites miniers. Autour du Salar del Hombre Muerto, l'accumulation de neige sur certaines routes a atteint 1 à 2 mètres. La route provinciale 43, qui relie Antofagasta de la Sierra aux projets salins environnants, ainsi que plusieurs routes de haute altitude, est devenue en grande partie impraticable. Les transferts de personnel du projet Fénix de Rio Tinto ont également été affectés. Au soir du 23 juillet, le poste-frontière international de San Francisco entre Catamarca et le Chili restait fermé en raison des routes enneigées. Du point de vue de la distribution des projets, la perturbation météorologique actuelle est principalement concentrée dans la province de Catamarca, et non dans toute la région des salars d'Amérique du Sud. Des informations publiques confirment des perturbations dans les mouvements de personnel et l'accès aux sites miniers pour les projets 3Q et Fénix. Fénix a une capacité existante de produits lithinifères d'environ 32 000 tonnes par an, tandis que la phase 1 du projet 3Q a une capacité de carbonate de lithium de 20 000 tonnes par an. La région plus large abrite également le projet Sal de Vida de 15 000 tonnes par an, ainsi que Sal de Oro, Hombre Muerto Ouest et plusieurs autres projets en exploitation, en montée en puissance ou en construction. Aucun opérateur majeur n'a encore officiellement annoncé un arrêt complet de la production ou une révision à la baisse de ses prévisions de production. Les fermetures de routes ne doivent donc pas être assimilées à une perte totale de production salifère. SMM estime que l'impact immédiat se reflétera d'abord dans les rotations de personnel, les livraisons d'intrants de production, la maintenance des équipements et le transport sortant des produits finis. Fénix utilise un procédé d'extraction directe du lithium par adsorption, ce qui signifie que les conditions météorologiques extrêmes sont plus susceptibles d'affecter l'exploitation par des contraintes logistiques et des perturbations des opérations continues sur site. Le projet 3Q et d'autres opérations utilisant des bassins d'évaporation sont confrontés non seulement à des risques de transport, mais aussi à des impacts différés potentiels sur l'efficacité de l'évaporation et la concentration des saumures en raison de chutes de neige prolongées, de basses températures et de la fonte subséquente des neiges. Si l'accès routier se rétablit rapidement, l'impact principal pourrait se limiter à un retard dans les calendriers d'expédition plutôt qu'à une perte définitive de production annuelle. En revanche, si les restrictions sur les grands axes routiers et les opérations minières persistent plus de deux semaines, la perturbation pourrait commencer à affecter la production du troisième trimestre et les calendriers de montée en puissance des projets plus récents. Concernant les importations, la Chine a importé 25 861 tonnes de carbonate de lithium en juin 2026, dont 8 403 tonnes provenaient d'Argentine, soit environ 32 % du total. Les importations en provenance d'Argentine ont atteint 11 422 tonnes en mai, un pic récent. L'Argentine est devenue la deuxième source de carbonate de lithium importé par la Chine, avec des volumes mensuels généralement compris entre 8 000 et 11 000 tonnes. Par conséquent, les perturbations des expéditions des projets de salars argentins ont désormais un impact plus important sur la structure des importations chinoises qu'auparavant. Analyse de scénarios SMM Sur la base des capacités nominales actuelles, si seuls les projets Fénix et 3Q subissaient un arrêt effectif de production de 10 jours, l'impact théorique sur la production serait d'environ 1 000 à 1 500 tonnes d'équivalent carbonate de lithium (LCE). Si l'on prend également en compte la montée en puissance du projet Sal de Vida et les perturbations logistiques d'autres projets autour du Salar del Hombre Muerto, le volume théorique de production ou d'expéditions à risque pourrait atteindre 1 500 à 2 500 tonnes de LCE. Cependant, aucun exploitant n'a encore confirmé un arrêt complet, et certains projets pourraient maintenir des expéditions à court terme grâce à leurs stocks sur site. Ces chiffres doivent donc être considérés comme le volume exposé à une perturbation potentielle plutôt que comme des pertes d'approvisionnement confirmées. Dans le scénario de base, en supposant que la perturbation météorologique dure principalement une à deux semaines, l'impact sur les importations chinoises se traduirait plus probablement par un report d'environ 800 à 1 500 tonnes de carbonate de lithium entre août et septembre. Cela équivaudrait à environ 10 % à 18 % des importations chinoises de carbonate de lithium en provenance d'Argentine en juin et à environ 3 % à 6 % des importations mensuelles totales de carbonate de lithium de la Chine. Dans un scénario plus sévère, si la production ou le transport sortant des projets Fénix, 3Q et des projets voisins demeure contraint pendant deux à trois semaines, le volume d'importations en Chine retardé sur un seul mois pourrait atteindre 2 000 à 3 000 tonnes. Cela équivaudrait à environ 24%–36% des expéditions mensuelles actuelles de l'Argentine vers la Chine et à environ 8%–12% des importations mensuelles totales de carbonate de lithium de la Chine. Ces estimations sont des calculs basés sur des scénarios, dérivés des capacités des projets, des structures d'importation récentes et de différentes durées de perturbation. L'impact réel dépendra de la vitesse de réouverture des routes, des niveaux de stocks des projets individuels et de la répartition des destinations des expéditions de chaque producteur. Dans l'ensemble, la tempête de neige actuelle ne constitue pas encore une perturbation systémique de l'approvisionnement des salars sud-américains. Néanmoins, elle a déjà provoqué des perturbations tangibles des mouvements de personnel, de la logistique et des opérations sur site dans plusieurs projets clés de lithium de la province de Catamarca. À court terme, le marché devrait surveiller de près la réouverture de la route provinciale 43 et du poste-frontière de San Francisco, le statut opérationnel réel des projets Fénix et 3Q, ainsi que les données d'expédition de l'Argentine de fin juillet à août. Si l'accès aux transports est rétabli dans la semaine à venir, l'impact principal sera probablement un retard d'arrivée des importations en Chine. Si les restrictions sur les sites miniers persistent, l'offre effective de l'Argentine au troisième trimestre et les attentes d'importation de carbonate de lithium de la Chine pour août et septembre pourraient devoir être revues à la baisse. Sources : , SMM Lesley Yang, SMM Jessica Wang, SMM
24 Jul 2026 11:45
Dernières actualités
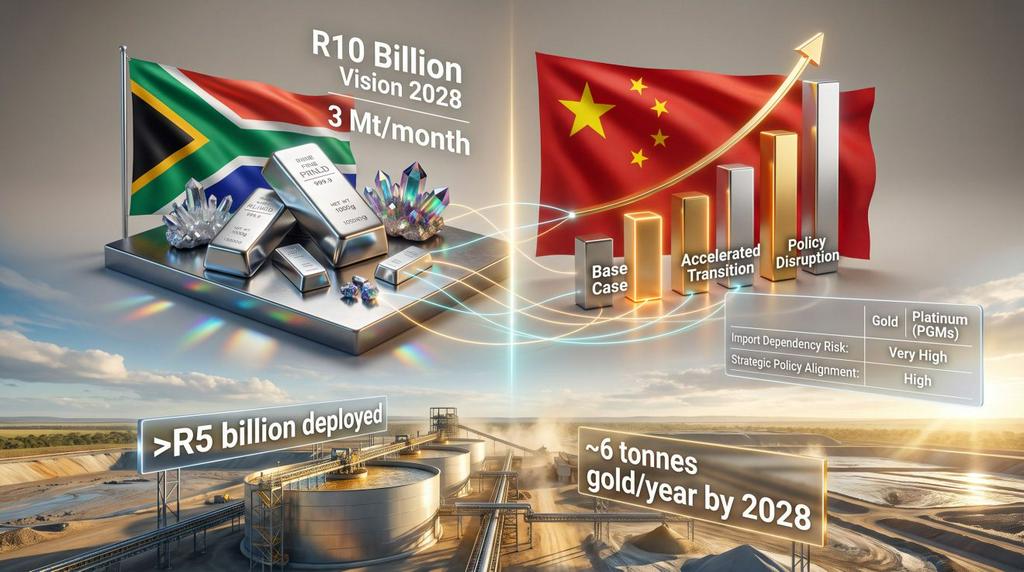
Le 15e plan quinquennal de la Chine met en avant les métaux du groupe du platine, stimulant les investissements miniers sud-africains.
il y a 12 heures
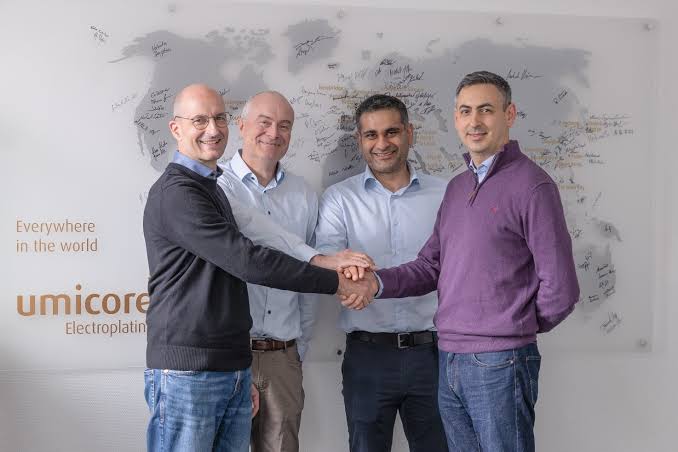
Valterra Platinum et Umicore MDS s'associent pour la technologie d'électrodéposition de MGP dans le secteur électronique
il y a 12 heures
![Le jeu du négoce des métaux précieux continue, consommation terne sur le marché du platine au comptant [Revue quotidienne SMM]](https://imgqn.smm.cn/usercenter/gePcx20251217171735.jpg)
Le jeu du négoce des métaux précieux continue, consommation terne sur le marché du platine au comptant [Revue quotidienne SMM]
il y a 23 heures
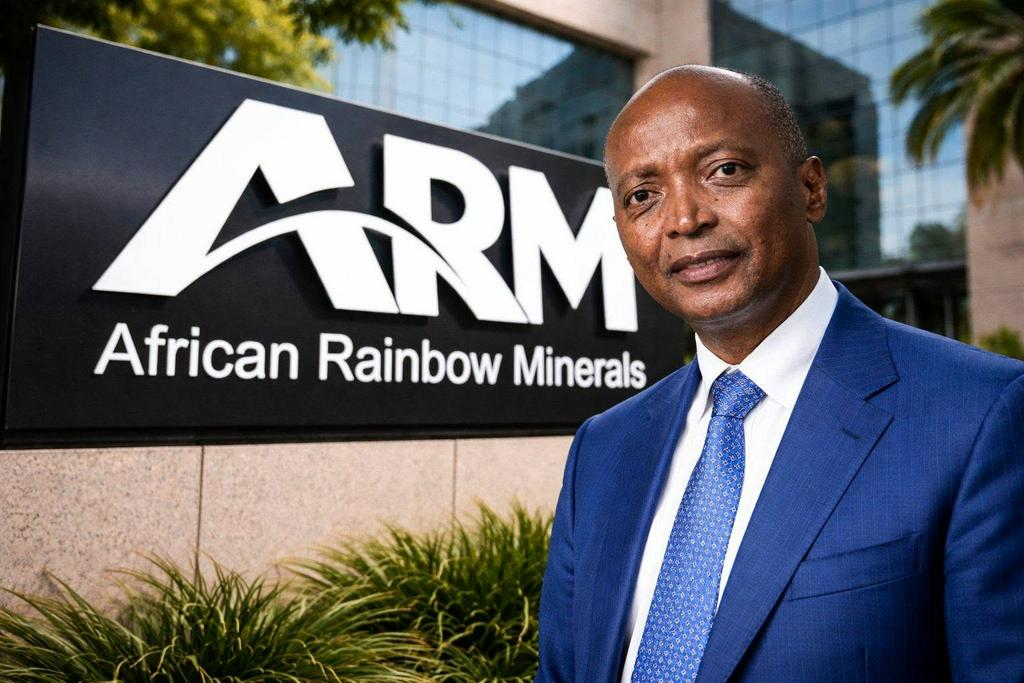
African Rainbow Minerals (ARM) investit 927 millions de dollars dans le réaménagement de la mine de platine Bokoni.
[SMM PGM Express] African Rainbow Minerals (ARM) a approuvé un investissement de près d’un milliard de dollars pour le redéveloppement de la mine de platine de Bokoni en Afrique du Sud, témoignant d’un regain de confiance dans les perspectives à long terme du platine, dans un contexte d’amélioration des prix et de resserrement de l’offre.
L’entreprise prévoit d’investir environ 927 millions de dollars dans un redéveloppement progressif de Bokoni, qui devrait devenir une source importante de métaux du groupe du platine (MGP). Une fois pleinement opérationnelle, la mine devrait produire annuellement environ 350 000 à 400 000 onces de MGP à six éléments, renforçant ainsi la base d’approvisionnement en platine de l’Afrique du Sud.
Cet investissement intervient alors que le marché mondial du platine continue de faire face à des défis d’approvisionnement. L’Afrique du Sud reste le premier producteur de platine, mais la hausse des coûts d’exploitation, les contraintes énergétiques et les périodes antérieures de prix bas ont conduit à des fermetures de mines, des réductions de production et des reports de projets. La récente amélioration des prix du platine a encouragé les producteurs à reconsidérer des investissements précédemment différés.
24 Jul 2026 19:48
Le palladium glisse à 1 255,30 $/oz en raison de la faiblesse de la demande et des risques d’approvisionnement
[SMM Express] Les contrats à terme sur le palladium de juillet du NYMEX se sont établis à 1 255,30 USD l'once le 23 juillet, reflétant la faiblesse persistante du marché du palladium dans un contexte de demande industrielle prudente et de sentiment plus morose sur les métaux précieux.
Malgré le récent recul, les fondamentaux du marché du palladium restent étroitement liés à la consommation industrielle. Plus de la moitié de la demande mondiale provient du secteur automobile, où le métal est utilisé dans les convertisseurs catalytiques pour réduire les émissions des véhicules. La demande supplémentaire de l'électronique, de la joaillerie et des applications chimiques continue d'apporter un soutien sous-jacent.
Du côté de l'offre, la production mondiale demeure concentrée en Russie et en Afrique du Sud, avec une production relativement limitée au Canada. Les difficultés opérationnelles, notamment les contraintes d'approvisionnement en électricité et les perturbations liées à la main-d'œuvre en Afrique du Sud, continuent de faire peser des risques potentiels sur l'offre.
24 Jul 2026 15:55
La flambée des prix du pétrole met sous pression les contrats à terme sur les métaux précieux, consommation normale sur le marché au comptant [SMM Daily Review]
24 Jul 2026 11:45
Les tensions entre les États-Unis et l'Iran s'intensifient : Trump envisage une action militaire et déploie des bombardiers B-1 sur fond de débat au Congrès.
[SMM Precious Metal Express] Le conflit entre les États-Unis et l'Iran s'intensifie davantage : Trump a déclaré qu'il « envisage sérieusement » de relancer des opérations militaires à grande échelle contre l'Iran et qu'il est sur le point de prendre une décision, les fonds iraniens devant être utilisés pour indemniser les dommages aux navires. Les États-Unis ont déployé des bombardiers B-1 pour intensifier les attaques. La Chambre des représentants a adopté une nouvelle résolution appelant à la fin des hostilités, tandis que le Sénat a bloqué une mesure similaire.
24 Jul 2026 09:41
Les inscriptions initiales au chômage aux États-Unis chutent à 187 000, en deçà des attentes, signalant un marché du travail solide
[SMM Precious Metal Express] Les demandes initiales d’allocations chômage aux États-Unis pour la semaine se terminant le 18 juillet se sont établies à 187 000, bien en dessous des 212 000 attendues, ce qui indique une vigueur persistante du marché du travail.
24 Jul 2026 09:41
BCE maintient ses taux, alerte sur les risques d'inflation énergétique à venir
[SMM Precious Metal Express] La Banque centrale européenne a maintenu ses trois taux directeurs à l'identique, conformément aux attentes. Le communiqué souligne que l'impact total du choc énergétique sur l'inflation ne s'est pas encore concrétisé, Christine Lagarde avertissant que plus les prix de l'énergie restent élevés, plus le risque d'effets de second tour sur l'inflation globale est grand. Certains membres du Conseil des gouverneurs auraient plaidé pour une hausse immédiate, mais ont accepté d'attendre les données de septembre. Les marchés ont déjà quasiment intégré deux nouvelles hausses de taux d'ici la fin de l'année.
24 Jul 2026 09:40
[SMM Analysis] Les importations chinoises de palladium au premier semestre 2026 dépassent largement celles de platine ; variables clés à surveiller au second semestre
23 Jul 2026 19:02

Bilan des données d'importation et d'exportation du platine et du palladium au premier semestre 2026 : forte hausse collective des importations de platine et de palladium, l'offre physique de la Chine entre dans une fenêtre d'assouplissement [SMM Analysis
23 Jul 2026 18:10

Revue au comptant des composés de MGP : la demande rigide domine avec des tendances de prix divergentes selon la variété
23 Jul 2026 17:40
![Le platine et le palladium baissent, puis rebondissent et augmentent ; suivez de près le FOMC de fin juillet et les développements géopolitiques [Revue hebdomadaire SMM du platine et du palladium]](https://imgqn.smm.cn/usercenter/fNuSg20251217171735.jpg)
Le platine et le palladium baissent, puis rebondissent et augmentent ; suivez de près le FOMC de fin juillet et les développements géopolitiques [Revue hebdomadaire SMM du platine et du palladium]
23 Jul 2026 16:58
[Analyse SMM] Les tensions États-Unis-Iran poussent le pétrole à 90 $, les craintes d’inflation et les anticipations de hausse des taux pèsent sur les métaux précieux
Les signaux macroéconomiques étaient mitigés cette semaine. Les tensions au Moyen-Orient et les craintes de hausse des taux d’inflation ont pesé sur les métaux, tandis que la demande de valeurs refuges géopolitiques et les frictions commerciales ont apporté un soutien. Le dollar fort et les rendements élevés ont maintenu des flux prudents, les métaux précieux se consolidant sans qu’aucune tendance claire ne se dégage.
23 Jul 2026 16:57
Le prix du platine se consolide, la consommation sur le marché au comptant reste atone [Revue quotidienne SMM]
23 Jul 2026 12:03
Les contrats à terme sur métaux précieux bondissent, la consommation sur le marché au comptant du platine reste modérée [Revue quotidienne SMM]
22 Jul 2026 12:09
Les cours du platine se tiennent bien en séance, primes au comptant stables [Revue quotidienne SMM]
21 Jul 2026 12:06
Le cours du platine s'est consolidé en baisse en séance, la consommation sur le marché au comptant étant modérée [SMM Daily Review]
20 Jul 2026 12:07
Le prix du platine connaît un fort repli, les transactions sur le marché au comptant sont modérées [SMM Daily Review]
17 Jul 2026 12:09
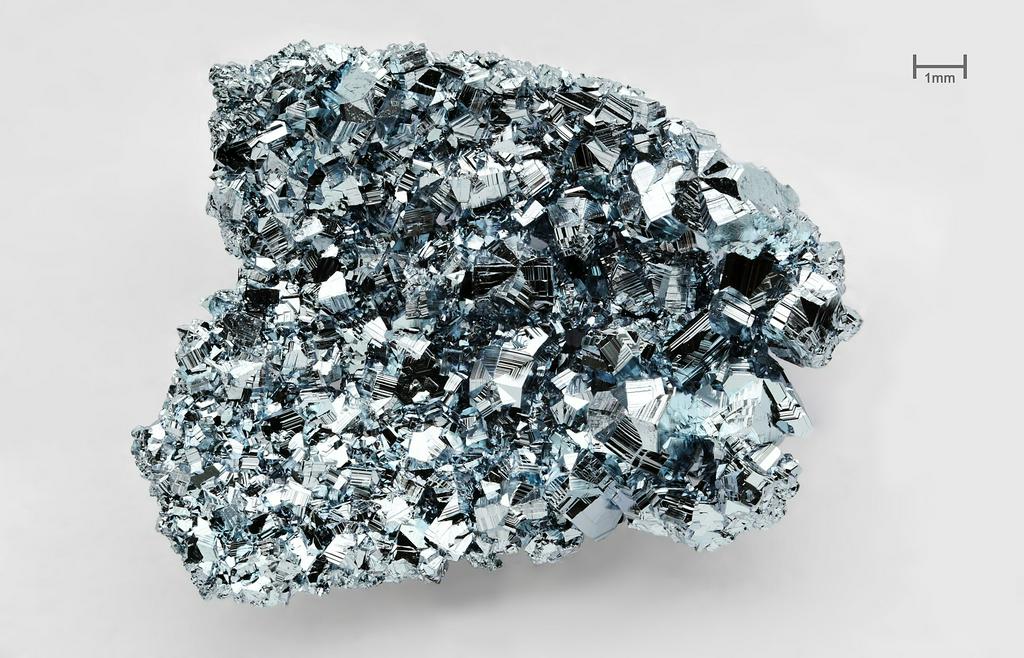
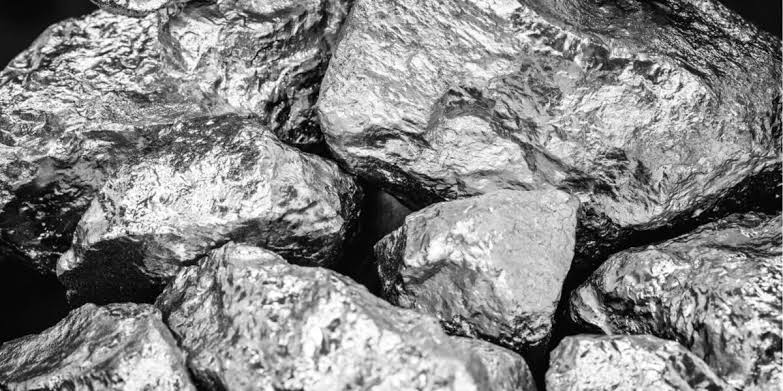
La rareté et les propriétés uniques de l'osmium stimulent le marché du luxe et la croissance des investissements.
[SMM PGM Express] L'osmium attire une attention croissante sur les marchés des produits de luxe et des investissements alternatifs, grâce à sa rareté exceptionnelle (le métal précieux le plus rare sur Terre) et à son utilisation croissante dans la joaillerie haut de gamme. Des sources industrielles indiquent que les prix de l'osmium cristallin ont augmenté de près de 500 % au cours des huit dernières années, reflétant une offre limitée et une demande croissante de la part des collectionneurs et des marques de luxe.
La production mondiale d'osmium reste extrêmement limitée, car ce métal n'est récupéré qu'en tant que sous-produit de l'exploitation minière des métaux du groupe du platine. Les estimations du secteur suggèrent qu'environ 22 tonnes d'osmium récupérable restent disponibles, ce qui souligne sa rareté et contribue à un marché mondial relativement restreint. La majeure partie de l'osmium cristallin raffiné est actuellement détenue par des investisseurs à long terme, limitant ainsi le volume disponible pour les échanges.
Au-delà de sa rareté, l'osmium cristallin est de plus en plus reconnu pour ses propriétés physiques uniques, notamment sa densité élevée, son éclat naturel et son système de certification traçable, ce qui le rend de plus en plus attrayant à la fois comme matériau de luxe et comme actif tangible. Alors que l'intérêt s'étend au-delà de l'Europe vers des marchés comme la Chine et les États-Unis, les acteurs du marché continueront de surveiller la disponibilité de l'offre, la demande des investisseurs et l'adoption par le secteur de la joaillerie de luxe, principaux moteurs des tendances futures des prix.
17 Jul 2026 11:58
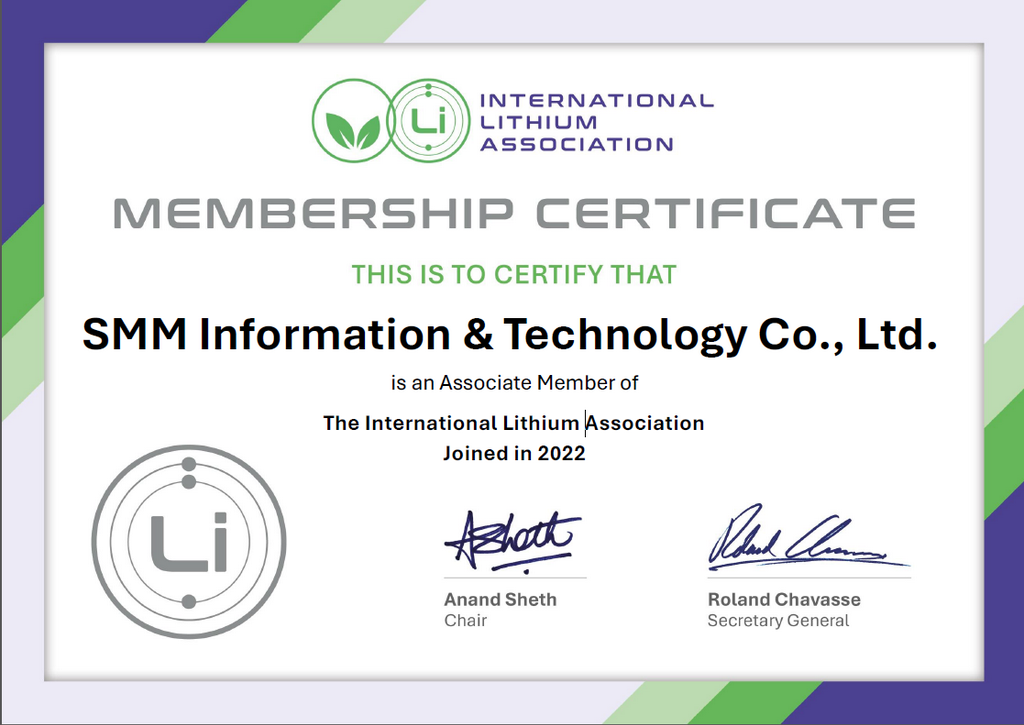
SMM a le plaisir d'annoncer quatre années consécutives d’adhésion à l’ILiA, tout en approfondissant la coopération mondiale sur le lithium.
Shanghai, le 23 juillet – Shanghai Metals Market (SMM) est ravi d'annoncer le maintien de son adhésion à l' pour la quatrième année consécutive depuis son adhésion en novembre 2022, en tant que membre senior de longue date et stable de l'association. Au fil des années, SMM s'est engagé à promouvoir un développement coordonné du secteur mondial du lithium et à approfondir progressivement sa coopération avec l'ILiA. Nous avons continuellement mis en place des plateformes d'échange et de réseautage reliant les acteurs de l'industrie du lithium en Chine et à l'étranger, et organisé de nombreux événements transfrontaliers du secteur. Par ailleurs, nous avons régulièrement co-organisé des webinaires en ligne sur les perspectives du marché mondial du lithium avec l'ILiA, offrant des données de marché sur l'ensemble de la chaîne industrielle, les tendances sectorielles et la recherche industrielle de pointe, favorisant ainsi l'échange de connaissances et un développement de qualité au sein de l'industrie du lithium, tant au niveau national qu'international. Fort de quatre années de coopération solide et d'une confiance mutuelle croissante dans le secteur, les deux parties ont récemment conclu un nouveau modèle de coopération amélioré, marquant un approfondissement global de leur partenariat : Martin Ma, responsable ILiA Chine, a prononcé un discours individuel à la SMM New Energy Industry Chain Expo (CLNB) 2026 Li-ION BATTERY Africa 2026 a établi un partenariat avec l'ILiA. Tom Drabble, responsable mondial du développement durable chez ILiA, a participé à une table ronde sur le thème « Assurer un approvisionnement stable en lithium, cobalt, graphite et phosphate – Rôle et défis de l'Afrique ». Astrid Karamira, directrice représentante EMEA chez ILiA, a prononcé un discours sur le thème « Tendances des matériaux - Décoder l'offre et la demande mondiales de métaux critiques » à la conférence SMM Li-ion Battery Europe 2024. Astrid Karamira a participé à une table ronde lors de la conférence SMM Li-ion Battery Europe 2025 sur le thème « Construire un écosystème européen des matières premières pour batteries, stimulé par les politiques – Défis et opportunités de la chaîne d'approvisionnement » Astrid Karamira est intervenue à la conférence SMM Li-ion Battery Americas 2024 Logan Lu, PDG de SMM, a déclaré que le renforcement de la coopération entre les deux parties est un choix inévitable en phase avec la mondialisation et le développement bas carbone de l'industrie du lithium. S'appuyant sur les capacités complètes de service de données de la chaîne industrielle de SMM, combinées aux avantages de plateforme de l'ILiA couvrant les leaders de l'industrie en amont et en aval à l'échelle mondiale, les deux parties mèneront à l'avenir une collaboration plus approfondie en matière de veille de marché, de développement ESG, de mise en relation industrielle transfrontalière et d'économie circulaire des batteries, favorisant la complémentarité des atouts et les bénéfices mutuels des ressources de la chaîne mondiale de l'industrie du lithium, et construisant ensemble un écosystème mondial de l'industrie du lithium vert, stable et synergique. À propos de l'International Lithium Association (ILiA) L'International Lithium Association (ILiA) a été fondée en 2021. C'est une association professionnelle internationale à but non lucratif pour l'industrie du lithium, qui défend les trois visions et missions suivantes : « donner une voix à l'industrie du lithium, renforcer l'ESG et le développement durable dans l'industrie du lithium, et devenir un organe faisant autorité pour l'industrie du lithium ». Outre 7 membres principaux, l'association compte également plus de 30 membres associés issus de la chaîne de valeur de l'industrie du lithium, impliqués dans des domaines d'activité tels que les projets d'extraction de lithium, les matériaux pour batteries, la fabrication de batteries ou l'ingénierie. Ses membres associés comprennent SMM, Albemarle Corporation, Chengxin Lithium, Tianqi Lithium, Rio Tinto, etc.
23 Jul 2026 09:08
SMM AICE visite la base vietnamienne de Xingfa Aluminum pour promouvoir le développement d’un système de tarification de l’aluminium au Vietnam
23 Jul 2026 10:32
![[Analyse SMM] Production d'acide sulfurique en Chine et importations & exportations de soufre/acide sulfurique au premier semestre 2026](https://imgqn.smm.cn/usercenter/OpmKJ20251217171712.jpg)
[Analyse SMM] Production d'acide sulfurique en Chine et importations & exportations de soufre/acide sulfurique au premier semestre 2026
23 Jul 2026 18:47
![[Analyse SMM] Les tensions États-Unis-Iran poussent le pétrole à 90 $, les craintes d’inflation et les anticipations de hausse des taux pèsent sur les métaux précieux](https://imgqn.smm.cn/usercenter/QnbfL20251217171735.jpeg)
[Analyse SMM] Les tensions États-Unis-Iran poussent le pétrole à 90 $, les craintes d’inflation et les anticipations de hausse des taux pèsent sur les métaux précieux
23 Jul 2026 16:57
John Paulson déclare que nous sommes aux premiers stades d'un marché haussier de long terme pour l'or.
23 Jul 2026 16:17
Décret exécutif de Trump resserre les règles sur les terres rares, mais l'écart d'approvisionnement en aimants aux États-Unis persiste jusqu'en 2027【Analyse SMM】
23 Jul 2026 12:27
![Une violente tempête de neige frappe la province argentine de Catamarca, menaçant la production et les expéditions de lithium [Analyse SMM]](https://imgqn.smm.cn/usercenter/mzgdV20251217171729.png)
Une violente tempête de neige frappe la province argentine de Catamarca, menaçant la production et les expéditions de lithium [Analyse SMM]
24 Jul 2026 11:45
Dernières actualités
Le 15e plan quinquennal de la Chine met en avant les métaux du groupe du platine, stimulant les investissements miniers sud-africains.
il y a 12 heures
Valterra Platinum et Umicore MDS s'associent pour la technologie d'électrodéposition de MGP dans le secteur électronique
il y a 12 heures
Le jeu du négoce des métaux précieux continue, consommation terne sur le marché du platine au comptant [Revue quotidienne SMM]
il y a 23 heures
African Rainbow Minerals (ARM) investit 927 millions de dollars dans le réaménagement de la mine de platine Bokoni.
24 Jul 2026 19:48
Le palladium glisse à 1 255,30 $/oz en raison de la faiblesse de la demande et des risques d’approvisionnement
24 Jul 2026 15:55
La flambée des prix du pétrole met sous pression les contrats à terme sur les métaux précieux, consommation normale sur le marché au comptant [SMM Daily Review]
24 Jul 2026 11:45
Les tensions entre les États-Unis et l'Iran s'intensifient : Trump envisage une action militaire et déploie des bombardiers B-1 sur fond de débat au Congrès.
24 Jul 2026 09:41
Les inscriptions initiales au chômage aux États-Unis chutent à 187 000, en deçà des attentes, signalant un marché du travail solide
24 Jul 2026 09:41
BCE maintient ses taux, alerte sur les risques d'inflation énergétique à venir
24 Jul 2026 09:40
[SMM Analysis] Les importations chinoises de palladium au premier semestre 2026 dépassent largement celles de platine ; variables clés à surveiller au second semestre
23 Jul 2026 19:02
Bilan des données d'importation et d'exportation du platine et du palladium au premier semestre 2026 : forte hausse collective des importations de platine et de palladium, l'offre physique de la Chine entre dans une fenêtre d'assouplissement [SMM Analysis
23 Jul 2026 18:10
Revue au comptant des composés de MGP : la demande rigide domine avec des tendances de prix divergentes selon la variété
23 Jul 2026 17:40
Le platine et le palladium baissent, puis rebondissent et augmentent ; suivez de près le FOMC de fin juillet et les développements géopolitiques [Revue hebdomadaire SMM du platine et du palladium]
23 Jul 2026 16:58
[Analyse SMM] Les tensions États-Unis-Iran poussent le pétrole à 90 $, les craintes d’inflation et les anticipations de hausse des taux pèsent sur les métaux précieux
23 Jul 2026 16:57
Le prix du platine se consolide, la consommation sur le marché au comptant reste atone [Revue quotidienne SMM]
23 Jul 2026 12:03
Les contrats à terme sur métaux précieux bondissent, la consommation sur le marché au comptant du platine reste modérée [Revue quotidienne SMM]
22 Jul 2026 12:09
Les cours du platine se tiennent bien en séance, primes au comptant stables [Revue quotidienne SMM]
21 Jul 2026 12:06
Le cours du platine s'est consolidé en baisse en séance, la consommation sur le marché au comptant étant modérée [SMM Daily Review]
20 Jul 2026 12:07
Le prix du platine connaît un fort repli, les transactions sur le marché au comptant sont modérées [SMM Daily Review]
17 Jul 2026 12:09
La rareté et les propriétés uniques de l'osmium stimulent le marché du luxe et la croissance des investissements.
17 Jul 2026 11:58