Actualités
Article d'analyse exclusif avec les dernières mises à jour du marché et des flux d'actualités en temps réel.
John Paulson déclare que nous sommes aux premiers stades d'un marché haussier de long terme pour l'or.
Publié le mercredi 22 juillet 2026 à 16h41 EDT John Paulson, le gestionnaire de fonds spéculatifs qui a gagné des milliards en pariant contre le marché immobilier américain avant de devenir haussier sur l’or, a déclaré qu’il pense que le métal précieux n’en est qu’aux premiers stades d’une reprise à long terme. « Je pense vraiment que nous sommes aux débuts ou aux premiers stades d’un marché haussier à long terme pour l’or », a déclaré Paulson mercredi sur « The Exchange » de CNBC. « À mesure que les gens perdent confiance dans les monnaies papier, l’or comme alternative continuera de croître. » Paulson, dont le pari contre les prêts hypothécaires à risque est devenu l’une des transactions les plus rentables de l’histoire de Wall Street, s’est tourné vers l’or en 2009, estimant que les mesures de relance budgétaire et monétaire sans précédent après la crise financière finiraient par affaiblir le dollar américain. Depuis lors, les prix de l’or ont à peu près quadruplé, dépassant le seuil des 5 000 dollars avant de refluer. L’investisseur milliardaire a déclaré que la demande de lingots continue de s’élargir, portée par les banques centrales qui renforcent leurs réserves, ainsi que par l’intérêt croissant du secteur privé. « L’or est en train de devenir la monnaie de réserve la plus appropriée au monde, remplaçant les monnaies fiduciaires », a déclaré Paulson. « La demande des banques centrales, par exemple, n’a cessé de croître, tout comme celle du secteur privé. » Paulson a également soutenu que les investisseurs ont davantage intérêt à détenir des actions de sociétés minières aurifères que des lingots eux-mêmes, en particulier les entreprises disposant d’importantes réserves non exploitées. « Je pense que la meilleure façon d’investir est d’investir dans des actions aurifères en phase de démarrage », a-t-il déclaré. Paulson a fait ces commentaires alors que annonçait l’acquisition de la participation de 40 % de Paulson Advisers dans le en Alaska. Paulson, qui est coprésident de NovaGold, a déclaré que la société offre aux investisseurs une exposition avec effet de levier à la hausse du prix de l’or grâce à sa base de ressources considérable. « NovaGold possède 40 millions d’onces d’or en ressources indiquées et mesurées et en réserves, pour une capitalisation boursière de 4,2 milliards de dollars », a déclaré Paulson. « Je pense que la meilleure façon de jouer l’or est via des actions comme NovaGold, sinon NovaGold elle-même. » Source :
23 Jul 2026 16:17
Décret exécutif de Trump resserre les règles sur les terres rares, mais l'écart d'approvisionnement en aimants aux États-Unis persiste jusqu'en 2027【Analyse SMM】
Le décret de Trump renforce les règles de défense sur les terres rares, mais l’écart d’approvisionnement en aimants des États-Unis ne sera pas comblé d’ici 2027 Le 20 juillet, le président Donald Trump a signé un décret exécutif ordonnant au département de la Défense de supprimer progressivement d’ici le 1er janvier 2027 la plupart des dérogations qui permettaient aux entrepreneurs de la défense de se procurer des aimants en samarium-cobalt (SmCo) et en néodyme-fer-bore (NdFeB), du tantale et ses alliages, de la poudre de tungstène et des alliages lourds, ainsi que du molybdène auprès de « pays étrangers non alliés » — à savoir la Chine, la Russie, l’Iran et la Corée du Nord. À partir de 2027, tout entrepreneur ou sous-traitant sollicitant une dérogation devra soumettre un plan d’atténuation approuvé par le DoD, prouver l’origine précise des matériaux non conformes, démontrer des efforts considérables pour trouver des alternatives conformes et présenter un calendrier pour éliminer les matériaux interdits de leurs chaînes d’approvisionnement. Parallèlement, le décret demande au DoD de publier des orientations politiques dans les 180 jours, incitant les entrepreneurs à cartographier les chaînes d’approvisionnement critiques « des matières premières aux produits finaux » et à commencer à qualifier les sources nationales de minéraux, matériaux et composants critiques. Le véritable enjeu du décret : combler les failles, pas innover Pour mesurer la portée réelle de ce décret, il faut le lire à la lumière de l’article 4872 du titre 10 du Code des États-Unis, adopté en 2018, qui interdisait déjà au DoD d’acheter les matériaux sensibles susmentionnés à des « pays adversaires », les aimants SmCo et NdFeB étant les principaux produits de terres rares concernés. Le problème était que, depuis des années, l’industrie nationale américaine d’aimants permanents à base de terres rares restait trop faible pour répondre à la demande de la défense, si bien que le DoD n’a cessé d’accorder des dérogations au cas par cas pour maintenir légalement les importations chinoises. Le véritable mordant du décret de Trump ne réside pas dans l’interdiction d’achat elle-même — la loi l’exigeait déjà — mais dans le passage des dérogations d’une « attribution par défaut » à une « révision stricte au cas par cas », l’« incapacité de constituer un approvisionnement national » étant explicitement exclue comme excuse valable. Le conseiller commercial de la Maison-Blanche, Peter Navarro, l’a dit sans détour : les entrepreneurs ne pourront plus prétendre qu’ils n’avaient pas le choix sans avoir tenté quoi que ce soit. Symboliquement, cela marque la volonté de l’administration Trump de faire passer la « dé-sinisation de la chaîne d’approvisionnement de défense » du slogan à une institution contraignante. Pourquoi les États-Unis s’inspirent désormais de la méthode chinoise La disposition la plus révélatrice est l’obligation, dans les 180 jours, de mettre en place un système de traçabilité complet de la chaîne — une référence claire à la Chine. Depuis l’entrée en vigueur de la Réglementation sur les terres rares le 1er octobre 2024, la Chine exige des entreprises minières et de fusion-séparation qu’elles tiennent des registres de flux. En février 2025, le ministère de l’Industrie et des Technologies de l’information (MIIT) a diffusé pour commentaires publics le Projet de mesures provisoires pour la gestion de la traçabilité des produits à base de terres rares , instaurant un système de traçabilité des terres rares géré conjointement par le MIIT, le ministère des Ressources naturelles, le ministère du Commerce, l’Administration générale des douanes et l’Administration fiscale d’État, couvrant l’ensemble de la chaîne, de la production à l’utilisation, en passant par la circulation. Les entreprises doivent télécharger les données de flux de produits sur la plateforme gouvernementale de traçabilité avant le 10 de chaque mois. À cela s’ajoutent les contrôles à l’exportation sur les terres rares moyennes et lourdes mis en œuvre depuis avril 2025, la règle de « traçabilité de minimis » exigeant des licences pour les produits réexportés contenant des terres rares chinoises au-delà de certains seuils, et les mécanismes de récompense des lanceurs d’alerte déployés en juillet 2026. Ces éléments forment ensemble un système réglementaire en boucle fermée : quotas – traçabilité – examen des exportations – lutte contre la contrebande. L’exigence américaine de cartographier les chaînes d’approvisionnement « des matières premières aux produits militaires finaux » est, au fond, une reconnaissance du fait que toute interdiction d’achat reste lettre morte sans visibilité sur les flux en aval. La Chine a utilisé son système de traçabilité pour affiner son levier sur les terres rares ; les États-Unis sont désormais contraints d’en tirer la même leçon. La réalité pour la défense américaine : l’écart en aimants ne pourra pas être comblé d’ici 2027 Le consensus du marché selon lequel cette interdiction a une portée bien plus symbolique que pratique se vérifie — la cause profonde étant la situation embarrassante des capacités américaines en aimants permanents à base de terres rares. La ligne de production commerciale d’aimants NdFeB frittés d’USA Rare Earth à Stillwater, en Oklahoma, n’a commencé sa mise en service qu’en mars 2026. L’entreprise prévoit d’atteindre un rythme de 600 tonnes métriques par an (tpa) d’ici la fin du quatrième trimestre 2026, pour passer à un total de 1 200 tpa sur deux lignes au premier trimestre 2027. Même en ajoutant la nouvelle base prévue de 6 400 tpa au parc industriel Bailey en Caroline du Sud, ainsi que les projets de soutien tels que la conversion de NdPr de MP Materials au Texas et l’usine de séparation des terres rares lourdes de Lynas au Texas, les progrès restent dans la phase de montée en puissance « de 0 à 1 ». À titre de comparaison, les fabricants d’aimants japonais bien établis — Proterial, Shin-Etsu — affichent chacun des capacités de 2 000 à 3 000 tpa sur un seul site, avec de profondes barrières techniques, tandis que la Chine domine la production et le raffinage mondiaux d’aimants à base de terres rares. La demande annuelle américaine d’aimants NdFeB pour la défense et l’industrie de pointe dépasse de loin la somme de toutes les capacités prévues sur le territoire national, ce qui signifie qu’à l’échéance de 2027, l’offre intérieure sera nettement insuffisante pour compenser le vide. Le segment des terres rares lourdes est encore plus précaire. L’oxyde de NdPr de MP Materials n’a pas encore été effectivement converti en métal et en aimants à court terme. L’usine de séparation des terres rares lourdes de Lynas au Texas reste à la traîne. Energy Fuels a dépensé des sommes considérables pour acquérir le fabricant européen d’aimants VAC afin d’étendre sa capacité d’aimants contenant des terres rares lourdes, mais l’offre à court terme d’aimants haute performance à base de dysprosium et de terbium reste insuffisante, la matière première étant encore largement dépendante des transbordements chinois ou de pays alliés. Impact prévu sur les exportations chinoises de terres rares Pour la Chine, ce décret ajoute une incertitude supplémentaire à la prolongation des contrôles à l’exportation fin 2026 et à la délivrance de licences générales. Compte tenu des ajustements du marché après le durcissement d’avril 2025 et de l’affinement progressif des cadres juridiques et politiques pertinents, la probabilité d’une répétition des restrictions agressives d’avril 2025 est relativement faible. Cependant, les volumes totaux d’exportation de NdFeB en 2026 devraient en pâtir. À moyen et long terme, la « dé-sinisation » américaine progressera sur deux voies : l’une est le modèle d’intégration verticale « de la mine à l’aimant » illustré par USA Rare Earth, visant une capacité de 10 000 tpa de NdFeB ; l’autre est l’expansion des capacités des bases d’aimants haut de gamme au Japon et en Europe (VAC, Neo, etc.). Les deux voies pointent vers la même réalité : les États-Unis mettent 5 à 10 ans pour combler l’écart en aimants, mais avec une demande rigide de la chaîne d’approvisionnement de défense, la courbe de diminution de la dépendance à la Chine pendant la période de transition sera bien plus plate que ne le suggère le discours politique. Un détail facile à négliger : le décret exclut explicitement de son champ d’application la Réserve stratégique américaine de minéraux critiques (le dénommé « Project Vault ») et les minéraux critiques produits par des projets soutenus financièrement par l’EXIM ou la DFC. Cela laisse en fait une « porte dérobée » aux États-Unis : le stockage stratégique et les projets financés par le gouvernement fédéral peuvent encore être gérés avec souplesse. Cela confirme aussi, de manière indirecte, que la véritable intention de ce décret penche davantage vers « établir des règles et renforcer la responsabilité » que vers « couper l’approvisionnement demain ». Évaluation finale Placé dans le contexte plus large de la compétition sino-américaine sur les terres rares, ce décret n’est ni la frappe décisive de « découplage », ni un simple geste politique symbolique. Il s’agit d’un acte d’ alignement institutionnel : les États-Unis ont compris que, pour disposer d’un levier équivalent dans le jeu des terres rares, ils doivent d’abord se doter d’une visibilité de la chaîne d’approvisionnement comparable à celle de la Chine. Mais les institutions peuvent être signées du jour au lendemain ; les capacités doivent être augmentées tonne par tonne.
23 Jul 2026 12:27
Une violente tempête de neige frappe la province argentine de Catamarca, menaçant la production et les expéditions de lithium [Analyse SMM]
Le plateau de la Puna, dans la province de Catamarca en Argentine, a récemment été frappé par une tempête de neige historique, accompagnée de vents violents et de températures extrêmement basses. Les températures dans la région de Tres Quebradas seraient descendues à environ -27 °C, tandis que les chutes de neige ont dépassé un mètre par endroits, immobilisant temporairement plusieurs travailleurs de projets sur les sites miniers. Autour du Salar del Hombre Muerto, l'accumulation de neige sur certaines routes a atteint 1 à 2 mètres. La route provinciale 43, qui relie Antofagasta de la Sierra aux projets salins environnants, ainsi que plusieurs routes de haute altitude, est devenue en grande partie impraticable. Les transferts de personnel du projet Fénix de Rio Tinto ont également été affectés. Au soir du 23 juillet, le poste-frontière international de San Francisco entre Catamarca et le Chili restait fermé en raison des routes enneigées. Du point de vue de la distribution des projets, la perturbation météorologique actuelle est principalement concentrée dans la province de Catamarca, et non dans toute la région des salars d'Amérique du Sud. Des informations publiques confirment des perturbations dans les mouvements de personnel et l'accès aux sites miniers pour les projets 3Q et Fénix. Fénix a une capacité existante de produits lithinifères d'environ 32 000 tonnes par an, tandis que la phase 1 du projet 3Q a une capacité de carbonate de lithium de 20 000 tonnes par an. La région plus large abrite également le projet Sal de Vida de 15 000 tonnes par an, ainsi que Sal de Oro, Hombre Muerto Ouest et plusieurs autres projets en exploitation, en montée en puissance ou en construction. Aucun opérateur majeur n'a encore officiellement annoncé un arrêt complet de la production ou une révision à la baisse de ses prévisions de production. Les fermetures de routes ne doivent donc pas être assimilées à une perte totale de production salifère. SMM estime que l'impact immédiat se reflétera d'abord dans les rotations de personnel, les livraisons d'intrants de production, la maintenance des équipements et le transport sortant des produits finis. Fénix utilise un procédé d'extraction directe du lithium par adsorption, ce qui signifie que les conditions météorologiques extrêmes sont plus susceptibles d'affecter l'exploitation par des contraintes logistiques et des perturbations des opérations continues sur site. Le projet 3Q et d'autres opérations utilisant des bassins d'évaporation sont confrontés non seulement à des risques de transport, mais aussi à des impacts différés potentiels sur l'efficacité de l'évaporation et la concentration des saumures en raison de chutes de neige prolongées, de basses températures et de la fonte subséquente des neiges. Si l'accès routier se rétablit rapidement, l'impact principal pourrait se limiter à un retard dans les calendriers d'expédition plutôt qu'à une perte définitive de production annuelle. En revanche, si les restrictions sur les grands axes routiers et les opérations minières persistent plus de deux semaines, la perturbation pourrait commencer à affecter la production du troisième trimestre et les calendriers de montée en puissance des projets plus récents. Concernant les importations, la Chine a importé 25 861 tonnes de carbonate de lithium en juin 2026, dont 8 403 tonnes provenaient d'Argentine, soit environ 32 % du total. Les importations en provenance d'Argentine ont atteint 11 422 tonnes en mai, un pic récent. L'Argentine est devenue la deuxième source de carbonate de lithium importé par la Chine, avec des volumes mensuels généralement compris entre 8 000 et 11 000 tonnes. Par conséquent, les perturbations des expéditions des projets de salars argentins ont désormais un impact plus important sur la structure des importations chinoises qu'auparavant. Analyse de scénarios SMM Sur la base des capacités nominales actuelles, si seuls les projets Fénix et 3Q subissaient un arrêt effectif de production de 10 jours, l'impact théorique sur la production serait d'environ 1 000 à 1 500 tonnes d'équivalent carbonate de lithium (LCE). Si l'on prend également en compte la montée en puissance du projet Sal de Vida et les perturbations logistiques d'autres projets autour du Salar del Hombre Muerto, le volume théorique de production ou d'expéditions à risque pourrait atteindre 1 500 à 2 500 tonnes de LCE. Cependant, aucun exploitant n'a encore confirmé un arrêt complet, et certains projets pourraient maintenir des expéditions à court terme grâce à leurs stocks sur site. Ces chiffres doivent donc être considérés comme le volume exposé à une perturbation potentielle plutôt que comme des pertes d'approvisionnement confirmées. Dans le scénario de base, en supposant que la perturbation météorologique dure principalement une à deux semaines, l'impact sur les importations chinoises se traduirait plus probablement par un report d'environ 800 à 1 500 tonnes de carbonate de lithium entre août et septembre. Cela équivaudrait à environ 10 % à 18 % des importations chinoises de carbonate de lithium en provenance d'Argentine en juin et à environ 3 % à 6 % des importations mensuelles totales de carbonate de lithium de la Chine. Dans un scénario plus sévère, si la production ou le transport sortant des projets Fénix, 3Q et des projets voisins demeure contraint pendant deux à trois semaines, le volume d'importations en Chine retardé sur un seul mois pourrait atteindre 2 000 à 3 000 tonnes. Cela équivaudrait à environ 24%–36% des expéditions mensuelles actuelles de l'Argentine vers la Chine et à environ 8%–12% des importations mensuelles totales de carbonate de lithium de la Chine. Ces estimations sont des calculs basés sur des scénarios, dérivés des capacités des projets, des structures d'importation récentes et de différentes durées de perturbation. L'impact réel dépendra de la vitesse de réouverture des routes, des niveaux de stocks des projets individuels et de la répartition des destinations des expéditions de chaque producteur. Dans l'ensemble, la tempête de neige actuelle ne constitue pas encore une perturbation systémique de l'approvisionnement des salars sud-américains. Néanmoins, elle a déjà provoqué des perturbations tangibles des mouvements de personnel, de la logistique et des opérations sur site dans plusieurs projets clés de lithium de la province de Catamarca. À court terme, le marché devrait surveiller de près la réouverture de la route provinciale 43 et du poste-frontière de San Francisco, le statut opérationnel réel des projets Fénix et 3Q, ainsi que les données d'expédition de l'Argentine de fin juillet à août. Si l'accès aux transports est rétabli dans la semaine à venir, l'impact principal sera probablement un retard d'arrivée des importations en Chine. Si les restrictions sur les sites miniers persistent, l'offre effective de l'Argentine au troisième trimestre et les attentes d'importation de carbonate de lithium de la Chine pour août et septembre pourraient devoir être revues à la baisse. Sources : , SMM Lesley Yang, SMM Jessica Wang, SMM
24 Jul 2026 11:45
Dernières actualités

SMM Daily : Le prix spot du carbonate de lithium se consolide à la hausse le 27 juillet.
il y a 16 heures
Revue quotidienne SMM : Le prix au comptant du carbonate de lithium baisse légèrement le 24 juillet
24 Jul 2026 18:17
![[Batterie à l'état solide : Huashang Zhongke réussit son essai pilote de sulfure de lithium de haute pureté à 99,95 %, plusieurs entreprises du Shandong se positionnent sur le sulfure de lithium]](https://imgqn.smm.cn/usercenter/JSjkr20251217171728.jpg)
[Batterie à l'état solide : Huashang Zhongke réussit son essai pilote de sulfure de lithium de haute pureté à 99,95 %, plusieurs entreprises du Shandong se positionnent sur le sulfure de lithium]
24 Jul 2026 10:01
Zhu Xiao, directeur R&D de Liaoning Xiangyu Aluminum, a participé à l’ASCC pour discuter de l’orientation de l’itération des performances de l’alliage d’aluminium de la série 6000 dans le domaine automobile.
23 Jul 2026 17:38
Hyundai Motor annonce ses résultats de ventes du deuxième trimestre
Les ventes mondiales de Hyundai Motor au deuxième trimestre ont atteint 991 885 unités, en baisse de 6,9 % par rapport à l'année précédente.
Les ventes domestiques ont chuté de 16,4 % pour s'établir à 157 647 unités en raison de perturbations d'approvisionnement causées par un incendie chez un fournisseur de pièces. Les ventes à l'étranger ont également reculé de 4,9 % pour atteindre 834 238 unités, dans un contexte de ralentissement de la demande automobile mondiale.
Aux États-Unis, Hyundai Motor a vendu 264 587 unités, en hausse de 0,9 % sur un an. Les ventes d'hybrides ont atteint 187 661 unités au deuxième trimestre, un record trimestriel, tandis que les ventes de véhicules électriques se sont établies à 69 366 unités.
Les ventes combinées de véhicules électrifiés, hybrides et électriques, ont augmenté de 1,7 % pour atteindre 266 627 unités.
23 Jul 2026 17:22
Les ventes intérieures et les exportations de véhicules à énergie nouvelle de la Corée rebondissent en juin, tirées par les hybrides électriques.
Les ventes intérieures de véhicules à énergies nouvelles (NEV) en Corée ont augmenté de 22,1 % par rapport au mois précédent pour atteindre 93 722 unités en juin, tandis que les exportations combinées de BEV, HEV et PHEV ont progressé de 23,3 % pour s'établir à 102 551 unités. Les HEV ont représenté environ 78 % de la croissance additionnelle sur les deux marchés. Les volumes de BEV ont également enregistré des gains à deux chiffres, mais leur part a diminué, les HEV progressant plus rapidement, ce qui met en évidence un écart entre la reprise globale du marché automobile et le rythme de l'électrification menée par les BEV.
22 Jul 2026 16:37
[Conférence automobile] Xiongchuang Aluminum Alloy vous invite à assister à la Conférence SMM ASCC2026 (8e) sur la chaîne d'approvisionnement automobile
22 Jul 2026 11:36
[Auto Club] Alumi Technology vous invite à participer à la conférence SMM ASCC2026 (8e) sur la chaîne d'approvisionnement automobile.
21 Jul 2026 17:14
Centre sino-kazakh de PV pérovskite et de stockage d'énergie tout-solide dévoilé à Ordos
[Batterie tout-solide : le Centre de recherche sino-kazakh sur le photovoltaïque pérovskite et le stockage d’énergie tout-solide inauguré à Ordos] Le 6 juillet 2026, le Centre de recherche sino-kazakh sur le photovoltaïque pérovskite et le stockage d’énergie tout-solide a été officiellement inauguré à l’Institut de recherche sur les nouvelles énergies d’Ordos. Créé conjointement par l’Université Beihang, l’Université Nazarbayev du Kazakhstan et l’Institut de recherche sur les nouvelles énergies d’Ordos, le centre exploitera les ressources industrielles d’Ordos et les atouts de recherche de Beihang pour favoriser la recherche conjointe et le transfert de technologie dans le photovoltaïque pérovskite et le stockage d’énergie tout-solide, édifiant ainsi une plateforme d’innovation pour la coopération sino-kazakhe dans les nouvelles énergies. SMM estime que le déploiement de projets de stockage d’énergie tout-solide à grande échelle est encore à plus de cinq ans.
21 Jul 2026 16:46
[Batterie à semi-conducteurs : ECOPRO BM de Corée du Sud dévoile sa feuille de route de développement de matériaux de base pour les batteries tout-solide]
[Piles à état solide : ECOPRO BM de Corée du Sud dévoile sa feuille de route pour les matériaux de base des batteries tout-solide] Le 16 juillet 2026, ECOPRO BM a tenu une réunion d'information pour les investisseurs particuliers au siège de NH Investment & Securities à Yeouido, Séoul, en présence de Kim Jangwoo, représentant de la direction, de Gong Bohyeon, directeur exécutif de la R&D, et de Shin Hosang, directeur exécutif des achats, qui ont pris la parole. Le 19 juillet, l'entreprise a officiellement présenté sa feuille de route pour les matériaux de base des batteries tout-solide, couvrant les électrolytes solides, les matériaux de cathode et d'anode de nouvelle génération, ainsi que les batteries sodium-ion.
21 Jul 2026 13:56

Les ventes chinoises de batteries d'énergie et de stockage d'énergie s'envolent en juin 2026, en hausse de 49,1 % sur un an.
17 Jul 2026 16:25
Les exportations automobiles chinoises devraient dépasser les 10 millions d'unités cette année.
17 Jul 2026 10:35
![[Conférence Automobile] Lixin New Materials vous invite à la conférence SMM ASCC2026 (8e édition) sur la chaîne d'approvisionnement automobile.](https://imgqn.smm.cn/usercenter/BrEfh20251217171652.jpg)
[Conférence Automobile] Lixin New Materials vous invite à la conférence SMM ASCC2026 (8e édition) sur la chaîne d'approvisionnement automobile.
17 Jul 2026 10:25
Données de production et de ventes automobiles du premier semestre publiées, les exportations dépassent les attentes : où en sont les objectifs annuels des constructeurs ? [Spécial SMM]
16 Jul 2026 17:52
Hoshine Silicon prévoit de passer d'une perte à un bénéfice au premier semestre en glissement annuel.
Hoshine Silicon a publié ses prévisions de résultats le 14 juillet, anticipant un bénéfice net attribuable aux actionnaires de la société mère pour le premier semestre 2026 compris entre 320 et 380 millions de yuans, ce qui représente un retour à la rentabilité en glissement annuel. Au premier semestre 2026, grâce à une hausse en glissement annuel du taux d'utilisation des capacités de production de silicium métal, les volumes de production et de vente ont connu une forte croissance ; parallèlement, l'équilibre offre-demande dans l'industrie du silicone s'est amélioré, les prix de marché des principaux produits ont augmenté et la marge brute globale de l'entreprise a nettement progressé, entraînant une amélioration substantielle en glissement annuel de la performance opérationnelle.
16 Jul 2026 09:23
Ganfeng Lithium s'attend à un retour à la rentabilité en glissement annuel au premier semestre.
Ganfeng Lithium a annoncé le 14 juillet prévoir un bénéfice net attribuable aux actionnaires de la société cotée pour le premier semestre 2026 compris entre 3,65 milliards et 4,6 milliards de yuans, soit un retour à la rentabilité en glissement annuel. Au cours de la période considérée, bénéficiant du développement rapide de l’industrie mondiale des énergies nouvelles et de la demande croissante de produits chimiques à base de lithium de la part des clients en aval, les prix de vente des produits chimiques à base de lithium de l’entreprise ont nettement augmenté en glissement annuel. Parallèlement, avec la libération progressive des capacités des projets de ressources en lithium, la structure des coûts de l’entreprise a été efficacement optimisée. La croissance soutenue de la demande sur le marché du stockage d’énergie a également entraîné une hausse notable des volumes de production et de vente du segment des batteries au lithium, contribuant ainsi à l’amélioration en glissement annuel des performances opérationnelles de l’entreprise.
16 Jul 2026 09:22
[Automobile : CATL et le groupe de transport public de Luzhou signent une coopération stratégique]
Récemment, le compte officiel WeChat de CATL a annoncé la signature d’un accord-cadre de coopération stratégique avec le Groupe de transport public de Luzhou. Les deux parties renforceront leur collaboration dans des domaines tels que le recyclage en cascade et la réutilisation des batteries hors d’usage, les services après-vente Ningjia, le déploiement de la technologie vehicle-to-grid (V2G), et l’extension des scénarios logistiques et de transport de passagers dans l’économie à basse altitude. À Luzhou, dans le Sichuan, 877 bus électriques sont déjà équipés de batteries CATL. Après leur retrait du service, ces batteries continueront d’être valorisées en étant réaffectées à des véhicules électriques à basse vitesse, au stockage d’énergie de secours ou à l’extraction et la réutilisation de métaux précieux, selon leur capacité restante. Cela permet aux transports publics urbains de boucler une boucle complète, du déplacement écologique au recyclage zéro carbone.
14 Jul 2026 17:37
[Automobile : Le premier véhicule d'essai ET de Chunen Auto sort de la chaîne de production]
Récemment, le compte officiel WeChat du Centre de R&D de la technologie automobile de Chunen a annoncé que le premier véhicule d'essai ET de l'entreprise est sorti avec succès de la chaîne de montage du centre de fabrication pilote de l'institut de recherche le 11 juillet. La ligne de production pilote numérique flexible du Centre de R&D de la technologie automobile de Chunen est équipée d'équipements intelligents à haute cadence, tels que des robots de soudage KUKA à sept axes de haute précision et des dispositifs d'assemblage automatisés pour carrosserie en blanc. Elle possède une capacité intégrée de soudage de haute précision multi-modèles en ligne mixte, d'assemblage de véhicules et de tests hors ligne multidimensionnels, couvrant entièrement l'ensemble du processus, de la fabrication de la carrosserie en blanc et de l'assemblage du véhicule à la validation hors ligne sur véhicule réel.
14 Jul 2026 17:36
Le marché chinois des pick-up connaît une forte croissance de ses ventes et exportations en juin 2026
Selon les données de l'Association chinoise des voitures particulières (CPCA), le marché des pick-ups a connu un regain de production et de ventes durant la fin du printemps et le début de l'été, les exportations ayant été particulièrement fortes en juin. En juin 2026, les ventes du marché des pick-ups ont atteint 62 000 unités, en hausse de 29,1 % en glissement annuel et de 2,8 % en glissement mensuel, soit le deuxième niveau le plus élevé pour ce mois au cours des cinq dernières années. Les ventes de janvier à juin ont totalisé 343 000 unités, en hausse de 11,9 % en glissement annuel.
14 Jul 2026 17:15
[Batterie à l'état solide : lignes de production de centaines de tonnes en mise en service intensive au T3, le marché des sulfures accueille un point d'inflexion de volume à « mt-Level » au S2]
[Batterie à électrolyte solide : Mise en service centralisée de lignes de production de cent tonnes au T3, le marché du sulfure franchit un point d'inflexion « à la tonne » pour la montée en volume au S2] 14 juillet 2026. Au premier semestre 2026, la chaîne industrielle des batteries à électrolyte solide au sulfure s'est principalement concentrée sur « la construction de lignes, la mise en service et l'échantillonnage », les volumes d'approvisionnement réels étant minimes — seulement 37 t de sulfure de lithium et 49 t d'électrolytes au sulfure. À l'entame du second semestre, avec plusieurs entreprises qui démarrent la mise en service centralisée de lignes de production de cent tonnes et plus au cours du T3–T4, l'industrie est en passe de passer de « transactions au kilogramme » à « transactions à la tonne », le marché du sulfure connaissant une montée en volume substantielle pour s'aligner sur la période d'intégration des batteries à électrolyte solide dans les véhicules en 2027.
14 Jul 2026 11:26
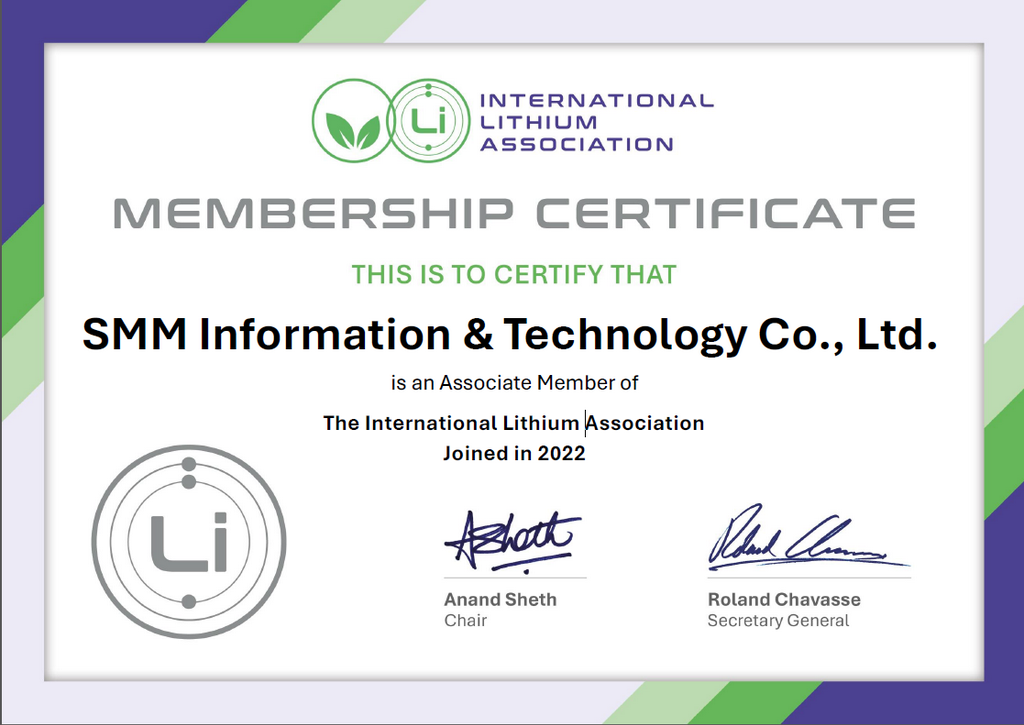
SMM a le plaisir d'annoncer quatre années consécutives d’adhésion à l’ILiA, tout en approfondissant la coopération mondiale sur le lithium.
Shanghai, le 23 juillet – Shanghai Metals Market (SMM) est ravi d'annoncer le maintien de son adhésion à l' pour la quatrième année consécutive depuis son adhésion en novembre 2022, en tant que membre senior de longue date et stable de l'association. Au fil des années, SMM s'est engagé à promouvoir un développement coordonné du secteur mondial du lithium et à approfondir progressivement sa coopération avec l'ILiA. Nous avons continuellement mis en place des plateformes d'échange et de réseautage reliant les acteurs de l'industrie du lithium en Chine et à l'étranger, et organisé de nombreux événements transfrontaliers du secteur. Par ailleurs, nous avons régulièrement co-organisé des webinaires en ligne sur les perspectives du marché mondial du lithium avec l'ILiA, offrant des données de marché sur l'ensemble de la chaîne industrielle, les tendances sectorielles et la recherche industrielle de pointe, favorisant ainsi l'échange de connaissances et un développement de qualité au sein de l'industrie du lithium, tant au niveau national qu'international. Fort de quatre années de coopération solide et d'une confiance mutuelle croissante dans le secteur, les deux parties ont récemment conclu un nouveau modèle de coopération amélioré, marquant un approfondissement global de leur partenariat : Martin Ma, responsable ILiA Chine, a prononcé un discours individuel à la SMM New Energy Industry Chain Expo (CLNB) 2026 Li-ION BATTERY Africa 2026 a établi un partenariat avec l'ILiA. Tom Drabble, responsable mondial du développement durable chez ILiA, a participé à une table ronde sur le thème « Assurer un approvisionnement stable en lithium, cobalt, graphite et phosphate – Rôle et défis de l'Afrique ». Astrid Karamira, directrice représentante EMEA chez ILiA, a prononcé un discours sur le thème « Tendances des matériaux - Décoder l'offre et la demande mondiales de métaux critiques » à la conférence SMM Li-ion Battery Europe 2024. Astrid Karamira a participé à une table ronde lors de la conférence SMM Li-ion Battery Europe 2025 sur le thème « Construire un écosystème européen des matières premières pour batteries, stimulé par les politiques – Défis et opportunités de la chaîne d'approvisionnement » Astrid Karamira est intervenue à la conférence SMM Li-ion Battery Americas 2024 Logan Lu, PDG de SMM, a déclaré que le renforcement de la coopération entre les deux parties est un choix inévitable en phase avec la mondialisation et le développement bas carbone de l'industrie du lithium. S'appuyant sur les capacités complètes de service de données de la chaîne industrielle de SMM, combinées aux avantages de plateforme de l'ILiA couvrant les leaders de l'industrie en amont et en aval à l'échelle mondiale, les deux parties mèneront à l'avenir une collaboration plus approfondie en matière de veille de marché, de développement ESG, de mise en relation industrielle transfrontalière et d'économie circulaire des batteries, favorisant la complémentarité des atouts et les bénéfices mutuels des ressources de la chaîne mondiale de l'industrie du lithium, et construisant ensemble un écosystème mondial de l'industrie du lithium vert, stable et synergique. À propos de l'International Lithium Association (ILiA) L'International Lithium Association (ILiA) a été fondée en 2021. C'est une association professionnelle internationale à but non lucratif pour l'industrie du lithium, qui défend les trois visions et missions suivantes : « donner une voix à l'industrie du lithium, renforcer l'ESG et le développement durable dans l'industrie du lithium, et devenir un organe faisant autorité pour l'industrie du lithium ». Outre 7 membres principaux, l'association compte également plus de 30 membres associés issus de la chaîne de valeur de l'industrie du lithium, impliqués dans des domaines d'activité tels que les projets d'extraction de lithium, les matériaux pour batteries, la fabrication de batteries ou l'ingénierie. Ses membres associés comprennent SMM, Albemarle Corporation, Chengxin Lithium, Tianqi Lithium, Rio Tinto, etc.
23 Jul 2026 09:08
SMM AICE visite la base vietnamienne de Xingfa Aluminum pour promouvoir le développement d’un système de tarification de l’aluminium au Vietnam
23 Jul 2026 10:32
![[Analyse SMM] Production d'acide sulfurique en Chine et importations & exportations de soufre/acide sulfurique au premier semestre 2026](https://imgqn.smm.cn/usercenter/OpmKJ20251217171712.jpg)
[Analyse SMM] Production d'acide sulfurique en Chine et importations & exportations de soufre/acide sulfurique au premier semestre 2026
23 Jul 2026 18:47
![[Analyse SMM] Les tensions États-Unis-Iran poussent le pétrole à 90 $, les craintes d’inflation et les anticipations de hausse des taux pèsent sur les métaux précieux](https://imgqn.smm.cn/usercenter/QnbfL20251217171735.jpeg)
[Analyse SMM] Les tensions États-Unis-Iran poussent le pétrole à 90 $, les craintes d’inflation et les anticipations de hausse des taux pèsent sur les métaux précieux
23 Jul 2026 16:57
John Paulson déclare que nous sommes aux premiers stades d'un marché haussier de long terme pour l'or.
23 Jul 2026 16:17
Décret exécutif de Trump resserre les règles sur les terres rares, mais l'écart d'approvisionnement en aimants aux États-Unis persiste jusqu'en 2027【Analyse SMM】
23 Jul 2026 12:27
![Une violente tempête de neige frappe la province argentine de Catamarca, menaçant la production et les expéditions de lithium [Analyse SMM]](https://imgqn.smm.cn/usercenter/mzgdV20251217171729.png)
Une violente tempête de neige frappe la province argentine de Catamarca, menaçant la production et les expéditions de lithium [Analyse SMM]
24 Jul 2026 11:45
Dernières actualités
SMM Daily : Le prix spot du carbonate de lithium se consolide à la hausse le 27 juillet.
il y a 16 heures
Revue quotidienne SMM : Le prix au comptant du carbonate de lithium baisse légèrement le 24 juillet
24 Jul 2026 18:17
[Batterie à l'état solide : Huashang Zhongke réussit son essai pilote de sulfure de lithium de haute pureté à 99,95 %, plusieurs entreprises du Shandong se positionnent sur le sulfure de lithium]
24 Jul 2026 10:01
Zhu Xiao, directeur R&D de Liaoning Xiangyu Aluminum, a participé à l’ASCC pour discuter de l’orientation de l’itération des performances de l’alliage d’aluminium de la série 6000 dans le domaine automobile.
23 Jul 2026 17:38
Hyundai Motor annonce ses résultats de ventes du deuxième trimestre
23 Jul 2026 17:22
Les ventes intérieures et les exportations de véhicules à énergie nouvelle de la Corée rebondissent en juin, tirées par les hybrides électriques.
22 Jul 2026 16:37
[Conférence automobile] Xiongchuang Aluminum Alloy vous invite à assister à la Conférence SMM ASCC2026 (8e) sur la chaîne d'approvisionnement automobile
22 Jul 2026 11:36
[Auto Club] Alumi Technology vous invite à participer à la conférence SMM ASCC2026 (8e) sur la chaîne d'approvisionnement automobile.
21 Jul 2026 17:14
Centre sino-kazakh de PV pérovskite et de stockage d'énergie tout-solide dévoilé à Ordos
21 Jul 2026 16:46
[Batterie à semi-conducteurs : ECOPRO BM de Corée du Sud dévoile sa feuille de route de développement de matériaux de base pour les batteries tout-solide]
21 Jul 2026 13:56
Les ventes chinoises de batteries d'énergie et de stockage d'énergie s'envolent en juin 2026, en hausse de 49,1 % sur un an.
17 Jul 2026 16:25
Les exportations automobiles chinoises devraient dépasser les 10 millions d'unités cette année.
17 Jul 2026 10:35
[Conférence Automobile] Lixin New Materials vous invite à la conférence SMM ASCC2026 (8e édition) sur la chaîne d'approvisionnement automobile.
17 Jul 2026 10:25
Données de production et de ventes automobiles du premier semestre publiées, les exportations dépassent les attentes : où en sont les objectifs annuels des constructeurs ? [Spécial SMM]
16 Jul 2026 17:52
Hoshine Silicon prévoit de passer d'une perte à un bénéfice au premier semestre en glissement annuel.
16 Jul 2026 09:23
Ganfeng Lithium s'attend à un retour à la rentabilité en glissement annuel au premier semestre.
16 Jul 2026 09:22
[Automobile : CATL et le groupe de transport public de Luzhou signent une coopération stratégique]
14 Jul 2026 17:37
[Automobile : Le premier véhicule d'essai ET de Chunen Auto sort de la chaîne de production]
14 Jul 2026 17:36
Le marché chinois des pick-up connaît une forte croissance de ses ventes et exportations en juin 2026
14 Jul 2026 17:15
[Batterie à l'état solide : lignes de production de centaines de tonnes en mise en service intensive au T3, le marché des sulfures accueille un point d'inflexion de volume à « mt-Level » au S2]
14 Jul 2026 11:26