

Tin tức
Bài phân tích độc quyền với các cập nhật thị trường mới nhất và bản tin cập nhật theo thời gian thực.
![[SMM Analysis] Đánh giá thép không gỉ ngoài Trung Quốc quý 3: Phụ phí châu Âu giảm 158 EUR/tấn, nhưng giá CIF tăng 2,8%](https://imgqn.smm.cn/usercenter/VstiG20251217171732.jpeg)
[SMM Analysis] Đánh giá thép không gỉ ngoài Trung Quốc quý 3: Phụ phí châu Âu giảm 158 EUR/tấn, nhưng giá CIF tăng 2,8%
Đánh giá quý 3 năm 2026: Chi phí và giá thép không gỉ ngoài Trung Quốc diễn biến trái chiều. NPI Indonesia giảm 8,2%, nhưng SMM ước tính chi phí HRC 304 chỉ giảm 1,7%, với biên lợi nhuận dao động từ 4,7% đến 9,0% theo biến động giá của chính các nhà máy. Phụ phí thép 304 châu Âu giảm 158 EUR/tấn trong khi giá CIF tăng 2,8%. Phế liệu Malaysia tăng 10,4%, CRC nội địa tăng 0,3%. Giá niêm yết Đài Loan (PoC) tăng hai lần trong khi giá giao ngay trượt dốc. Chỉ có Ấn Độ chứng kiến chi phí và giá biến động cùng chiều, khi châu Á mở ba vụ điều tra chống bán phá giá mới.
08 Oct 2026 15:36 (GMT+8)
Vàng: Morgan Stanley cho rằng tiềm năng tăng giá vượt xa rủi ro giảm – 4.000 USD là ngưỡng hỗ trợ
Ngày 2 tháng 10 năm 2026 hiện đang trong giai đoạn tích lũy—nhưng đối với các nhà đầu tư hàng hóa có tầm nhìn xa, chính môi trường này lại mở ra cơ hội chiến lược. Trong khi lợi suất trái phiếu cao và đồng đô la Mỹ mạnh đang phần nào hạ nhiệt thị trường trong ngắn hạn, Morgan Stanley đã nhìn vào bức tranh toàn cảnh: Nền tảng nhu cầu cơ bản vẫn còn nguyên vẹn. Do đó, các nhà phân tích tại ngân hàng đầu tư Mỹ này duy trì mục tiêu rõ ràng: Đến nửa cuối năm 2027, giá vàng sẽ một lần nữa phá vỡ ngưỡng kỳ diệu 5.000 đô la mỗi ounce. Phân tích của Morgan Stanley: Vì sao mục tiêu 5.000 đô la đang trở nên rõ ràng Amy Gower, Trưởng bộ phận Chiến lược Kim loại và Khai khoáng tại Morgan Stanley, nhận định thị trường được bảo vệ đặc biệt tốt ở phía giảm giá bất chấp những cơn gió ngược vĩ mô hiện tại—như giá dầu cao và lợi suất trái phiếu dài hạn chạm mức cao nhất 20 năm. Ngưỡng trên 4.000 đô la tạo nên một đường hỗ trợ vững chắc. Bà giải thích, lý do kim loại quý không phản ứng mạnh hơn với lãi suất tăng nằm ở một nền tảng người mua vững chắc bất thường đang ổn định mức giá hiện tại. Sức mạnh cấu trúc này của thị trường dựa trên ba trụ cột chính: Nhu cầu vàng từ châu Á: Nhu cầu vật chất từ Trung Quốc đang ở mức cực kỳ cao. Lượng vàng nhập khẩu của nước này đang trên đà đạt mức cao nhất kể từ năm 2017—nếu không phải là kỷ lục dài hạn. Sau khoảng lắng ngắn trong “Tuần lễ Vàng,” sức mua này có khả năng sẽ nhanh chóng quay trở lại thị trường. Các ngân hàng trung ương như những vận động viên chạy đường dài: Ngoài Trung Quốc, các ngân hàng trung ương khác—chẳng hạn như Ba Lan—cũng đang đóng vai trò là những người mua lớn nhằm phòng ngừa rủi ro tiền tệ và những lo ngại về tính bền vững dài hạn của núi nợ toàn cầu. Dòng vốn ETF ổn định: Trái ngược với mô hình kinh điển thường thấy trong các giai đoạn chính sách tiền tệ thắt chặt, các quỹ vàng giao dịch trên sàn tiếp tục mở rộng lượng nắm giữ—một dấu hiệu đáng chú ý về sức mạnh của các tổ chức, theo Morgan Stanley. Các đợt bán tháo ngắn hạn, như những gì quan sát được gần đây, hiện chủ yếu được cho là do việc tái cân bằng danh mục của các quỹ giao dịch thuật toán. Bạc đi theo xu hướng cơ bản của vàng Xu hướng nền tảng mạnh mẽ này cũng đang lan sang thị trường bạc. Theo các chuyên gia tại Morgan Stanley, bạc hiện có mối tương quan mạnh hơn nhiều với “người anh lớn” vàng so với các kim loại công nghiệp như đồng. Mặc dù nhu cầu công nghiệp—đặc biệt từ ngành năng lượng mặt trời sau đợt tăng giá cực đoan năm ngoái—đã hạ nhiệt đôi chút do các biện pháp cắt giảm chi phí nguyên vật liệu, tiềm năng kinh tế vĩ mô tổng thể của kim loại quý vẫn ở mức cao. Cuối cùng, tính bền vững tài khóa của các nền kinh tế lớn và khả năng bảo vệ dài hạn trước lạm phát vẫn là những chất xúc tác lâu dài cho tài sản hữu hình. Nếu trong tương lai có các biện pháp can thiệp vào thị trường trái phiếu dài hạn khiến lợi suất giảm trở lại, hoặc giá dầu giảm, áp lực hiện tại lên vàng và bạc sẽ ngay lập tức biến mất. Do đó, đối với Morgan Stanley, con đường phía trước rất rõ ràng: Trong khoảng thời gian 12 tháng, tiềm năng tăng giá là rất lớn, với mục tiêu tạm thời được công bố là 5.000 USD vào năm tới. Nguồn:
09 Oct 2026 13:46 (GMT+8)
[SMM Phân tích] Tăng trưởng nhu cầu thép của Ấn Độ có thể bù đắp sự chậm lại của Trung Quốc?
Ấn Độ gần như có thể bù đắp mức sụt giảm nhu cầu dự báo của Trung Quốc vào năm 2026. Liệu điều đó có hỗ trợ giá thép quốc tế hay không phụ thuộc vào việc Ấn Độ mua gì, các nhà máy của nước này mở rộng nhanh đến đâu và liệu sự thu hẹp của Trung Quốc có được kiểm soát hay không. Sự trỗi dậy của Ấn Độ như một nguồn tăng trưởng nhu cầu thép lớn đặt ra một câu hỏi có hệ lụy vượt xa hai quốc gia: liệu thị trường đang mở rộng của nước này có thể bù đắp cho nhu cầu đang thu hẹp của Trung Quốc hay không? Câu trả lời phụ thuộc vào ý nghĩa của từ “bù đắp”. Thay thế lượng tiêu thụ đã mất trong tổng cầu toàn cầu là một phép thử. Tạo ra một thị trường tương đương cho thép giao dịch quốc tế là một phép thử khác. Tái tạo quy mô và tầm ảnh hưởng của chu kỳ phát triển thâm dụng thép của Trung Quốc là một bài toán lớn hơn nhiều. Tăng trưởng nhu cầu thép của Ấn Độ gần như bù đắp sự sụt giảm của Trung Quốc Ở phép thử hẹp nhất, các con số gần như trùng khớp một cách đáng kinh ngạc. Triển vọng tháng 4 của Worldsteel đưa ra nhu cầu thép thành phẩm của Ấn Độ ở mức 171,6 triệu tấn vào năm 2026, tăng từ 159,8 triệu tấn năm 2025. Trung Quốc giảm từ 796,0 triệu tấn xuống 784,1 triệu tấn. Do đó, Ấn Độ tăng thêm 11,8 triệu tấn so với mức giảm 11,9 triệu tấn của Trung Quốc: mức thay đổi tổng hợp khoảng âm 0,1 triệu tấn, tính từ các mức công bố đã làm tròn. Hình 1. Tăng trưởng phần trăm mạnh ở một thị trường nhỏ hơn có thể bù đắp mức suy giảm khiêm tốn ở một thị trường lớn hơn nhiều. So sánh này liên quan đến nhu cầu thép thành phẩm, không phải sản lượng thép thô. Đó là một đóng góp có ý nghĩa cho sự ổn định của thị trường. Nhưng đó cũng là một sự cân bằng mong manh. Trung Quốc vẫn lớn gấp khoảng 4,6 lần Ấn Độ trong dự báo năm 2026. Do đó, một thay đổi nhỏ trong quỹ đạo của Trung Quốc có thể hấp thụ một phần đáng kể mức tăng của Ấn Độ. Cách diễn giải hợp lý là Ấn Độ tạo ra một đối trọng đáng kể trước sự suy giảm có kiểm soát của Trung Quốc. Điều đó chưa khiến thị trường toàn cầu trở nên không nhạy cảm với Trung Quốc. Sự khác biệt này quan trọng đối với cách câu chuyện được trình bày. So sánh mức tăng trưởng dự báo 7,4% của Ấn Độ với mức giảm 1,5% của Trung Quốc khiến sự bù đắp trông có vẻ áp đảo. So sánh theo tấn cho thấy gần như toàn bộ mức tăng của Ấn Độ là cần thiết chỉ để trung hòa mức tổn thất của Trung Quốc. Một điểm phần trăm tăng trưởng có ý nghĩa vật lý rất khác nhau ở hai thị trường. Bảng dưới đây duy trì so sánh hằng năm trên cùng một cơ sở thống kê nhất quán. Bảng cũng tách riêng đóng góp của phần còn lại của thế giới, được tính như phần dư, khỏi cặp Trung Quốc–Ấn Độ. Hình 2. Nhu cầu thép thành phẩm theo năm dương lịch; 2026 và 2027 là dự báo tháng 4 năm 2026. Các thay đổi sử dụng mức công bố đã làm tròn. Phần còn lại của thế giới được tính toán thay vì là chuỗi khu vực được trích dẫn riêng. Ngành Bất động sản Trung Quốc vẫn chịu áp lực, gây nghi ngờ về khả năng ổn định nhu cầu Đối với năm 2027, dự báo tương tự trở nên lạc quan hơn vì Trung Quốc ngừng suy giảm trong khi Ấn Độ tiếp tục tăng trưởng. Nhưng đó là một giả định cần kiểm chứng bằng bằng chứng thực tế, chứ không phải là kết quả đã được đảm bảo. Triển vọng được công bố ngày 14 tháng 4 và phản ánh thông tin có đến giữa tháng 3. Worldsteel đã gắn kết rõ ràng quan điểm ổn định của Trung Quốc với việc điều chỉnh bất động sản phần lớn đã đi đến hồi kết; tổ chức này cũng nhấn mạnh sự không chắc chắn về mức độ nghiêm trọng được báo cáo của sự suy giảm nhu cầu năm 2025 của Trung Quốc. Các chỉ số bất động sản sau đó cho thấy cần thận trọng. Cục Thống kê Quốc gia Trung Quốc báo cáo rằng số công trình khởi công mới giảm 24,8% so với cùng kỳ năm trước trong tháng 1–8 năm 2026, trong khi đầu tư phát triển bất động sản giảm 19,9%. Đây là các thước đo bất động sản, không phải ước tính tổng tiêu thụ thép, và không thể thay thế trực tiếp vào dự báo nhu cầu thép. Tuy nhiên, chúng cho thấy một hoạt động tiêu thụ thép quan trọng vẫn chịu áp lực sau khi triển vọng tháng 4 được chuẩn bị. Dữ liệu bất động sản tháng 1–8 của Cục Thống kê Quốc gia Trung Quốc Cơ chế truyền dẫn liên quan nằm ở chuỗi công trình xây dựng. Các dự án mới tạo ra nhu cầu về vật liệu kết cấu; các dự án đang triển khai có thể tiếp tục tiêu thụ thép ngay cả khi số công trình khởi công suy yếu. Những thay đổi về tiến độ dự án, thiết kế công trình và cường độ sử dụng vật liệu khiến không thể chuyển đổi cố định từ diện tích sàn sang khối lượng thép. Sản xuất và cơ sở hạ tầng cũng ảnh hưởng đến tổng nhu cầu. Do đó, số công trình khởi công yếu là lý do để rà soát lại mức cơ sở của nhu cầu, chứ không phải là bằng chứng cho thấy tiêu thụ thép chắc chắn giảm với cùng tốc độ. Cơ sở hạ tầng và sản xuất thúc đẩy tăng trưởng nhu cầu thép của Ấn Độ Tăng trưởng của Ấn Độ có nhiều động lực được báo cáo hơn. Worldsteel xác định xây dựng dẫn dắt bởi cơ sở hạ tầng, hoạt động ô tô, hàng hóa tư liệu sản xuất, phát triển đường sắt và hàng tiêu dùng lâu bền là các yếu tố hỗ trợ. Đánh giá của Worldsteel về Ấn Độ. Đối với các bên tham gia thị trường, câu hỏi tiếp theo là các mục đích sử dụng cuối cùng này chuyển thành đơn đặt hàng cho các sản phẩm cụ thể như thế nào. Thép cốt bê tông cho một dự án xây dựng, thép tấm ô tô đạt chuẩn và thép điện cho thiết bị là những thị trường thương mại khác nhau, ngay cả khi tất cả đều đóng góp vào cùng một tổng nhu cầu quốc gia. Có bằng chứng đáng khích lệ trong số liệu tiêu thụ gần đây hơn của Ấn Độ. Bản công bố ngày 6 tháng 10 của Bộ Thép cho thấy tiêu thụ thép thành phẩm tăng từ 79,0 triệu tấn lên 84,9 triệu tấn trong giai đoạn tháng 4–tháng 9 năm 2026, mức tăng được báo cáo là 7,5%. Các quan sát tạm thời cho nửa năm tài chính này bao phủ một giai đoạn khác với dự báo theo năm dương lịch của Worldsteel. Chúng ủng hộ bức tranh tăng trưởng tiếp diễn mà chưa xác lập kết quả cuối cùng của năm 2026. Bộ Thép / PIB, cập nhật nửa đầu năm Tiêu thụ tăng không đảm bảo nhập khẩu cao hơn khi thương mại thép của Ấn Độ phân kỳ Tuy nhiên, đối với các nhà máy nước ngoài, tăng trưởng tiêu thụ chỉ là khởi đầu của đánh giá. Nhu cầu bổ sung của Ấn Độ có thể được đáp ứng bằng sản xuất trong nước, giảm xuất khẩu, nhập khẩu hoặc thay đổi tồn kho. Điều đó không nhất thiết trở thành mức tăng tương ứng trong lượng mua từ nước ngoài. Một thị trường nội địa mạnh có thể cải thiện cơ hội bán hàng cho các nhà sản xuất Ấn Độ trong khi có tác động nhỏ hơn nhiều đến cán cân thép quốc tế ròng. Hình 3. Cả hai dòng thương mại đều mở rộng trong giai đoạn tháng 4–tháng 9 năm 2026. Chênh lệch giữa chúng thay đổi ít hơn nhiều so với tiêu thụ. Đây là so sánh các chỉ số, không phải là đối chiếu cung–sử dụng đầy đủ. Phép tính thương mại minh họa sự khác biệt này. Nhập khẩu tháng 4–tháng 9 tăng từ 3,3448 triệu tấn lên 4,1418 triệu tấn, trong khi xuất khẩu tăng từ 2,8102 triệu tấn lên 3,5478 triệu tấn. Do đó, nhập khẩu ròng nới rộng từ 0,5346 triệu tấn lên 0,5940 triệu tấn—mức tăng chỉ 59.400 tấn. Điều này không có nghĩa là các nhà cung cấp nước ngoài không tìm thấy cơ hội: nhập khẩu gộp rõ ràng đã tăng. Điều đó có nghĩa là Ấn Độ đồng thời bán nhiều thép hơn ra nước ngoài. Một nhà xuất khẩu đánh giá khả năng bán hàng vào Ấn Độ nên xem xét nhập khẩu gộp theo sản phẩm và khách hàng. Một nhà phân tích đánh giá liệu Ấn Độ có đang hấp thụ thặng dư toàn cầu hay không cũng nên xem xét xuất khẩu. Hai câu hỏi đó không thể trả lời chỉ bằng tốc độ tăng trưởng tiêu thụ. Cũng không nên ép các số liệu thống kê tổng hợp vào một phép tính tồn kho. Sản xuất, thương mại và tiêu thụ cần có định nghĩa và điều chỉnh tương thích trước khi tạo thành một cân đối vật chất hoàn chỉnh. Các số liệu trình bày ở đây không xác định được lượng thép đã rút khỏi hay bổ sung vào kho dự trữ. Quy toàn bộ phần chênh lệch cho tồn kho sẽ tạo ra độ chính xác mà bằng chứng hiện có không hỗ trợ. Chi tiết sản phẩm làm cho bức tranh thương mại rõ ràng hơn. Một thông cáo trước đó của Bộ cung cấp số liệu xuất nhập khẩu có thể so sánh cho một số chủng loại trong giai đoạn tháng 4–tháng 7 năm 2026. Thép cuộn cán nóng và thép dải ghi nhận nhập khẩu ròng 173.700 tấn, trong khi thép thanh và thép cuộn tròn ghi nhận xuất khẩu ròng 95.100 tấn. Bảng dưới đây sử dụng giai đoạn ngắn hơn đó một cách rõ ràng; đây không phải là phân tách của tổng số tháng 4–tháng 9. Hình 4. Một số chủng loại có báo cáo cả hai luồng. Bảng không bao gồm tất cả sản phẩm, và các chủng loại rộng che giấu sự khác biệt về mác thép, kích thước và sự chấp thuận của khách hàng. Các luồng đồng thời này hợp lý về mặt thương mại. Một quốc gia có thể xuất khẩu một quy cách và nhập khẩu một quy cách khác trong cùng một chủng loại. Kinh tế vận tải, thời hạn giao hàng, năng lực nhà máy và yêu cầu chứng nhận cũng có thể tách người mua thành các thị trường riêng biệt. Do đó, vị thế ròng quốc gia là bối cảnh hữu ích, nhưng là chỉ dẫn không đầy đủ cho triển vọng của một nhà máy cụ thể. Cơ hội liên quan là mác thép mà người mua cần ở mức giá giao hàng và ngày giao hàng khả thi. Mở rộng năng lực trong nước có thể định hình lại nhu cầu nhập khẩu thép của Ấn Độ Nguồn cung trong nước cũng đang phản ứng với cơ hội này. Trong báo cáo thường niên năm tài chính 2025–26, JSW mô tả cơ sở năng lực thép thô hợp nhất là 33,4 triệu tấn mỗi năm và mục tiêu 50,3 triệu tấn vào năm tài chính 2029–30, với năng lực liên doanh được thảo luận riêng. Công ty cũng mô tả đầu tư vào công nghệ và sản xuất thép điện. Đây là năng lực và kế hoạch do công ty báo cáo, không phải sản lượng thép thành phẩm bổ sung được đảm bảo. Hàm ý là tăng trưởng nhu cầu của Ấn Độ và tăng trưởng nguồn cung của Ấn Độ phải được đánh giá cùng nhau. Năng lực mới có thể phục vụ khách hàng trong nước, thay thế nhập khẩu hoặc cuối cùng hỗ trợ xuất khẩu. Kết quả phụ thuộc vào việc vận hành thử, tăng tốc sản xuất, năng lực sản phẩm và chi phí. Công suất thép thô đã công bố không nên được trừ trực tiếp vào dự báo nhu cầu thép thành phẩm: các thước đo khác nhau, và công suất danh nghĩa không giống với sản lượng có thể bán được. Nhu cầu của Trung Quốc vẫn là biến số then chốt: Liệu Ấn Độ có thể hỗ trợ giá thép toàn cầu? Điều này khiến quỹ đạo của Trung Quốc trở thành biến số quan trọng. Một phép thử độ nhạy đơn giản giữ mức tăng dự báo của Ấn Độ ở mức 11,8 triệu tấn và chỉ thay đổi mức suy giảm giả định của nhu cầu Trung Quốc so với mức cơ sở năm 2025. Đây là một kịch bản cơ học, không thay thế cho dự báo của worldsteel. Hình 5. Thay đổi kết hợp = 11,8 − (796,0 × mức suy giảm giả định của Trung Quốc). Đầu vào phần trăm được biểu thị dưới dạng phân số trong phép tính. Các thị trường khác bị loại trừ. Mức suy giảm hòa vốn của Trung Quốc xấp xỉ 1,48%. Ở mức suy giảm 3%, Trung Quốc sẽ mất khoảng 23,9 triệu tấn, khiến tổng cộng của hai nước thấp hơn khoảng 12,1 triệu tấn bất chấp mức tăng của Ấn Độ. Ngược lại, một thị trường Trung Quốc ổn định sẽ cho phép mức tăng của Ấn Độ đóng góp đầy đủ vào tăng trưởng kết hợp. Sự bất đối xứng này là lý do chính khiến các chỉ số bất động sản và sản xuất tại Trung Quốc vẫn quan trọng ngay cả khi vai trò của Ấn Độ mở rộng. Đối với các nhà sản xuất và thương nhân, ba phép thử thực tế sau đây được áp dụng. Thứ nhất, theo dõi xem tăng trưởng của Ấn Độ có duy trì trong lượng giao hàng thực tế đến người dùng cuối hay không thay vì chỉ dựa vào các câu chuyện kinh tế vĩ mô rộng lớn. Thứ hai, theo dõi các bổ sung nguồn cung theo tiến độ vận hành thực tế và mức độ sẵn sàng của sản phẩm. Thứ ba, so sánh dòng chảy nhập khẩu và xuất khẩu đối với loại thép liên quan, cùng với cước vận tải, điều khoản giao hàng và các yêu cầu tiếp cận thị trường hiện hành. Một xu hướng nhu cầu quốc gia thuận lợi không thể thay thế cho công việc thương mại đó. Bằng chứng ủng hộ một câu trả lời có điều kiện cho câu hỏi ban đầu. Ấn Độ gần như có thể bù đắp phần mất mát nhu cầu của Trung Quốc được đưa vào dự báo tháng 4 năm 2026, và các quan sát sau đó về Ấn Độ xác nhận tăng trưởng tiêu thụ tiếp tục. Nhưng sự bù đắp này nhạy cảm với một đợt suy giảm sâu hơn của Trung Quốc, và nó không tự động chuyển thành một đầu ra lớn tương đương cho thép nước ngoài. Thị trường đang mở rộng của Ấn Độ xứng đáng có trọng số ngày càng tăng trong phân tích toàn cầu. Khả năng hỗ trợ giá quốc tế của nước này sẽ được quyết định đồng thời bởi nhu cầu, nguồn cung nội địa và các sản phẩm thực sự qua biên giới của nước này.
09 Oct 2026 10:38 (GMT+8)
Tin mới nhất
![[SMM Đánh giá HRC toàn cầu hàng tuần] Phí bảo hiểm nhập khẩu EU giảm khi hạn ngạch cạn kiệt; Đông Nam Á yếu trái ngược với sự hỗ trợ của châu Âu](https://imgqn.smm.cn/usercenter/exdqc20251217171717.jpg)
[SMM Đánh giá HRC toàn cầu hàng tuần] Phí bảo hiểm nhập khẩu EU giảm khi hạn ngạch cạn kiệt; Đông Nam Á yếu trái ngược với sự hỗ trợ của châu Âu
1 giờ trước
![[SMM Analysis] Thiếu động lực tăng/giảm; Giá thép silic GO dự kiến duy trì yếu và ổn định trong tháng 10](https://imgqn.smm.cn/usercenter/mpffV20251217171715.jpg)
[SMM Analysis] Thiếu động lực tăng/giảm; Giá thép silic GO dự kiến duy trì yếu và ổn định trong tháng 10
16 Oct 2026 17:28 (GMT+8)
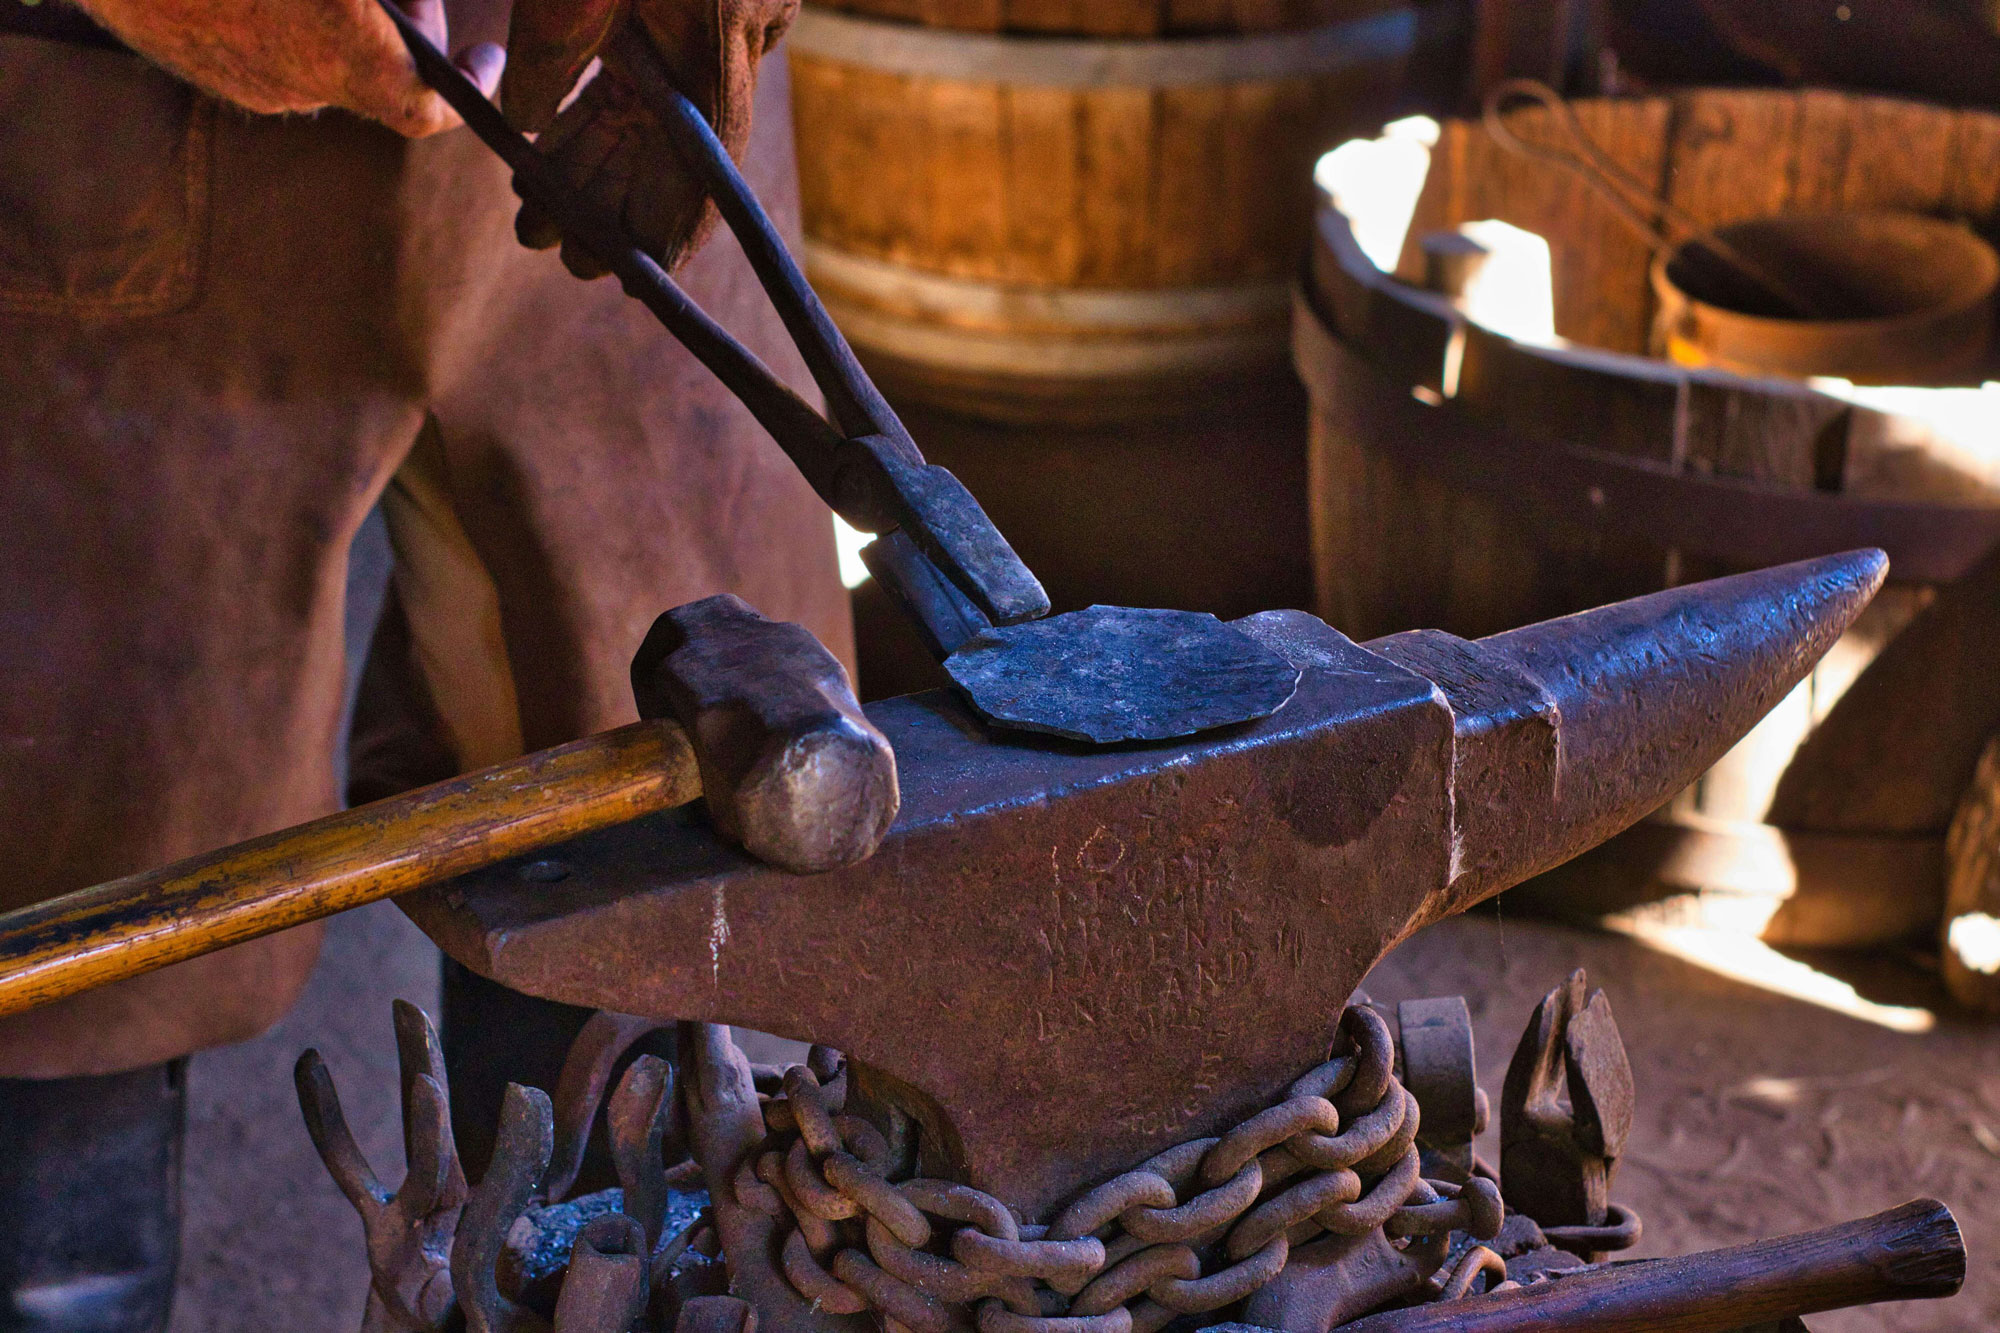
Gerdau Corsa mở rộng công suất tái chế phế liệu tại Mexico để thúc đẩy sản xuất thép bền vững
16 Oct 2026 17:23 (GMT+8)
Xuất khẩu thép phủ màu của Đài Loan đạt gần 20.000 tấn trong tháng 9
Xuất khẩu thép phủ màu của Đài Loan đạt gần 20.000 tấn trong tháng 9, theo Yieh Corp. trong báo cáo ngày 16/10/2026. Dù không công bố so sánh theo tháng và theo năm, khối lượng gần 20.000 tấn/tháng cho thấy nhu cầu nước ngoài tiếp tục duy trì trong bối cảnh dòng chảy thương mại thép châu Á dịch chuyển, khi xuất khẩu thép thành phẩm của Trung Quốc đạt mức cao nhất năm 2026 vào tháng 9. Các tín hiệu khu vực cũng cho thấy giá sản phẩm dẹt vững hơn: Chung Hung Steel tăng giá bán trong nước và xuất khẩu cho tháng 11 và tháng 12, trong khi Nucor tăng giá thép cuộn cán nóng do nguồn cung tại Mỹ thắt chặt. Những động thái này có thể ảnh hưởng đến báo giá xuất khẩu thép phủ màu của Đài Loan và lượng đơn hàng trong những tháng tới.
16 Oct 2026 17:23 (GMT+8)
SSAB khởi công xây dựng dây chuyền tôi Oxelösund, bổ sung 100.000 tấn công suất thép chịu mài mòn cao cấp
SSAB đã bắt đầu xây dựng dây chuyền tôi mới tại Oxelösund, Thụy Điển, đầu tư khoảng 310 triệu USD (3,3 tỷ SEK) để bổ sung khoảng 100.000 tấn/năm công suất thép chống mài mòn và thép bảo vệ tiên tiến, chủ yếu là các mác Hardox và Armox, mục tiêu sản lượng vào năm 2030. Dự án này củng cố xu hướng của SSAB hướng tới thép đặc biệt giá trị cao phục vụ công nghiệp, an toàn và quốc phòng, chuyển dịch cơ cấu khỏi các sản phẩm đại trà. Trong ngắn hạn, dự án ít tác động đến nhu cầu, giá cả hay kết quả quý 3/2026; thép xây dựng và ô tô châu Âu vẫn là các yếu tố biến động chính. Rủi ro chính: nhu cầu yếu và áp lực nhập khẩu siết chặt biên lợi nhuận trong khi SSAB gánh vốn đầu tư chuyển đổi lớn. Kết quả quý 3/2026 dự kiến công bố ngày 28 tháng 10.
16 Oct 2026 17:23 (GMT+8)
Giá vật liệu xây dựng Mỹ tăng trong tháng 9; thép thanh cán nóng, thép tấm và thép hình kết cấu tăng 3,0% so với tháng trước
Cục Thống kê Lao động Mỹ (BLS) cho biết giá vật liệu xây dựng đã điều chỉnh theo mùa tăng 0,5% so với tháng trước trong tháng 9, với chỉ số cầu trung gian đối với linh kiện và vật liệu xây dựng tăng 5,7% so với cùng kỳ năm ngoái. Hàng hóa đã qua chế biến cho cầu trung gian tăng 2,5% so với tháng trước sau mức 1,8% và cao hơn 14,1% so với cùng kỳ năm ngoái; CPI-U đã điều chỉnh theo mùa tăng 0,6% so với tháng trước và 3,7% so với cùng kỳ năm ngoái. Thép thanh cán nóng, thép tấm và thép hình tăng 3,0% so với tháng trước và 17,3% so với cùng kỳ năm ngoái, cao hơn 71,2% so với mức trung bình trước COVID (tháng 12/2019-tháng 2/2020), tăng 8,0% trong bốn tháng. Dây và cáp đồng tăng 0,8% so với tháng trước và 34,2% so với cùng kỳ năm ngoái, mức tăng hàng năm lớn nhất được ghi nhận, và cao hơn 104,8% so với trước COVID. Dây và cáp điện tăng 2,2% so với tháng trước; gỗ xẻ mềm giảm 2,0% so với tháng trước nhưng tăng 14,2% so với cùng kỳ năm ngoái; ván ép mềm tăng 2,3% so với tháng trước và 20,4% so với cùng kỳ năm ngoái.
16 Oct 2026 17:22 (GMT+8)
British Steel kêu gọi tăng cường vai trò của các nhà sản xuất trong nước trong các dự án xây dựng tại Anh
British Steel tuần này đã tham dự một sự kiện do BCSA tổ chức tại Tòa nhà Quốc hội, cùng với các nhà thầu, khách hàng và các nghị sĩ bao gồm Blair McDougall, Bộ trưởng Tái công nghiệp hóa, nhằm kêu gọi vai trò lớn hơn cho các nhà sản xuất Anh trong các dự án xây dựng và cơ sở hạ tầng. Giám đốc Thương mại Lisa Coulson cho biết thép có tầm quan trọng chiến lược đối với cơ sở hạ tầng, nền kinh tế và khả năng phục hồi quốc gia của Anh, đồng thời dự kiến nhu cầu thép sẽ tăng trong 20 năm tới, mức tăng trưởng này cần được đáp ứng bởi các nhà máy, nhà thầu và đơn vị gia công thép của Anh. Bà nhấn mạnh sự hợp tác trong toàn chuỗi giá trị để xây dựng một ngành có tính cạnh tranh, phát thải carbon thấp và có khả năng phục hồi, và Giám đốc Thương mại Xây dựng Phil Knowles tái khẳng định sự ủng hộ đối với các nhà máy và đơn vị gia công thép của Anh.
16 Oct 2026 17:22 (GMT+8)
[SMM Analysis]Các nhà máy tăng giá khi nhu cầu yếu; thép silicon không định hướng có thể tăng rồi ổn định trong tháng 10
16 Oct 2026 17:18 (GMT+8)
[Bản tin quặng sắt nội địa] Giá tinh quặng sắt tại tây Liêu Ninh có thể đi ngang ở mức thấp
Tâm lý giao dịch trên thị trường quặng nội địa ở tây Liêu Ninh vẫn ảm đạm. Các thương nhân thận trọng trong việc bổ sung hàng và do lo ngại về triển vọng thị trường, họ thể hiện rõ ý định ép giá khi hỏi mua. Tuy nhiên, các nhà sản xuất, do chi phí đầu kỳ cao và tình trạng khan hiếm nguồn quặng thô kéo dài, khó có thể thu mua với giá thấp.
16 Oct 2026 17:18 (GMT+8)
[SMM Điểm tin Thép cuộn & Thép tấm hàng ngày] Chi phí hạ nhiệt phần nào; Giá HRC dự kiến đi ngang vào tuần tới
Giá HRC đi ngang trong tuần này, thị trường giao ngay cũng có xu hướng tương tự. Báo giá chủ đạo dao động trong biên độ 10-30 NDT/tấn trong tuần. Tâm lý giao dịch nhìn chung yếu, người mua hạ nguồn mua theo nhu cầu và ít quan tâm đến việc đầu cơ. Về cơ bản, phía cung, tác động từ bảo trì cán nóng tuần này là 193.800 tấn, tăng 53.400 tấn so với tuần trước. Tuy nhiên, tác động từ bảo trì dự kiến giảm xuống còn 144.900 tấn vào tuần tới, và áp lực từ sản lượng phục hồi vẫn đáng chú ý. Phía cầu, người mua hạ nguồn chủ yếu bổ sung hàng theo nhu cầu sau kỳ nghỉ. Ngành ô tô và đồ gia dụng nhìn chung vẫn yếu, trong khi ngành máy móc hỗ trợ ở mức khiêm tốn. Nhu cầu biểu kiến đối với HRC phục hồi 356.300 tấn so với tuần trước trong tuần này, phần lớn bù đắp mức giảm trước đó là 336.400 tấn, đánh dấu phản hồi tích cực đáng chú ý đầu tiên sau kỳ nghỉ. Tuy nhiên, việc truyền tải nhu cầu vào khối lượng công việc thực tế vẫn chậm, và người dùng cuối tỏ ra ít chấp nhận các nguồn hàng giá cao. Về chi phí, hầu hết các nhà máy thép vẫn trong tình trạng thua lỗ, và cả chi phí thấp hơn lẫn kỳ vọng cắt giảm sản lượng đều hạn chế khả năng giảm sâu. Tóm lại, sự mất cân bằng cung cầu trong các yếu tố cơ bản của HRC đã giảm nhẹ, nhưng tồn kho cao và hỗ trợ chi phí nới lỏng tiếp tục gây áp lực lên giá. Hợp đồng được giao dịch nhiều nhất dự kiến sẽ dao động trong khoảng 3.200-3.270 NDT/tấn vào tuần tới, tiếp tục đi ngang.
16 Oct 2026 17:17 (GMT+8)
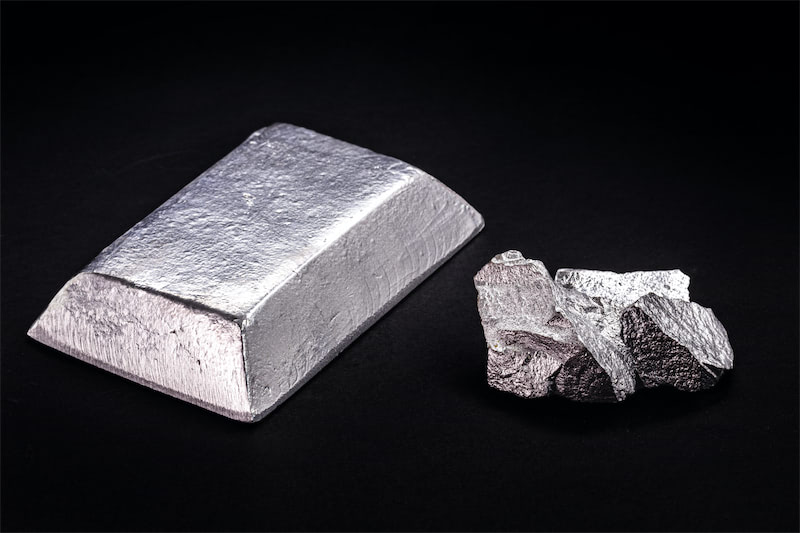
Cân bằng cung cầu yếu vẫn chưa thay đổi, giá thép sẽ dao động ở mức thấp
16 Oct 2026 16:29 (GMT+8)
![[SMM Thép]](https://imgqn.smm.cn/usercenter/vhvTQ20251217171715.jpg)
[SMM Thép]
16 Oct 2026 16:25 (GMT+8)
![[SMM Thép]](https://imgqn.smm.cn/usercenter/GfiYT20251217171720.jpg)
[SMM Thép]
16 Oct 2026 16:23 (GMT+8)
[SMM Thép]
[SMM Thép] Phản hồi thị trường: Hiện tại, giá FOB thép cây B500B quy cách Φ18mm được báo ở mức 477 USD/tấn, cảng bốc hàng là cảng Thiên Tân.
16 Oct 2026 16:23 (GMT+8)
[SMM Thép]
[SMM Thép] Phản hồi thị trường cho thấy giá chào FOB hiện tại đối với phôi vuông 3SP, kích thước 150×150 mm, ở mức 463 USD/tấn, cảng giao hàng là cảng Giang Âm.
16 Oct 2026 16:20 (GMT+8)
[SMM Thép]
[Tấm & Lá thép] Giá xuất khẩu HRC và một số loại tấm & lá thép khác tăng 1 USD/tấn so với tuần trước trong hôm nay, với giá giao dịch HRC tập trung trong khoảng 490-492 USD/tấn. Các yêu cầu và giao dịch trên thị trường ở mức trung bình, với một số khách hàng ngoài Trung Quốc cho biết mức chào hàng thấp hơn đáng kể so với báo giá thị trường hiện tại.
16 Oct 2026 16:19 (GMT+8)
[Vraj Iron Đẩy Nhanh Quá Trình Phê Duyệt Môi Trường cho Dự Án Thép Raipur]
Vraj Iron and Steel đã nhận Điều khoản tham chiếu mới từ Bộ Môi trường, Rừng và Biến đổi khí hậu Ấn Độ vào ngày 14 tháng 10 cho dự án thép mới tại Raipur, Chhattisgarh. Phê duyệt này xác định phạm vi các nghiên cứu môi trường cần thiết, cho phép công ty tiến hành đánh giá tác động môi trường và tham vấn cộng đồng trước khi xin cấp phép môi trường cuối cùng. Đây là bước pháp lý sơ bộ và không cho phép xây dựng hay sản xuất. Dự án đề xuất bao gồm công suất hàng năm 900.000 tấn viên quặng, 462.000 tấn sắt hoàn nguyên trực tiếp, 412.500 tấn thép lò cảm ứng và 392.700 tấn sản phẩm cán.
16 Oct 2026 16:15 (GMT+8)
[SMM Đánh giá Tuần Thị trường Indonesia] HRC, Phôi giảm; Thép cuộn giữ ổn định giữa nhu cầu thấp và giá Trung Quốc đi ngang
So với tuần trước, thép cuộn giữ ở mức 500 USD/tấn, phôi giảm từ 490 USD xuống 480 USD/tấn, thép cuộn cán nóng giảm xuống 515 USD/tấn, và phôi vuông giảm xuống 470 USD/tấn (giá xuất xưởng). Nhu cầu tại Indonesia đang cực kỳ thấp, và các nhà máy không thể giao hàng nhanh cho người mua vì lịch giao hàng đã được ấn định đến tháng 1 năm 2027 và không có hàng tồn kho giao ngay. Các nhà máy đã bắt đầu tìm kiếm hoạt động kinh doanh khác, khiến giá cả sản phẩm thép dẹt và thép dài biến động mạnh hơn.
Thép cuộn dùng cho các dự án đường cao tốc có nhu cầu mạnh nhất trong bốn sản phẩm. Một số người mua vẫn mua từ các nhà máy nhỏ ở Java, mặc dù giá của họ có thể cao hơn 35–50 USD/tấn. Phôi có lẽ giảm ít nhất cho đến nay, do nhu cầu giao hàng vào tháng 1 năm 2027 hỗ trợ giá.
Tuần tới, các nhà máy dự kiến có rất ít hoặc không có khả năng tăng giá, vì nhu cầu tổng thể yếu và giá thép Trung Quốc vẫn chưa tăng.
16 Oct 2026 16:14 (GMT+8)
[Các nhà máy cán thép và nhà sản xuất tích hợp Ai Cập tranh cãi về thuế tự vệ phôi thép trước thềm đàm phán ngày 19/10]
Các nhà máy cán thép và các nhà sản xuất thép tích hợp của Ai Cập đang bất đồng về thuế tự vệ đối với nhập khẩu phôi thép, với đại diện ngành dự kiến sẽ gặp các bộ trưởng phụ trách công nghiệp, đầu tư và ngoại thương vào ngày 19 tháng 10. Theo Nghị quyết số 121 năm 2026, Ai Cập đã áp thuế tự vệ ba năm đối với nhập khẩu phôi thép, bắt đầu ở mức 13,12% (tối thiểu 70 USD/tấn) trong năm đầu tiên và giảm xuống 11% (tối thiểu 59 USD/tấn) vào năm thứ ba. Các nhà máy cán cho biết thuế làm tăng chi phí sản xuất của họ và lập luận rằng lượng phôi sẵn có nên được đo bằng khối lượng thực tế có sẵn để bán, vì các nhà sản xuất tích hợp tiêu thụ một phần sản lượng của chính họ. Các nhà sản xuất tích hợp bảo vệ các biện pháp này, lưu ý rằng nhập khẩu phôi đã tăng từ khoảng 128.000 tấn năm 2021 lên 1,7 triệu tấn năm 2024, và vẫn đạt khoảng 430.000 tấn trong tháng 1-tháng 8 năm 2026. Công suất phôi của Ai Cập vào khoảng 13,6 triệu tấn mỗi năm, so với nhu cầu ước tính 8,8 triệu tấn cho sản xuất thép cây.
16 Oct 2026 16:14 (GMT+8)
[ArcelorMittal Tiến Hành Dự Án Lò Điện Hồ Quang 2 Triệu Tấn/Năm Tại Dunkirk Và Mở Rộng Thép Điện Mardyck]
ArcelorMittal đã công bố tiến độ dự án sản xuất thép carbon thấp trị giá 1,3 tỷ euro tại Dunkirk và dự án mở rộng thép điện trị giá 500 triệu euro tại Mardyck, Pháp. Tại Dunkirk, công ty đang xây dựng một lò hồ quang điện (EAF) công suất 2 triệu tấn/năm và một lò luyện kim thùng, với công tác chuẩn bị đang được tiến hành và 300 triệu euro đã được cam kết cho việc chuẩn bị mặt bằng và thiết bị có thời gian giao hàng dài. Sử dụng thép phế liệu tái chế, HBI hoặc DRI và gang, lộ trình mới dự kiến phát thải khoảng 0,6 tấn CO₂ trên mỗi tấn thép, thấp hơn khoảng hai phần ba so với lộ trình lò cao. Hồ sơ xin cấp phép đã được nộp, với đợt tham vấn cộng đồng bắt đầu từ ngày 15 tháng 10. Tại Mardyck, nơi ba dây chuyền thép điện đầu tiên bắt đầu vận hành vào tháng 3, việc lắp đặt thiết bị cho dây chuyền ủ-tẩy gỉ và máy cán đảo chiều đang gần hoàn tất, với các thử nghiệm ban đầu dự kiến vào mùa xuân năm 2027. Các dây chuyền mới sẽ hoàn thiện chuỗi sản xuất tích hợp cho thép điện dùng trong động cơ và máy phát điện.
16 Oct 2026 16:14 (GMT+8)
![[SMM Analysis] Bối cảnh lithium của Zimbabwe: xuất khẩu tăng trưởng nhanh chóng & chính sách đẩy nhanh chế biến hạ nguồn nội địa](https://imgqn.smm.cn/usercenter/wzbHd20251217171731.jpg)
[SMM Analysis] Bối cảnh lithium của Zimbabwe: xuất khẩu tăng trưởng nhanh chóng & chính sách đẩy nhanh chế biến hạ nguồn nội địa
Các sản phẩm lithium của Zimbabwe đã nổi lên như một nguồn thu xuất khẩu hàng đầu của nước này, với Tổng công ty Tiếp thị Khoáng sản Zimbabwe (MMCZ) báo cáo mức tăng trưởng doanh số đáng kể. Đồng thời, khi lệnh cấm xuất khẩu tinh quặng lithium vào tháng 1 năm 2027 đang đến gần, khoảng cách đang xuất hiện giữa tiến độ xây dựng các dự án chế biến hạ nguồn trong nước và các yêu cầu của chính sách chính phủ, làm dấy lên lo ngại về tính liên tục và cơ cấu nguồn cung nguyên liệu lithium. Tinh quặng vẫn chiếm ưu thế, doanh số tăng 368% Theo dữ liệu MMCZ công bố ngày 8 tháng 10, tổng doanh thu xuất khẩu sản phẩm khoáng sản của Zimbabwe đạt 4,735 tỷ USD trong giai đoạn từ tháng 1 đến tháng 9 năm 2026, tăng 101,8% so với cùng kỳ năm trước. Doanh số sản phẩm lithium chiếm khoảng 2,159 tỷ USD, tương đương 45,6% doanh thu xuất khẩu khoáng sản trong phạm vi báo cáo, vượt qua nhóm kim loại bạch kim để trở thành một trong những nguồn thu xuất khẩu khoáng sản lớn nhất của nước này. Theo sản phẩm, doanh số tinh quặng spodumene đạt khoảng 1,812 tỷ USD, tăng 368,2% so với cùng kỳ năm trước, chiếm khoảng 83,9% tổng doanh số sản phẩm lithium. Trong cùng kỳ, doanh số petalite đạt khoảng 155 triệu USD, tăng 583,3%, trong khi doanh số lithium sulphate đạt khoảng 191 triệu USD với khối lượng bán 33.807 tấn — một mặt hàng không ghi nhận doanh số nào trong cùng kỳ năm 2025. Về giá cả, Zimbabwe đạt giá bán trung bình khoảng 1.483 USD/tấn đối với tinh quặng spodumene trong ba quý đầu năm, tăng từ 387 USD/tấn một năm trước đó, tương đương mức tăng khoảng 283%. Điều này cho thấy mức tăng trưởng rõ rệt của doanh thu xuất khẩu lithium không chỉ do thay đổi về khối lượng xuất khẩu mà còn do giá tinh quặng tăng mạnh. Về cơ cấu xuất khẩu, mặc dù xuất khẩu thương mại lithium sulphate đã có tiến triển, tinh quặng spodumene vẫn là nguồn doanh thu chính. Theo giá trị, tinh quặng spodumene và petalite cùng chiếm khoảng 91,1% doanh số sản phẩm lithium, phản ánh ngành công nghiệp lithium của Zimbabwe vẫn đang trong giai đoạn chuyển đổi từ xuất khẩu tinh quặng sang chế biến hạ nguồn trong nước. Dự án lithium sulphate Bikita bị trì hoãn; các công ty tìm kiếm gia hạn thời gian chuyển đổi chính sách Khi doanh thu xuất khẩu lithium tăng trưởng nhanh chóng, chính sách chế biến nội địa của Zimbabwe đã bước vào giai đoạn triển khai quan trọng. Theo truyền thông địa phương đưa tin ngày 9 tháng 10, Bikita Minerals, một công ty con của Tập đoàn Tài nguyên Sinomine, đã làm việc với chính phủ về các hạn chế xuất khẩu tinh quặng lithium dự kiến vào đầu năm 2027, nhằm tìm kiếm thêm thời gian chuyển đổi. Bikita đang xây dựng một nhà máy lithium sulphate với công suất hàng năm 100.000 tấn, với tổng vốn đầu tư khoảng 400 triệu USD. Dự án ban đầu dự kiến hoàn thành vào tháng 3 năm 2027, nhưng sự chậm trễ trong vận chuyển thiết bị và các yếu tố chuỗi cung ứng đã đẩy thời gian dự kiến bắt đầu vận hành sang tháng 7 năm 2027 — muộn hơn so với thời điểm dự kiến thực hiện các hạn chế xuất khẩu tinh quặng. Công ty cũng đã yêu cầu chính phủ xem xét lại cách bố trí các loại thuế và phí bản quyền liên quan đến xuất khẩu nhằm giảm bớt áp lực vận hành do chi phí vốn và biến động giá lithium tạo ra. Ngoài ra, Bikita cho biết một khi hệ thống hạn ngạch xuất khẩu được áp dụng, một số sản phẩm khoáng sản đang bị tồn đọng tại mỏ, tạo áp lực lên công suất lưu trữ hiện có. Điều này có nghĩa là ngay cả khi các mỏ có khả năng duy trì sản xuất, khối lượng xuất khẩu thực tế vẫn có thể bị hạn chế bởi hạn ngạch xuất khẩu cũng như điều kiện lưu trữ và hậu cần. Chính phủ tái khẳng định mốc thời gian cấm năm 2027; quá trình chuyển đổi năng lực chế biến nội địa vẫn còn nhiều thách thức Trước yêu cầu trì hoãn của các công ty, chính phủ Zimbabwe vẫn giữ vững lập trường thúc đẩy chế biến trong nước. Ngày 9 tháng 10, Bộ trưởng Thông tin Zimbabwe Nick Mangwana cho biết các công ty khai thác lithium liên quan đã được trao đủ thời gian để chuẩn bị các cơ sở chế biến nội địa và không có lý do gì để trì hoãn lệnh cấm xuất khẩu tinh quặng lithium dự kiến vào tháng 1 năm 2027. Vào tháng 2 năm 2026, Zimbabwe đã đình chỉ xuất khẩu tinh quặng lithium, trước khi khôi phục một phần vào tháng 4 thông qua hệ thống quản lý hạn ngạch theo công ty. Tuy nhiên, định hướng chính sách hạn chế hoàn toàn xuất khẩu tinh quặng vào năm 2027 vẫn chưa chính thức thay đổi. Hiện tại, dự án Arcadia của Huayou Cobalt đã đạt được sản xuất thương mại và xuất khẩu lithium sulphate, trong khi các mỏ bao gồm Bikita, Kamativi và Sabi Star vẫn đang ở giai đoạn xây dựng hoặc lập kế hoạch cho các dự án chế biến nội địa. Với tiến độ vận hành khác nhau giữa các dự án, liệu năng lực chế biến lithium sulphate trong nước có thể hấp thụ sản lượng tinh quặng hiện có vào đầu năm 2027 hay không vẫn còn phải chờ xem. Tăng trưởng xuất khẩu song hành với hạn chế chính sách: điều chỉnh cơ cấu phía trước đối với nguồn cung nguyên liệu lithium của Trung Quốc Zimbabwe là một trong những quốc gia nguồn cung chính cho tinh quặng lithium nhập khẩu của Trung Quốc, và những thay đổi trong chính sách xuất khẩu của nước này sẽ ảnh hưởng trực tiếp đến các thỏa thuận thu mua nguyên liệu ở nước ngoài của các nhà sản xuất muối lithium Trung Quốc. Dữ liệu ba quý đầu năm 2026 cho thấy xuất khẩu tinh quặng lithium của Zimbabwe vẫn duy trì quy mô thương mại đáng kể. Mặc dù xuất khẩu lithium sulphate đã bắt đầu đóng góp thêm sản lượng, cơ cấu sản phẩm vẫn chủ yếu là tinh quặng. Trong ngắn hạn, xuất khẩu tinh quặng lithium của Zimbabwe trong quý 4 năm 2026 sẽ tiếp tục chịu ảnh hưởng của hệ thống hạn ngạch hiện hành và điều kiện hậu cần thực tế. Đối với các công ty muối lithium Trung Quốc, tốc độ hàng về sẽ phụ thuộc không chỉ vào sản lượng mỏ mà còn vào giấy phép xuất khẩu, lịch trình vận chuyển tại cảng và chu kỳ vận tải. Bước sang năm 2027, nếu Zimbabwe thực thi nghiêm ngặt lệnh cấm xuất khẩu tinh quặng theo lịch trình ban đầu trong khi một số dự án lithium sulphate chưa đạt được sản xuất ổn định, xuất khẩu nguyên liệu lithium của nước này có thể đối mặt với áp lực tạm thời về tính liên tục của nguồn cung trong quá trình chuyển đổi từ tinh quặng sang lithium sulphate. Đối với thị trường Trung Quốc, những thay đổi về lượng tinh quặng về cảng có thể ảnh hưởng đến cơ cấu thu mua nguyên liệu của một số nhà sản xuất muối lithium và gây ra những xáo trộn ngắn hạn đối với giá tinh quặng spodumene. Tuy nhiên, tác động giá thực tế sẽ phụ thuộc vào mức độ thực thi chính sách, tăng trưởng nguồn cung từ các quốc gia khác, tồn kho nguyên liệu tại các cảng và nhà máy luyện kim của Trung Quốc, cũng như những thay đổi về nhu cầu muối lithium ở hạ nguồn. Nhìn chung, ngành công nghiệp lithium của Zimbabwe đang ở giao điểm giữa tăng trưởng doanh thu xuất khẩu nhanh chóng và chính sách đẩy nhanh chế biến hạ nguồn trong nước. Trong những tháng tới, việc chính phủ có đưa ra các thỏa thuận xuất khẩu chuyển tiếp hay không, tiến độ xây dựng thực tế của các dự án như Bikita, và những thay đổi trong cơ cấu xuất khẩu giữa tinh quặng và lithium sulphate sẽ là những chỉ số then chốt để đánh giá nguồn cung nguyên liệu lithium của Trung Quốc vào năm 2027.
12 Oct 2026 22:18 (GMT+8)
![[SMM Phân tích Vonfram] Một thị trường, hai mức giá: Làm thế nào để phá vỡ thế bế tắc cơ cấu trên thị trường vonfram?](https://imgqn.smm.cn/usercenter/FHiZE20251217171722.jpeg)
[SMM Phân tích Vonfram] Một thị trường, hai mức giá: Làm thế nào để phá vỡ thế bế tắc cơ cấu trên thị trường vonfram?
09 Oct 2026 13:21 (GMT+8)
![[Phân tích SMM] Kỳ vọng nhu cầu yếu chi phối, giá lithium cacbonat giao ngay giảm xuống dưới mốc 110.000 Nhân dân tệ](https://imgqn.smm.cn/usercenter/fblvS20251217171729.png)
[Phân tích SMM] Kỳ vọng nhu cầu yếu chi phối, giá lithium cacbonat giao ngay giảm xuống dưới mốc 110.000 Nhân dân tệ
12 Oct 2026 14:16 (GMT+8)
![[SMM Analysis] Dữ liệu xuất nhập khẩu lưu huỳnh và axit sunfuric của Indonesia tháng 8](https://imgqn.smm.cn/usercenter/qcyEh20251217171709.jpg)
[SMM Analysis] Dữ liệu xuất nhập khẩu lưu huỳnh và axit sunfuric của Indonesia tháng 8
08 Oct 2026 11:02 (GMT+8)
[SMM Analysis] Đánh giá thép không gỉ ngoài Trung Quốc quý 3: Phụ phí châu Âu giảm 158 EUR/tấn, nhưng giá CIF tăng 2,8%
08 Oct 2026 15:36 (GMT+8)

Vàng: Morgan Stanley cho rằng tiềm năng tăng giá vượt xa rủi ro giảm – 4.000 USD là ngưỡng hỗ trợ
09 Oct 2026 13:46 (GMT+8)
![[SMM Phân tích] Tăng trưởng nhu cầu thép của Ấn Độ có thể bù đắp sự chậm lại của Trung Quốc?](https://imgqn.smm.cn/usercenter/niwZw20251217171715.jpg)
[SMM Phân tích] Tăng trưởng nhu cầu thép của Ấn Độ có thể bù đắp sự chậm lại của Trung Quốc?
09 Oct 2026 10:38 (GMT+8)
Tin mới nhất
[SMM Đánh giá HRC toàn cầu hàng tuần] Phí bảo hiểm nhập khẩu EU giảm khi hạn ngạch cạn kiệt; Đông Nam Á yếu trái ngược với sự hỗ trợ của châu Âu
1 giờ trước
[SMM Analysis] Thiếu động lực tăng/giảm; Giá thép silic GO dự kiến duy trì yếu và ổn định trong tháng 10
16 Oct 2026 17:28 (GMT+8)
Gerdau Corsa mở rộng công suất tái chế phế liệu tại Mexico để thúc đẩy sản xuất thép bền vững
16 Oct 2026 17:23 (GMT+8)
Xuất khẩu thép phủ màu của Đài Loan đạt gần 20.000 tấn trong tháng 9
16 Oct 2026 17:23 (GMT+8)
SSAB khởi công xây dựng dây chuyền tôi Oxelösund, bổ sung 100.000 tấn công suất thép chịu mài mòn cao cấp
16 Oct 2026 17:23 (GMT+8)
Giá vật liệu xây dựng Mỹ tăng trong tháng 9; thép thanh cán nóng, thép tấm và thép hình kết cấu tăng 3,0% so với tháng trước
16 Oct 2026 17:22 (GMT+8)
British Steel kêu gọi tăng cường vai trò của các nhà sản xuất trong nước trong các dự án xây dựng tại Anh
16 Oct 2026 17:22 (GMT+8)
[SMM Analysis]Các nhà máy tăng giá khi nhu cầu yếu; thép silicon không định hướng có thể tăng rồi ổn định trong tháng 10
16 Oct 2026 17:18 (GMT+8)
[Bản tin quặng sắt nội địa] Giá tinh quặng sắt tại tây Liêu Ninh có thể đi ngang ở mức thấp
16 Oct 2026 17:18 (GMT+8)
[SMM Điểm tin Thép cuộn & Thép tấm hàng ngày] Chi phí hạ nhiệt phần nào; Giá HRC dự kiến đi ngang vào tuần tới
16 Oct 2026 17:17 (GMT+8)
Cân bằng cung cầu yếu vẫn chưa thay đổi, giá thép sẽ dao động ở mức thấp
16 Oct 2026 16:29 (GMT+8)
[SMM Thép]
16 Oct 2026 16:25 (GMT+8)
[SMM Thép]
16 Oct 2026 16:23 (GMT+8)
[SMM Thép]
16 Oct 2026 16:23 (GMT+8)
[SMM Thép]
16 Oct 2026 16:20 (GMT+8)
[SMM Thép]
16 Oct 2026 16:19 (GMT+8)
[Vraj Iron Đẩy Nhanh Quá Trình Phê Duyệt Môi Trường cho Dự Án Thép Raipur]
16 Oct 2026 16:15 (GMT+8)
[SMM Đánh giá Tuần Thị trường Indonesia] HRC, Phôi giảm; Thép cuộn giữ ổn định giữa nhu cầu thấp và giá Trung Quốc đi ngang
16 Oct 2026 16:14 (GMT+8)
[Các nhà máy cán thép và nhà sản xuất tích hợp Ai Cập tranh cãi về thuế tự vệ phôi thép trước thềm đàm phán ngày 19/10]
16 Oct 2026 16:14 (GMT+8)
[ArcelorMittal Tiến Hành Dự Án Lò Điện Hồ Quang 2 Triệu Tấn/Năm Tại Dunkirk Và Mở Rộng Thép Điện Mardyck]
16 Oct 2026 16:14 (GMT+8)