

News
Exclusive analysis articles with the latest market updates, and real-time news feeds.

China’s Spodumene Imports Rise 7% MoM in September, with Australia, Nigeria and Zimbabwe the Top Three Sources
According to compiled Chinese customs data, China imported 970,100 physical tonnes of spodumene in September 2026, up approximately 7.0% from 906,600 tonnes in August. Based on the classification and assumed grades, moisture content and conversion factors used in this analysis, September imports represented approximately 81,300 tonnes of lithium carbonate equivalent (LCE). By origin, imports from Australia, Nigeria and Zimbabwe increased significantly. Australia remained the largest supplier, with shipments to China reaching 446,200 tonnes, up approximately 36.7% month on month and accounting for around 46.0% of total imports. Nigeria became the second-largest supplier at 189,800 tonnes, up approximately 40.1%, while imports from Zimbabwe rose approximately 83.0% to 136,500 tonnes. Imports from South Africa fell approximately 49.6% to 112,400 tonnes, whereas imports from Brazil increased approximately 30.9% to 81,200 tonnes. Smaller volumes came from Burundi, Rwanda and Mozambique, at approximately 1,800 tonnes, 1,300 tonnes and 1,000 tonnes, respectively, with limited shipments from Zambia and Somalia. No imports from Mali or Canada appeared in the September dataset. Overall, China’s spodumene imports continued to grow in September, with the composition shifting toward concentrate. Under the classification used in this analysis, concentrate imports reached approximately 688,800 tonnes, accounting for 71.0% of total physical imports, compared with 60.7% in August. Raw ore imports stood at approximately 281,300 tonnes. Increased concentrate imports from Australia, Zimbabwe and Nigeria offset lower imports from Mali and Canada, providing the main support for growth in China’s imported lithium resource supply during the month.
Oct 20, 2026 19:03 (GMT+8)
[SMM Analysis] Hoa Phat’s record HRC sales reshape Vietnam’s self-sufficiency and China’s export flows
Hoa Phat sold 5.47 Mt of hot-rolled coil in January to September, up 59% and about a third of Vietnam’s consumption, with 24.6% of third-quarter sales exported. Vietnam’s HRC demand of about 17.3 Mt this year still exceeds local output of about 10.8 Mt by 6.5 Mt, and new capacity arrives mainly after 2027. Anti-dumping duties have pushed mainstream Chinese coil out of Vietnam; Chinese mills now face Vietnamese coil in ASEAN and other third markets.
Oct 20, 2026 14:36 (GMT+8)
China's Rare Earth Magnet Exports Hit Record in September, Driven by Backlog Release and Regulatory Easing【SMM Analysis】
China’s September rare earth magnet exports hit a record 6,165 tonnes (+23% MoM), driven by clearance of July–August port backlogs, not new demand. US-China talks unblocked shipments, while EU “green channel” talks lifted Q4 forecast to ~5,700 tonnes/month. Large producers recovered fastest; small mills remain constrained.
Oct 20, 2026 16:06 (GMT+8)
Latest News

Magnesium Prices Decline then Rebound, Stabilizing at Weak Level Amid Tight Supply and Loose Demand
Oct 23, 2026 16:57 (GMT+8)

SMM Weekly: Magnesium Output Drops 3.5% MoM, More Smelters to Suspend Production
Oct 23, 2026 16:53 (GMT+8)
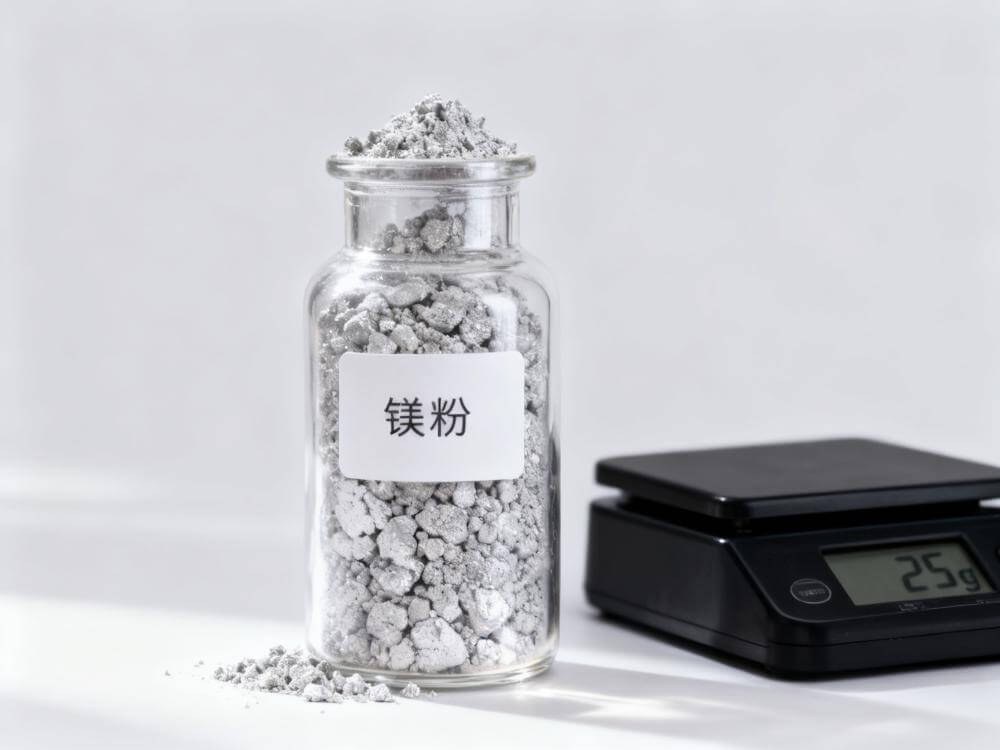
Shaanxi Magnesium Ingot Costs Drop, Prices Rebound, Losses Narrow for Producers
Oct 23, 2026 16:52 (GMT+8)
Magnesium prices fell then rose, weakness unchanged; weak demand leads to inventory divergence [SMM Magnesium Weekly Data]
[Magnesium Prices First Fell and Then Rose, Weakness Unchanged; Weak Demand Led to Inventory Divergence] This week, the magnesium market first fell and then rose. The persistently sluggish market continued to squeeze magnesium factory profits, with losses intensifying. Enterprise production enthusiasm declined, and production cuts increased, leading to an overall pullback in production. Inventory trends diverged, with in-factory inventory seeing some destocking, while social inventory accumulated again.
Oct 23, 2026 14:44 (GMT+8)
Weak prices and divergent buying sentiment coupled with the influence of delivery and bearish sentimentimpact the market
【SMM Magnesium Flash】This week, the social inventory of magnesium ingots increased by 1.79% month-on-month, continuing its upward trend. The core issue lies in the continuous downward trend of magnesium ingot prices, which has attracted some traders to enter the market at low prices. The rigid demand for delivery and stocking has driven the inventory to rise. The magnesium ingot market experienced a decline followed by an increase this week. Although there was a slight rebound, the overall weak trend has not been reversed. Some traders had good pricing for early orders, and there is profit potential in stocking at current low prices, so they chose to purchase at the right time, pushing up social inventory. However, the market sentiment is strongly bearish, coupled with fewer new orders and the continuous strengthening of the RMB, traders are generally cautious in their operations and have not blindly stockpiled goods. Except for stocking for delivery at the end of the month, most transactions are based on back-to-back spot sales, so there has been no significant accumulation of inventory.
Oct 23, 2026 09:03 (GMT+8)
Magnesium prices bottom out—is this a reversal or just a breather after an oversold decline? [SMM Magnesium Weekly Review]
[SMM Magnesium Weekly Review: Upstream Holds Back from Selling, Downstream Stays on the Sidelines; Magnesium Ingot Prices Edge Down Amid Tug-of-War] This week, magnesium prices fell initially before rebounding, stabilizing at weak levels. On the raw material side, the core dolomite mine in Wutai remained suspended, keeping local high-grade supply tight. Smelters expanded their procurement radius, and with external supply replenishing the market, overall supply stabilized. At the start of the week, magnesium ingot prices in major producing areas extended losses. As prices approached cost support levels, smelters grew more reluctant to sell, and restocking by traders drove a phased rebound. However, this rebound was a bargaining-driven correction after overselling, and the medium and long-term supply-demand surplus has not fundamentally reversed. Foreign trade prices followed domestic gains, but actual new orders were limited, and downstream acceptance still needs to be verified. Magnesium powder and magnesium alloy prices moved sideways in line with raw materials. The magnesium alloy industry is in the painful period of replacing old growth drivers with new ones, with traditional downstream demand continuing to shrink and emerging applications yet to provide substantial momentum. Production cuts expanded, and the industry will enter a phase of deep destocking, with processing fee recovery still requiring time.
Oct 22, 2026 15:42 (GMT+8)
Latrobe Magnesium Plans $5M Land Acquisition in South Carolina for 50,000-Ton Magnesium Plant
【SMM Magnesium Flash】On October 22, Latrobe Magnesium announced the signing of a non-binding letter of intent with the Colleton County Economic Development Corporation in South Carolina. The intention is to acquire approximately 250 acres of heavy industrial land in the Colleton Large Industrial Base for $5 million, to construct its planned primary magnesium plant with an annual output of 50,000 tons. Additionally, the company retains the option to purchase adjacent land to support a second-phase expansion to 100,000 tons. The site is located near railways, Interstate 95, and the Port of Charleston, with supporting power, gas, and water facilities. The company will pay a deposit of $500,000 within 10 working days, which is fully refundable during the 120-day due diligence period. The goal is to sign a formal purchase contract within 60 working days. The remaining funds for the project depend on the $30 million financing that is still under negotiation.
Oct 22, 2026 13:54 (GMT+8)
Sep magnesium exports remained weak, varied products still see recovery potential
In September, China’s magnesium product exports totalled 33,200 tons, edging down month-on-month and falling sharply year-on-year by variety. Magnesium ingots fluctuated narrowly, magnesium alloys dropped, and only magnesium powder rose month-on-month, though all posted year-on-year declines. Gold September demand disappointed. Lower magnesium prices and end-October delivery expectations may lift October exports, subject to overseas real orders.
Oct 22, 2026 13:23 (GMT+8)
Continuously falling magnesium prices and widening losses force magnesium smelters to cut output
Following the National Day holiday, magnesium prices kept falling amid ample spot supply from holiday inventory buildup and well-stocked downstream buyers, leaving supply-demand severely imbalanced. Smelters cut prices to spur transactions, deepening the downtrend; rapidly falling prices eroded margins and widened the cost-price inversion. When will magnesium prices stop falling?
Oct 21, 2026 17:52 (GMT+8)
Magnesium smelters' willingness to hold prices firm rebounds, early signs of a rebound emerge in the magnesium market [SMM magnesium ingot spot report]
[Magnesium plants' willingness to hold prices firm rebounds, signs of a magnesium market rebound emerge] The persistently sluggish market has continued to cause losses for magnesium plants, and signs of prices bottoming out are beginning to emerge, suggesting the market may be poised for a change.
Oct 21, 2026 17:09 (GMT+8)
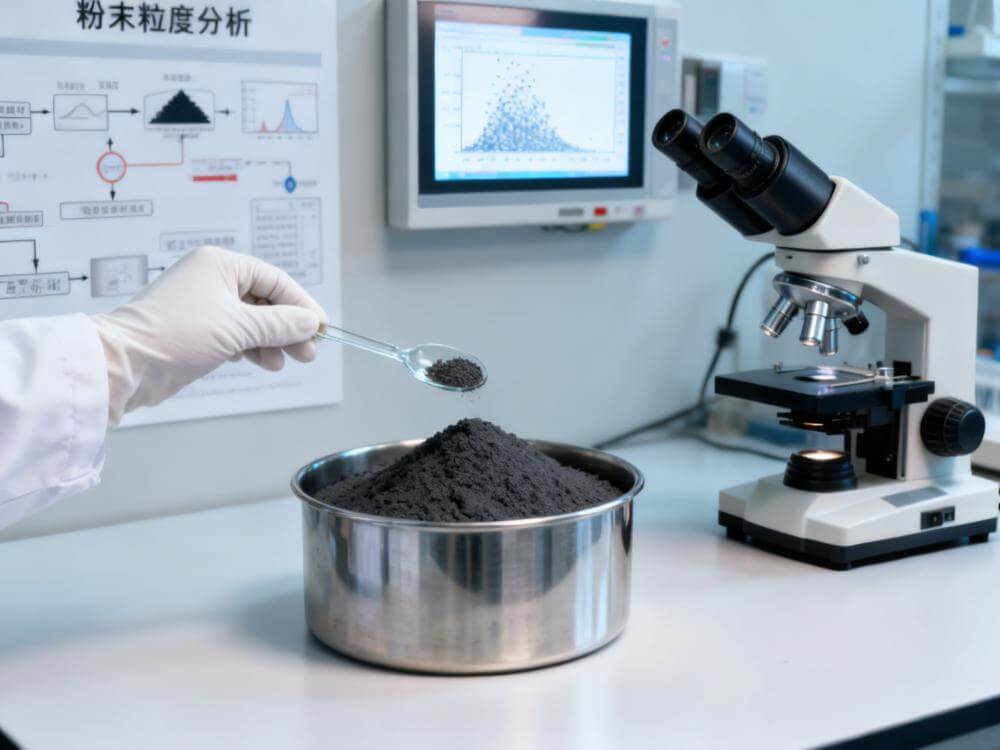
In September, the export of magnesium products showed differentiation, with the overall weak trend continuing unchanged
Oct 20, 2026 09:51 (GMT+8)
Weak market suppresses purchasing willingness across multiple fronts, vicious cycle hinders magnesium market recovery [SMM magnesium ingot spot report]
Oct 19, 2026 17:07 (GMT+8)

National Magnesium Inventory Down 3.52% MoM, Prices Hit Year Low Prompting Smelter Closures
Oct 16, 2026 19:04 (GMT+8)
Shaanxi Magnesium Ingot Costs Rise 1.73%, Industry Sees Wider Losses Amid High Raw Material Prices
【SMM Weekly Magnesium Cost Briefing】From October 10 to October 16, the average production cost of magnesium ingots in Shaanxi province stood at 15,679 yuan/ton, up by around 1.73% week on week. In terms of profits, the industry posted an average loss of 379 yuan/ton this week, with the negative margin between magnesium price and production cost widening markedly. The underlying reasons are as follows: For one thing, the one-sided decline and sharp slump of magnesium prices after the holiday directly erased the remaining profit margins, pushing manufacturers deeper into negative profits. For another, the cost side also exerted simultaneous pressure: the transaction average price of Hongliulin lump coal this week came in at 1,048.77 yuan/ton, an increase of 22.34 yuan/ton from the previous period, while the price of semi-coke remained largely stable. The price hike of lump coal failed to be effectively passed through, exacerbating losses for semi-coke producers and further driving up the cost of magnesium ingots. In the short term, under the dual squeeze of persistently weak magnesium prices and high raw material costs, there remains a lack of support for magnesium plants to restore profits, and the current inverted price-cost situation is likely to persist.
Oct 16, 2026 19:03 (GMT+8)
EU Grants Strategic Status to Verde Magnesium Project, Aiming for 90,000 Tons Annual Production by 2036
【SMM Magnesium Flash】On October 13th, the European Commission granted the strategic project status of the key raw material bill for the processing link of the Verde Magnesium Industries project in Romania. Together with the previously approved mining link, this project has become the only one in Europe to obtain CRMA strategic status across the entire value chain of primary magnesium. Its phased production roadmap shows that the annual production target is set at 360 tons in 2028, increasing to 30,000 tons in 2031, and further expanding to 90,000 tons in 2036. With the establishment of strategic status across the entire chain, the construction of local primary magnesium supply capacity in Europe is expected to accelerate.
Oct 16, 2026 15:54 (GMT+8)
Latrobe Magnesium Advances Demo Plant, Aims for 98% Pure Magnesium by 2026, Expands to US
【SMM Magnesium Flash】On October 16th, Latrobe Magnesium announced its latest progress, stating that the installation progress of Phase 1B of its demonstration plant in Victoria has reached 95%, with 35% of the commissioning completed. The company remains committed to its goal of producing the first batch of magnesium metal with a purity exceeding 98% by the end of 2026. Simultaneously, the company is advancing its plan to build a 50,000-ton magnesium plant in South Carolina, USA, and has secured a total of 32,000 tons/year of non-binding intention to purchase. As of the end of September, the company held AUD 3.4 million in cash and is currently undergoing a fully underwritten share placement financing of AUD 3.4 million, with the deadline for share placement extended from October 19th to October 26th. As the commissioning of the demonstration line progresses, the industrialization verification process of its low-carbon magnesium extraction technology is expected to accelerate further.
Oct 16, 2026 15:45 (GMT+8)
EU Announces 46 Strategic Raw Material Projects, Including Romania's Verde Magnesium Initiative
【SMM Magnesium Flash】On October 10th, the European Commission announced a new round of strategic projects for critical raw materials, with a total of 46 projects covering 15 of the 17 strategic raw materials, including magnesium. The selected magnesium project is the processing project developed by Verde Magnesium in Budureasa, Romania. The company has previously obtained the qualification for magnesium mining projects and aims to become the first primary magnesium producer in Europe in 25 years. It adopts the thermite reduction process and plans to restart the mine by the end of 2026 and build a magnesium smelting plant with an annual output of 30,000 tons by 2030. This round of 46 projects is expected to raise approximately 21.1 billion euros. Currently, China supplies 97% of the magnesium to the EU. This move aims to promote supply chain diversification and reduce dependence on a single source.
Oct 16, 2026 15:44 (GMT+8)
US Initiates 4th Anti-Dumping Sunset Review on Chinese Magnesium Imports, Impacting Future Exports
【SMM Magnesium Flash】 On October 1st, the U.S. Department of Commerce issued an announcement, initiating the fourth anti-dumping sunset review investigation on magnesium metal imported from China. The U.S. International Trade Commission simultaneously launched an industry injury investigation. Interested parties must register their response within 10 days of the announcement and submit their response opinions by November 2nd. The anti-dumping duties can be traced back to the case filing in 2004 and the official imposition in 2005, and have been extended three times since then, in 2011, 2016, and 2021. This review is the fourth assessment of the retention or abolition of this measure after more than two decades of implementation. If both agencies make affirmative rulings, the tax order will continue to be maintained. The previous three reviews all ended with affirmative final rulings, and the outcome of this review will directly affect the export prospects of Chinese magnesium metal to the United States.
Oct 16, 2026 15:42 (GMT+8)
Magnesium Prices Continue to Hit Bottom Amid Weakness, Supply-Demand Pattern Unlikely to Change in the Short Term [SMM Magnesium Weekly Data]
[Magnesium Prices Continue to Hit Bottom Amid Weakness; Supply-Demand Pattern Unlikely to Change in Short Term] This week, the magnesium industry chain remained broadly in the doldrums. On the raw material side, the Wutai dolomite mine halted production, and after enterprises purchased externally to supplement supply, the shortage eased, with ore prices holding steady. Magnesium ingot prices in China continued to slide, with the decline slowing near the cost line as prices consolidated at lows. Meanwhile, export FOB prices followed the domestic decline, and overseas inquiries only lifted sentiment, with no actual deals concluded yet. Magnesium powder and magnesium alloy came under pressure simultaneously, as downstream demand from automobiles, EVs, and steel desulfurization remained weak. Deep-processing enterprises cut production and destocked, and processing fees showed little sign of improvement. In the short term, prices are likely to remain in the doldrums.
Oct 16, 2026 14:47 (GMT+8)
National Magnesium Inventory Down 3.52% MoM, Prices Hit Year-Low Prompting Smelter Shutdowns
【SMM Weekly Magnesium Inventory Express】This week, the national inventory of primary magnesium smelting enterprises decreased by 3.52% month-on-month. Primary magnesium smelting enterprises operated normally during the National Day holiday. Although some futures were pre-sold by manufacturers before the holiday, a portion of magnesium ingots still failed to flow to the terminal market, exacerbating the oversupply pattern in the magnesium ingot market. Magnesium plants actively stimulated transactions at low prices, and some manufacturers achieved notable results in destocking, leading to a downward trend in national primary magnesium inventory. As magnesium prices have fallen to the lowest point of the year, primary magnesium smelters are increasingly inclined to suspend production, and the inventory is expected to continue its downward trend in the follow-up.
Oct 16, 2026 11:56 (GMT+8)
Early Bird Bookings Now Open for 2027 SMM LZE (22nd) Lead & Zinc Conference and Industry Expo in Yunnan next March
——From Conference to Expo · Doubled Scale · Full Upgrade—— [What This Article Brings You] ① Exhibition Introduction ② How to Register ③ First Batch of Exhibitors ④ Conference Agenda I. Doubled Scale, Full Upgrade! In 2026, lead and zinc face sharp volatility—elevated lead prices, scarce high-purity lead, record high LME low-grade lead stocks, lead-acid battery relocation from China to overseas, deeply negative zinc concentrate TCs, tight high-quality imported zinc ore, open export window for zinc ingots, and overseas zinc smelter buildout. The LZE covers market outlook, price forecast, equipment technology, recycling, and downstream applications—driving green transformation and win-win growth. What sets the 2027 (22nd) LZE apart from earlier events is its transformative upgrade: moving from a pure industry conference to a seamlessly combined conference and industry expo — deliver a larger-scale gathering, an expanded industry showcase and far-reaching involvement across the entire lead and zinc value chain. From industry trend analysis to in-depth industry chain exchanges, from upstream and downstream supply-demand matching to concentrated enterprise showcases, from a single industry conference to the further integration of "conference + industry expo"——in 2027, SMM LZE enters the "expo" era! The conference will embrace its 22nd edition with a larger scale, a richer industry lineup, and broader upstream and downstream participation! Scan the QR Code Below to Register as A Visitor for Free 1. Conference Scale Delegation: 6,000+ (up 71.4% from the previous edition) Companies: 2,000+ (up 100% from the previous edition) Exhibitors: 120+ (up 50% from the previous edition) Supply-demand matchmaking: 300+ (up 50% from the previous edition) Dedicated Forums: 7 (1 more than the previous edition) 2. Participant Groups 20% - Miners 23% - Smelters 22% - Processing enterprises 10% - Traders 5% - Lead-zinc end-user procurement 15% - Third-party equipment, technology, auxiliary materials, media, etc. 3% - Government, associations, university research institutions 2% - Financial and futures firms 3. Job Title Breakdown 4. Conference Highlights Price trends, consumption outlook, and policy interpretation Global dialogue on the lead-zinc industry and go-global strategies One-on-One Business Meetings Exploring Breakthrough Paths in Mining & Metallurgy Technology and Resource Recycling Showcase of Cutting-Edge Equipment and Consumables II. Four Identities, One Lead-Zinc Exhibition Whether you are here for market insights, procurement, showcasing or brand exposure, you will find a participation option that suits you. 1. Professional Visitors (Explore the exhibition for business opportunities and connect with the upstream and downstream of the industry) [Visitor Benefits] Exhibition Area Ticket On-site Check-in Gifts SMM Exclusive Lead-Zinc Industry Distribution Map Lead-Zinc Industry Visitor Exchange Group Group Benefits Tickets for Some Forums …… 2. Conference Delegates (Gain insights into new trends and discuss the lead-zinc market) [Delegate Benefits] Exhibition Area Ticket On-site Check-in Gifts SMM Exclusive Lead-Zinc Industry Distribution Map Lead-Zinc Industry Visitor & Conference Exchange Group Ticket for All Forums of the Conference Executive Dinner Voucher Lunch and Dinner Vouchers During the Conference Enterprise Directory Expert Reports 1-on-1 Supply-Demand Matching Post-Conference Field Trip Activities …… 3. Exhibitor (Step onto the industry stage and showcase your strengths) [18㎡ Custom Booth] [Benefits] Design & construction of all materials for the 18㎡ booth, tables, chairs, sofa & reception desk, TV, 5 conference passes, X-banner stand*1, conference booklet color page*1, LOGO display, multi-platform online exposure and promotion, supply-demand 1-on-1 matchmaking, long-term cooperation support from SMM, etc. [9㎡ Premium Booth] [Benefits] Design & construction of all materials for the 9㎡ booth, printed backdrop wall & reception desk & tables and chairs, TV, 3 conference passes, X-banner stand*1 or conference booklet color page*1, LOGO display, multi-platform online exposure and promotion, supply-demand 1-on-1 matchmaking, long-term cooperation support from SMM, etc. [6㎡ Standard Booth] [Benefits] Design & construction of all materials for the 6㎡ booth, one long table & two chairs, 2 X-banner stands with different content, 2 conference passes, multi-platform online exposure and promotion, supply-demand 1-on-1 matchmaking, long-term cooperation support from SMM, etc.
Oct 22, 2026 09:59 (GMT+8)

2027 Global Aluminum Supply-Demand Outlook: High Margins Drive Expansion, Shifting the Market from Tight to Loose
Oct 21, 2026 09:41 (GMT+8)

Chinese $6Billion Battery Investment in Morocco Reshapes EU Lithium Demand Amid Tariff Shifts
Oct 20, 2026 17:02 (GMT+8)

N-Type vs. P-Type Solar PV Modules: What Sets Them Apart, and Why Is N-Type Gaining Ground in the Global Market?
Oct 21, 2026 09:45 (GMT+8)
China’s Spodumene Imports Rise 7% MoM in September, with Australia, Nigeria and Zimbabwe the Top Three Sources
Oct 20, 2026 19:03 (GMT+8)
![[SMM Analysis] Hoa Phat’s record HRC sales reshape Vietnam’s self-sufficiency and China’s export flows](https://imgqn.smm.cn/usercenter/MhPNV20251217171716.jpg)
[SMM Analysis] Hoa Phat’s record HRC sales reshape Vietnam’s self-sufficiency and China’s export flows
Oct 20, 2026 14:36 (GMT+8)
China's Rare Earth Magnet Exports Hit Record in September, Driven by Backlog Release and Regulatory Easing【SMM Analysis】
Oct 20, 2026 16:06 (GMT+8)
Latest News
Magnesium Prices Decline then Rebound, Stabilizing at Weak Level Amid Tight Supply and Loose Demand
Oct 23, 2026 16:57 (GMT+8)
SMM Weekly: Magnesium Output Drops 3.5% MoM, More Smelters to Suspend Production
Oct 23, 2026 16:53 (GMT+8)
Shaanxi Magnesium Ingot Costs Drop, Prices Rebound, Losses Narrow for Producers
Oct 23, 2026 16:52 (GMT+8)
Magnesium prices fell then rose, weakness unchanged; weak demand leads to inventory divergence [SMM Magnesium Weekly Data]
Oct 23, 2026 14:44 (GMT+8)
Weak prices and divergent buying sentiment coupled with the influence of delivery and bearish sentimentimpact the market
Oct 23, 2026 09:03 (GMT+8)
Magnesium prices bottom out—is this a reversal or just a breather after an oversold decline? [SMM Magnesium Weekly Review]
Oct 22, 2026 15:42 (GMT+8)
Latrobe Magnesium Plans $5M Land Acquisition in South Carolina for 50,000-Ton Magnesium Plant
Oct 22, 2026 13:54 (GMT+8)
Sep magnesium exports remained weak, varied products still see recovery potential
Oct 22, 2026 13:23 (GMT+8)
Continuously falling magnesium prices and widening losses force magnesium smelters to cut output
Oct 21, 2026 17:52 (GMT+8)
Magnesium smelters' willingness to hold prices firm rebounds, early signs of a rebound emerge in the magnesium market [SMM magnesium ingot spot report]
Oct 21, 2026 17:09 (GMT+8)
In September, the export of magnesium products showed differentiation, with the overall weak trend continuing unchanged
Oct 20, 2026 09:51 (GMT+8)
Weak market suppresses purchasing willingness across multiple fronts, vicious cycle hinders magnesium market recovery [SMM magnesium ingot spot report]
Oct 19, 2026 17:07 (GMT+8)
National Magnesium Inventory Down 3.52% MoM, Prices Hit Year Low Prompting Smelter Closures
Oct 16, 2026 19:04 (GMT+8)
Shaanxi Magnesium Ingot Costs Rise 1.73%, Industry Sees Wider Losses Amid High Raw Material Prices
Oct 16, 2026 19:03 (GMT+8)
EU Grants Strategic Status to Verde Magnesium Project, Aiming for 90,000 Tons Annual Production by 2036
Oct 16, 2026 15:54 (GMT+8)
Latrobe Magnesium Advances Demo Plant, Aims for 98% Pure Magnesium by 2026, Expands to US
Oct 16, 2026 15:45 (GMT+8)
EU Announces 46 Strategic Raw Material Projects, Including Romania's Verde Magnesium Initiative
Oct 16, 2026 15:44 (GMT+8)
US Initiates 4th Anti-Dumping Sunset Review on Chinese Magnesium Imports, Impacting Future Exports
Oct 16, 2026 15:42 (GMT+8)
Magnesium Prices Continue to Hit Bottom Amid Weakness, Supply-Demand Pattern Unlikely to Change in the Short Term [SMM Magnesium Weekly Data]
Oct 16, 2026 14:47 (GMT+8)
National Magnesium Inventory Down 3.52% MoM, Prices Hit Year-Low Prompting Smelter Shutdowns
Oct 16, 2026 11:56 (GMT+8)