

News
Exclusive analysis articles with the latest market updates, and real-time news feeds.
![[SMM Analysis] India’s BESS Manufacturing Push Accelerates, but Cell Dependence Remains a Key Bottleneck](https://imgqn.smm.cn/production/admin/votes/imagesozVHm20260131125121.jpeg)
[SMM Analysis] India’s BESS Manufacturing Push Accelerates, but Cell Dependence Remains a Key Bottleneck
In the first quarter of 2026, global energy storage system shipments reached 100.0 GWh, a 96.5% increase from 50.9 GWh in the same period of 2025, bringing quarterly shipments to an entirely new scale.
Sep 30, 2026 08:50 (GMT+8)
SMM Launches Aluminium CBAM Calculator: What Cost Estimates Mean for EU-Bound Offers【SMM Analysis】
As the EU Carbon Border Adjustment Mechanism (CBAM) enters its definitive phase, aluminium trade with Europe requires carbon costs to be assessed alongside metal prices, processing charges and logistics. SMM has launched its Aluminium CBAM Calculator , bringing together product codes, origin, emissions data and certificate prices to support export quotations, European procurement and internal budgeting. The aluminium module offers 58 CN codes and 68 origin/default-value categories, covering unwrought aluminium, profiles, sheet, strip, foil and other products. Annual parameters are available for 2026–2030. Users enter a tonnage and select default emissions or enter verified actual emissions. The page then displays estimated certificates per tonne, total certificates, cost per tonne and total budget, with primary and secondary aluminium routes matched to the applicable data basis. The practical benefit is that assumptions and results appear together. Exporters can specify the product, origin, import period and emissions basis behind a quotation, while buyers can compare sources under consistent conditions. The page includes Chinese and English interfaces, parameter tables and a printable cost-sheet option. How the associated costs are shared between buyers and sellers remains a contractual matter. Certificate exposure should be distinguished from its monetary value. As of 29 September 2026, the calculator incorporates official prices of €75.36 per certificate for Q1 2026 and €75.28 for Q2. The Q3 price has not yet been published. Where a price is unavailable, the page retains certificate-volume estimates and leaves costs blank, rather than substituting an assumed price. The current version excludes deductions for carbon prices paid abroad and assessment of the annual import threshold. Its actual-emissions calculation for complex aluminium goods also lacks the free-allocation adjustment attributable to precursors. The analysis below therefore uses the checked default-value calculation. Results are commercial estimates, not final statutory surrender obligations. For market comparisons, the same aluminium product can carry materially different estimated costs depending on its origin-specific default value. Consider CN 76012040—unwrought aluminium alloys in billet form—with primary route K, the Q2 2026 certificate price and a quantity of 1,000 tonnes. Estimated costs under the Chinese, Indian and Canadian default-value cases are €143.98, €50.41 and €57.86 per tonne, respectively. These figures include the annual default-value mark-up and the benchmark-based free-allocation adjustment. The Chinese and Indian default-value cases differ by approximately €93.57 per tonne. Comparing only the metal price or processing charge may therefore miss a meaningful difference in the buyer's budget. Where other commercial terms are similar, estimated CBAM costs could affect an offer's attractiveness. However, this is not a ranking of producers' actual carbon intensity. Freight, customs duties, quality and delivery terms are also outside this comparison, so the figures alone cannot determine the preferred supplier. This highlights the commercial value of supplier emissions documentation. For producers whose actual emissions are below the applicable default value, supported by compliant verification, actual data may change a buyer's cost assessment. Buyers can use defaults for an initial budget when documentation is unavailable, then reassess using supplier evidence. Exporters consequently have a reason to prepare emissions information alongside their product offers, rather than negotiate solely around country-default differences. Annual parameter changes also warrant attention. Holding the Chinese product's base default value, route and benchmark constant, and assuming that the import year and applicable reporting year coincide, estimated certificate exposure rises from 1.912575 per tonne in 2026 to 2.248150 in 2027—an increase of approximately 17.5%. This reflects a higher default-value mark-up and a smaller free-allocation deduction; it does not imply a rise in future certificate prices. For supply arrangements spanning different years, companies can first compare certificate exposure, then discuss price-update mechanisms and cost sharing. Even while future certificate prices remain unknown, identifying that exposure and obtaining supplier documentation can improve the comparability of offers and procurement budgets.
Sep 29, 2026 17:32 (GMT+8)
[SMM Analysis] Low-Carbon of Primary Copper Begin Trading Separately—Will Recycled Copper’s Green Value Be Reassessed?
[SMM Analysis: Low-Carbon of Primary Copper Begin Trading Separately—Will Recycled Copper’s Green Value Be Reassessed?] BHP and Amazon’s EAC pilot separates verified emissions reductions from physical copper trade, giving low-emissions primary copper a new source of environmental value. Recycled copper retains a major energy advantage, but future competitiveness may depend more on traceability, recycled content and verified carbon data, potentially adding an environmental dimension to pricing.
Sep 29, 2026 16:03 (GMT+8)
Latest News
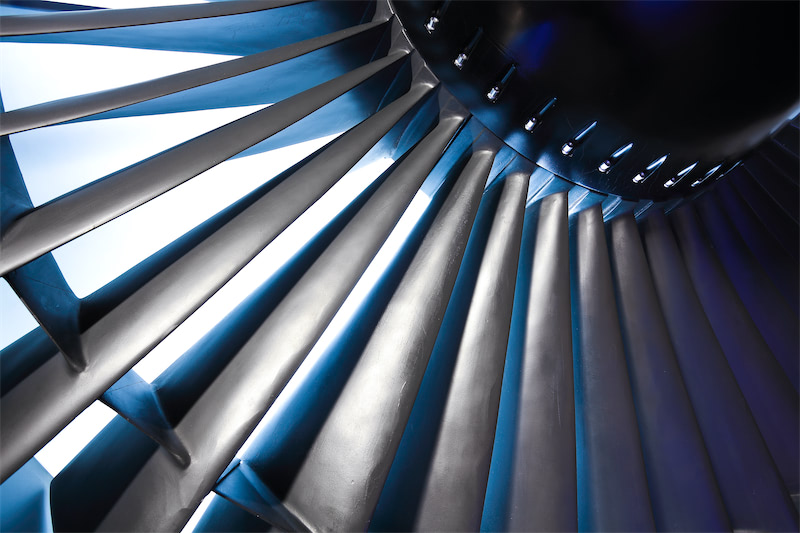
Aterian reports higher Rwanda 3T ore sales; trading margins remain estimates
Oct 02, 2026 16:26 (GMT+8)
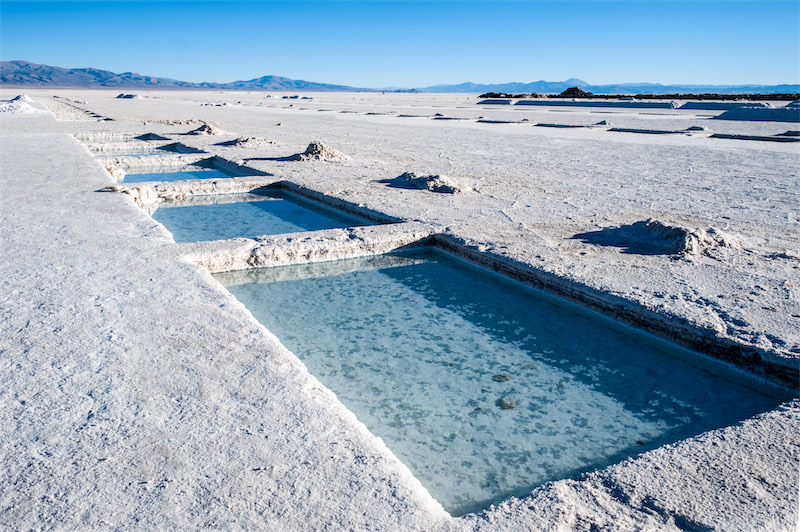
Tusker’s Malawi sampling points to ilmenite dominance
Oct 02, 2026 16:23 (GMT+8)

【Flash | Coherent’s PhotonLink Sets the Stage for a Commercial Indium Phosphide (InP) Ramp】
Oct 02, 2026 14:34 (GMT+8)
【Flash | Acerinox October 316L Surcharges Diverged Between Flat and Long Products】
Spanish stainless steel producer Acerinox set its October European flat-product surcharge for 316L (1.4404) at €3.972/kg, down €0.035/kg or 0.87% from September. Surcharges for higher-molybdenum grades also eased: 904L fell 1.21% to €7.004/kg, 317L declined 0.77% to €5.187/kg, and duplex 2205 slipped 0.15% to €3.994/kg. By contrast, 316L long-product surcharges rose to €4.323/kg for billet, €4.499/kg for wire rod, €4.715/kg for angle/hot-rolled bar, and €5.252/kg for wire/bright bar, up 0.75%-1.12% month on month. Alloy surcharges reflect multiple inputs, including nickel, chromium, molybdenum and energy, and should not be read as a pure molybdenum-price signal.
Oct 02, 2026 10:18 (GMT+8)
【Flash | Global Molybdenum Use Exceeded Production by 4,672 Tonnes in Q2 2026】
Global molybdenum production was 167.2 mlb (75,841 tonnes) in Q2 2026, down 3% YoY and 1% QoQ, while usage reached 177.5 mlb (80,513 tonnes), up 8% YoY but down 2% QoQ. The direct comparison leaves an apparent quarterly gap of 10.3 mlb (4,672 tonnes). China produced 79.5 mlb (36,061 tonnes), flat YoY and up 1% QoQ; South American output fell 9% YoY and 4% QoQ to 39.9 mlb (18,098 tonnes). China’s usage rose 10% YoY to 90.2 mlb (40,914 tonnes), while US usage increased 12% to 17.1 mlb (7,756 tonnes). The gap does not account for inventories or trade flows.
Oct 02, 2026 10:04 (GMT+8)
European APT Offers Drop to $2,700-3,100/mtu Amid Weak Demand and Lower Scrap Prices
[SMM Tungsten Express] European APT offer ranges shifted down to $2,700-3,100/mtu this week, retreating from previous levels. Some offers were heard at $2,700-2,750/mtu, with more low-priced quotes emerging, though actual transactions remained thin with no new spot deals concluded. Smelter long-term contract prices held above $3,000/mtu, with existing output largely pre-sold and limited spot availability. Scrap and ore prices fell in tandem, with buyers leaning bearish and a strong wait-and-see atmosphere. Some traders noted that as long as China cannot export feedstock, no new low-priced spot material will emerge, keeping the market in a stalemate. Overall, the APT offer center moved slightly lower, with near-term prices facing downward pressure amid weak demand and softer scrap and ore prices.
Oct 01, 2026 16:46 (GMT+8)
More than 6,500 Madagascar residents file QMM pollution claim
[SMM Titanium Flash] More than 6,500 people in Madagascar have filed a claim in London’s High Court against Rio Tinto over alleged contamination linked to its QIT Madagascar Minerals (QMM) ilmenite operation, Reuters reported on 30 September. The claimants, represented by Leigh Day, allege wastewater exposed communities to lead and uranium and seek compensation and remedial orders. Rio Tinto said it had been notified but had not received the claim documents. It said its water monitoring found uranium samples below detection limits and most lead samples below detection limits.
QMM produces ilmenite for the titanium dioxide supply chain. The case places water management and community relations at a major African mineral sands operation under renewed scrutiny. The allegations remain unproven, and the filing itself does not establish any change in QMM production.
Oct 01, 2026 16:36 (GMT+8)
【Flash | Outokumpu Trims October Surcharges for Several Moly-Bearing Stainless Grades】
Outokumpu’s October 2026 North American coil alloy surcharges edged lower across several molybdenum-bearing grades. The surcharge for 316L 2.5% Moly fell 0.5% MoM to $4,291.96/t, while 316L/4404 declined 0.7% to $3,886.31/t. Duplex 2205 was broadly flat at $4,225.83/t. Surcharges for 904L and 254 SMO fell 0.8% and 0.6% to $8,236.48/t and $8,914.62/t, respectively. These are alloy surcharges rather than full steel prices and reflect nickel, chromium and other alloy inputs as well as molybdenum.
Oct 01, 2026 16:31 (GMT+8)
Silicon‑Manganese Output Rises MoM in September: North Surges, South Mixed
In September, the overall domestic supply of silicon‑manganese alloy rose compared with August, with national output moving higher month‑on‑month. Nevertheless, operating rates across producing regions did not expand in lockstep. A pattern took shape featuring output growth in northern producing areas, mixed performance in southern regions, and general moderate output contraction in minor producing zones, further highlighting regional divergence in production.
Sep 30, 2026 20:21 (GMT+8)
[SMM Chromium Flash] A-3 Minerals Plans 8.6-Fold Expansion of Chrome Ore Beneficiation Unit in Odisha's Jajpur
A-3 Minerals & Metal Exports Private Limited is planning to expand the throughput capacity of its chrome ore beneficiation unit at Bayree village in Jajpur district, Odisha, from 18,500 tonnes per annum to 160,000 tonnes per annum, according to a project filing tracked by India Projects News. The proposed expansion, estimated at approximately Rs. 5 crore, is currently at the conceptual and planning stage and is under consideration for environmental approval.
Jajpur district sits within Odisha's Sukinda Valley belt, the region hosting the bulk of India's chromite reserves and the operational base for major domestic ferrochrome producers including Indian Metals & Ferro Alloys (IMFA). The filing did not disclose a project timeline, the specific beneficiation process to be used, or downstream customers for the additional processed ore, and no further detail on A-3 Minerals' existing operations or ownership structure was available in the source filing.
Sep 30, 2026 19:58 (GMT+8)

Silicon‑manganese futures: August rally gives way to September decline; market turns cautious after high‑level pullback.
Sep 30, 2026 19:36 (GMT+8)
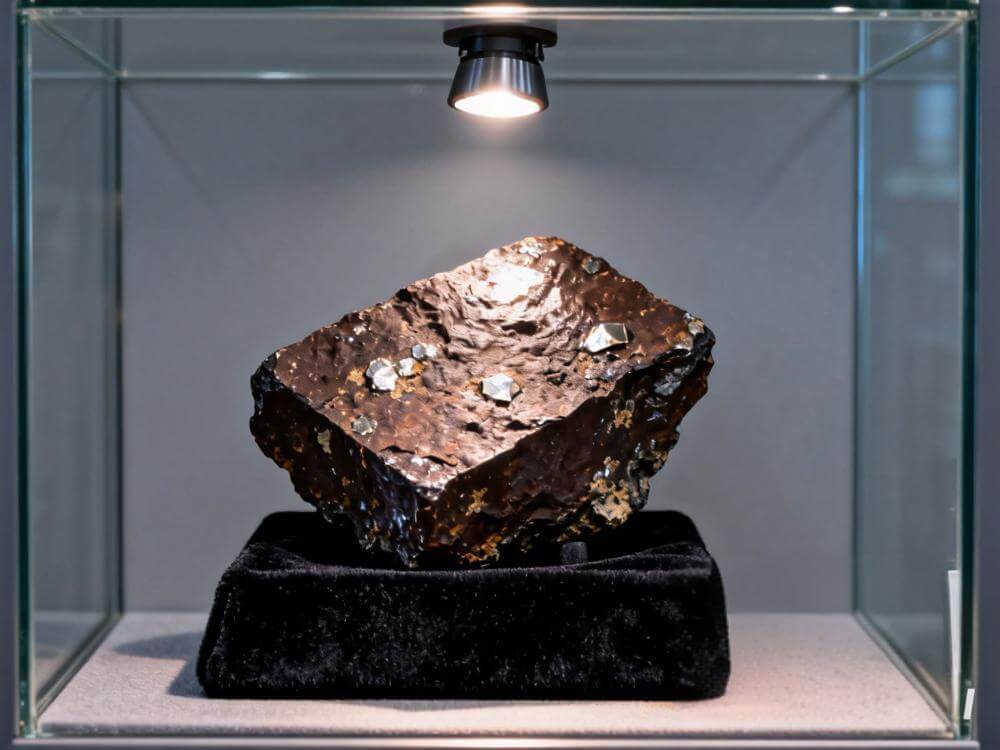
LB Group to Invest About 766 Million Yuan in Acquiring Australian Mineral Sands Project to Ensure Stable Titanium Concentrate Raw Material Supply
Sep 30, 2026 19:33 (GMT+8)
Dongfang Tantalum: Domestic demand in China for high-value-added products such as superalloys, semiconductor tantalum targets, and high-purity niobium materials is gradually rising.
Sep 30, 2026 18:57 (GMT+8)
September's Magnesium Market: From Surge to Slump, Producers Navigate Cost and Demand Challenges [SMM Analysis]
Entering September, the magnesium market embarked on a near roller-coaster ride. The first half and second half of the month presented a stark contrast — hot versus cold, optimism versus pessimism — as market sentiment underwent a rapid switch from euphoria to freezing point within just thirty days. At the start of the month, the surging coal prices ignited the market;
Sep 30, 2026 18:41 (GMT+8)
Spot supply tight; silicon metal prices stagnant and stabilizing ahead of the holiday [SMM Silicon Industry Weekly Review]
[Spot supply tight; silicon metal prices stabilize in stalemate ahead of holiday]: Spot silicon metal prices stabilized in stalemate this week. As of September 30, SMM oxygen-blown #553 silicon in east China was at 9,400-9,500 yuan/mt, flat WoW. In the futures market, the SI2611 contract moved sideways during the week. With only three trading days before the National Day holiday, it pulled back to around 8,470 yuan/mt on Monday before stabilizing, then rebounded amid accelerated inventory destocking and tight spot liquidity, closing at 8,565 yuan/mt on the last trading day before the holiday, up 35 yuan/mt from last Friday. In terms of market quotes and transactions, trading activity cooled this week as the National Day holiday approached. Silicon suppliers kept quotes basically stable, while downstream users picked up goods intensively before the holiday. Social inventory continued to decline, tightening low-priced supply in the market. Spot silicon metal liquidity was tight, and downstream users mainly stockpiled as needed before the holiday, with limited willingness to chase higher prices. The price center stabilized in stalemate.
Sep 30, 2026 18:40 (GMT+8)
Tug-of-war between sellers and buyers continues in the silicone market; overall new orders remain subdued ahead of the holiday [SMM Silicone Weekly Review]
[SMM Silicone Weekly Review: Tug-of-war between sellers and buyers persists in the silicone market, with overall new orders subdued ahead of the holiday] This week, China's silicone DMC market saw transactions edge lower, with an average price of 14,500 yuan/mt. During the week, after one monomer producer lowered its DMC offer to 14,500 yuan/mt, other monomer producers kept their existing offers unchanged, showing a strong willingness to hold prices firm ahead of the holiday, but there was virtually no trading at high prices. On the raw material side, 421# silicon metal (for silicone use) in east China remained firm, and methanol prices were firm this week, providing some support for silicone DMC prices. Overall, the silicone market remained locked in a tug-of-war between sellers and buyers this week, with monomer producers showing a strong willingness to hold prices firm ahead of the holiday, while demand was mainly need-based restocking, and actual transactions before the holiday were weak. In the short term, silicone prices will remain in the doldrums, with attention to be paid to the direction of the monomer producers' industry meeting in early October and the pace of downstream restocking after the holiday.
Sep 30, 2026 18:08 (GMT+8)
【SMM Analysis】Ferrochrome Output Slides Further in September, Cost Inversion Casts Gloomy Outlook
Sep 30, 2026 17:38 (GMT+8)
First Rise Then Fall, Breaking Below the Year's Low: The Real Logic Behind Magnesium Plants' "Stop-Start" Operations [SMM Analysis]
[SMM Magnesium Market Analysis: Prices Rose Before Falling Below the Year's Low, the Real Logic Behind Magnesium Plants' "On-and-Off" Operations] The first and second halves of the month presented contrasting patterns, one hot and one cold, one joyful and one sorrowful, with market sentiment rapidly shifting from euphoria to a freezing point in just thirty days. At the start of the month, coal prices shot up, igniting the market, as cost support combined with speculative capital inflows drove magnesium prices sharply higher, briefly suggesting that a new upward cycle had begun. However, the heavy drag from fundamentals soon emerged, and the rally, lacking support from real demand, proved unsustainable. Magnesium prices then drifted lower, ultimately falling below the year's low, with 9990 primary magnesium ingot prices dipping to 156,500 yuan/mt. The monthly trend rose before falling, creating a stark contrast.
Sep 30, 2026 17:28 (GMT+8)
Amigo signs $33m agreement for South Africa’s Kamiesberg mineral sands project
[SMM Titanium Flash] Amigo Resources said on 28 September that its subsidiary signed a share purchase agreement to acquire the Kamiesberg mineral sands project in South Africa’s Northern Cape through two holding companies. The proposed price is US$33 million, subject to working-capital and debt adjustments. Kamiesberg has a reported JORC mineral resource of 2.71 billion tonnes and contains ilmenite, a titanium dioxide feedstock, alongside rutile, zircon and monazite. The company estimates eventual output of about 505,000 tonnes a year of sulphate ilmenite under its current mine plan.
This is a signed agreement, not a completed acquisition or producing mine. Closing depends on shareholder and regulatory approvals, including South African ministerial consent for a change of control, and Amigo still intends to raise development funding. Its proposed first processing module would cost about US$15 million and be commissioned within six months of completion; both timing and output are company targets. The deal could add a large South African titanium feedstock project to Amigo’s African portfolio if the conditions and funding are met.
Sep 30, 2026 17:15 (GMT+8)
September Peak Season Falls Short of Expectations, Titanium Industry Chain Runs Weak with Divergence [SMM Analysis]
In September, China's titanium industry chain was under pressure overall. For titanium dioxide, industry production rebounded somewhat, and factory inventory saw some destocking, but prices remained flat, lacking upward momentum. Subcategories diverged: chloride-process titanium dioxide prices pulled back 0.62% MoM, while quotes for other titanium dioxide varieties were basically flat. On the titanium sponge side, enterprise production continued to rise MoM, market prices were in the doldrums, and downstream buyers only maintained rigid procurement without active restocking. Overall, the industry's inherent supply-demand imbalance has not eased. The traditional "September peak season" fell short of earlier market expectations, and market participants remained cautious. On balance, the titanium industry chain is expected to remain in the doldrums in the short term.
Sep 30, 2026 17:14 (GMT+8)
![[SMM Announcement] Chinese Market Metal Prices and News Updates Suspended during National Day Holiday (Oct 1-7)](https://imgqn.smm.cn/usercenter/HeIuV20251217171708.jpg)
[SMM Announcement] Chinese Market Metal Prices and News Updates Suspended during National Day Holiday (Oct 1-7)
Dear Valued SMM Users, The National Day holiday is approaching. Please note that SMM Chinese market metal price assessments and news updates will be temporarily suspended during the holiday (October 1-7) and resume normal release after the break. However, SMM overseas price assessment will continue to be updated as usual throughout the holiday. We apologise for any inconvenience caused and wish you a pleasant holiday. Shanghai Metals Market (SMM)
Sep 28, 2026 17:06 (GMT+8)

Huawei Pursues Africa Green‑Mining Partnerships and Holds Business Talks with ZESCO at SMM ACM 2026
Sep 23, 2026 16:41 (GMT+8)
![[SMM Analysis] The U.S. Copper Tariff Trade Is Fading — but It Isn’t Over Yet](https://imgqn.smm.cn/production/admin/votes/imagesMbCUq20260929144044.png)
[SMM Analysis] The U.S. Copper Tariff Trade Is Fading — but It Isn’t Over Yet
Sep 29, 2026 14:37 (GMT+8)
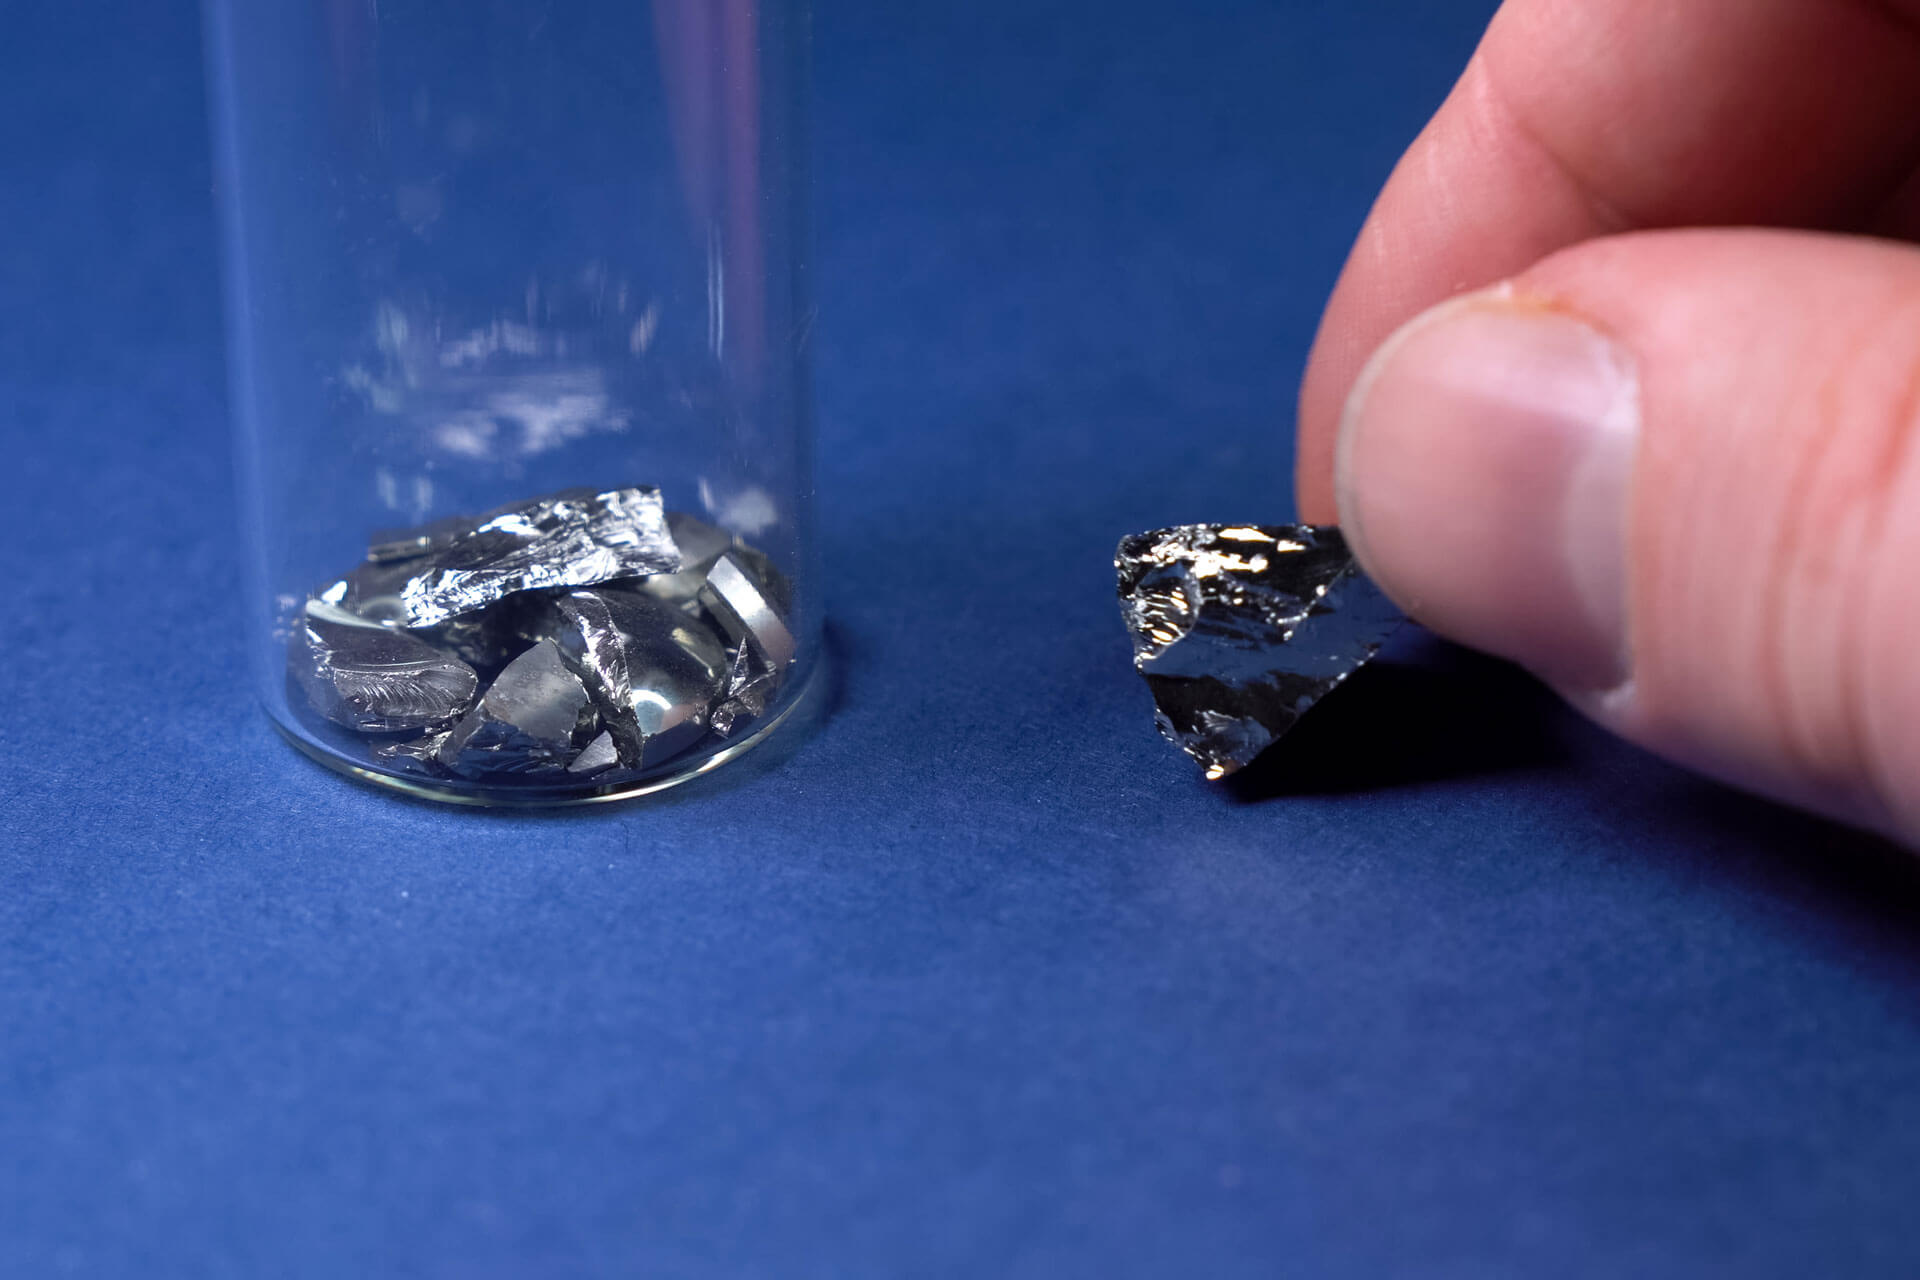
South Africa Poised to Become Key Player in Global Rare Earth Supply Chain by 2034【SMM Analysis】
Sep 29, 2026 18:54 (GMT+8)
[SMM Analysis] India’s BESS Manufacturing Push Accelerates, but Cell Dependence Remains a Key Bottleneck
Sep 30, 2026 08:50 (GMT+8)
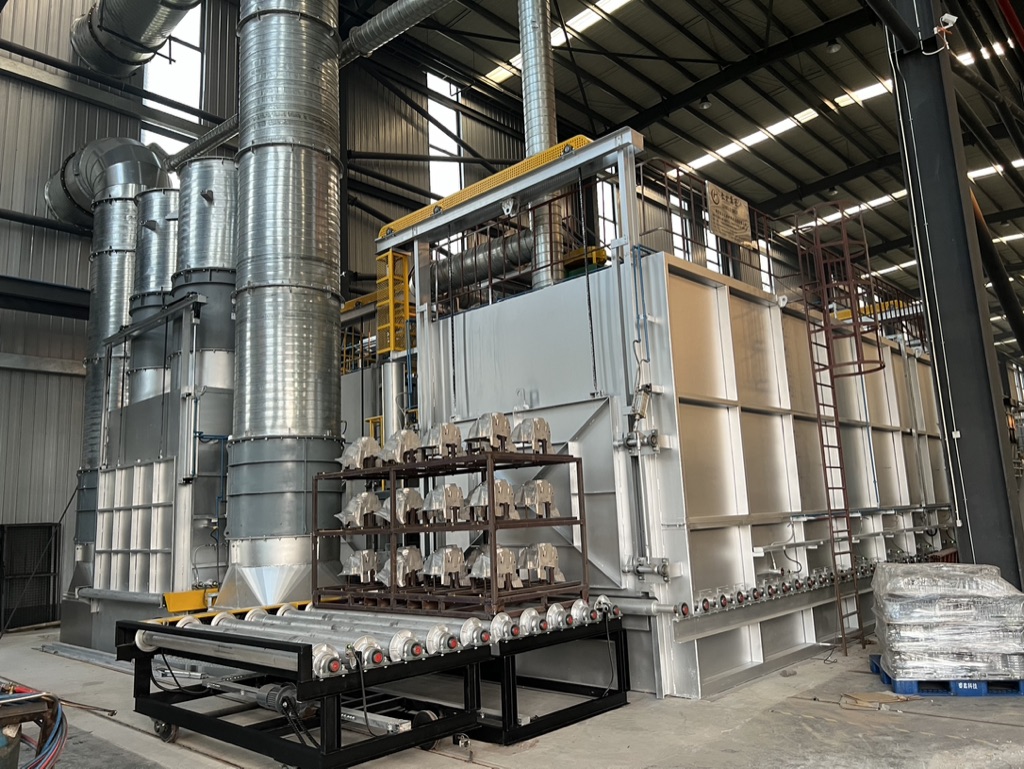
SMM Launches Aluminium CBAM Calculator: What Cost Estimates Mean for EU-Bound Offers【SMM Analysis】
Sep 29, 2026 17:32 (GMT+8)
![[SMM Analysis] Low-Carbon of Primary Copper Begin Trading Separately—Will Recycled Copper’s Green Value Be Reassessed?](https://imgqn.smm.cn/usercenter/MXbup20251217171745.jpg)
[SMM Analysis] Low-Carbon of Primary Copper Begin Trading Separately—Will Recycled Copper’s Green Value Be Reassessed?
Sep 29, 2026 16:03 (GMT+8)
Latest News
Aterian reports higher Rwanda 3T ore sales; trading margins remain estimates
Oct 02, 2026 16:26 (GMT+8)
Tusker’s Malawi sampling points to ilmenite dominance
Oct 02, 2026 16:23 (GMT+8)
【Flash | Coherent’s PhotonLink Sets the Stage for a Commercial Indium Phosphide (InP) Ramp】
Oct 02, 2026 14:34 (GMT+8)
【Flash | Acerinox October 316L Surcharges Diverged Between Flat and Long Products】
Oct 02, 2026 10:18 (GMT+8)
【Flash | Global Molybdenum Use Exceeded Production by 4,672 Tonnes in Q2 2026】
Oct 02, 2026 10:04 (GMT+8)
European APT Offers Drop to $2,700-3,100/mtu Amid Weak Demand and Lower Scrap Prices
Oct 01, 2026 16:46 (GMT+8)
More than 6,500 Madagascar residents file QMM pollution claim
Oct 01, 2026 16:36 (GMT+8)
【Flash | Outokumpu Trims October Surcharges for Several Moly-Bearing Stainless Grades】
Oct 01, 2026 16:31 (GMT+8)
Silicon‑Manganese Output Rises MoM in September: North Surges, South Mixed
Sep 30, 2026 20:21 (GMT+8)
[SMM Chromium Flash] A-3 Minerals Plans 8.6-Fold Expansion of Chrome Ore Beneficiation Unit in Odisha's Jajpur
Sep 30, 2026 19:58 (GMT+8)
Silicon‑manganese futures: August rally gives way to September decline; market turns cautious after high‑level pullback.
Sep 30, 2026 19:36 (GMT+8)
LB Group to Invest About 766 Million Yuan in Acquiring Australian Mineral Sands Project to Ensure Stable Titanium Concentrate Raw Material Supply
Sep 30, 2026 19:33 (GMT+8)
Dongfang Tantalum: Domestic demand in China for high-value-added products such as superalloys, semiconductor tantalum targets, and high-purity niobium materials is gradually rising.
Sep 30, 2026 18:57 (GMT+8)
September's Magnesium Market: From Surge to Slump, Producers Navigate Cost and Demand Challenges [SMM Analysis]
Sep 30, 2026 18:41 (GMT+8)
Spot supply tight; silicon metal prices stagnant and stabilizing ahead of the holiday [SMM Silicon Industry Weekly Review]
Sep 30, 2026 18:40 (GMT+8)
Tug-of-war between sellers and buyers continues in the silicone market; overall new orders remain subdued ahead of the holiday [SMM Silicone Weekly Review]
Sep 30, 2026 18:08 (GMT+8)
【SMM Analysis】Ferrochrome Output Slides Further in September, Cost Inversion Casts Gloomy Outlook
Sep 30, 2026 17:38 (GMT+8)
First Rise Then Fall, Breaking Below the Year's Low: The Real Logic Behind Magnesium Plants' "Stop-Start" Operations [SMM Analysis]
Sep 30, 2026 17:28 (GMT+8)
Amigo signs $33m agreement for South Africa’s Kamiesberg mineral sands project
Sep 30, 2026 17:15 (GMT+8)
September Peak Season Falls Short of Expectations, Titanium Industry Chain Runs Weak with Divergence [SMM Analysis]
Sep 30, 2026 17:14 (GMT+8)