

News
Exclusive analysis articles with the latest market updates, and real-time news feeds.
China’s Spodumene Imports Rise 7% MoM in September, with Australia, Nigeria and Zimbabwe the Top Three Sources
According to compiled Chinese customs data, China imported 970,100 physical tonnes of spodumene in September 2026, up approximately 7.0% from 906,600 tonnes in August. Based on the classification and assumed grades, moisture content and conversion factors used in this analysis, September imports represented approximately 81,300 tonnes of lithium carbonate equivalent (LCE). By origin, imports from Australia, Nigeria and Zimbabwe increased significantly. Australia remained the largest supplier, with shipments to China reaching 446,200 tonnes, up approximately 36.7% month on month and accounting for around 46.0% of total imports. Nigeria became the second-largest supplier at 189,800 tonnes, up approximately 40.1%, while imports from Zimbabwe rose approximately 83.0% to 136,500 tonnes. Imports from South Africa fell approximately 49.6% to 112,400 tonnes, whereas imports from Brazil increased approximately 30.9% to 81,200 tonnes. Smaller volumes came from Burundi, Rwanda and Mozambique, at approximately 1,800 tonnes, 1,300 tonnes and 1,000 tonnes, respectively, with limited shipments from Zambia and Somalia. No imports from Mali or Canada appeared in the September dataset. Overall, China’s spodumene imports continued to grow in September, with the composition shifting toward concentrate. Under the classification used in this analysis, concentrate imports reached approximately 688,800 tonnes, accounting for 71.0% of total physical imports, compared with 60.7% in August. Raw ore imports stood at approximately 281,300 tonnes. Increased concentrate imports from Australia, Zimbabwe and Nigeria offset lower imports from Mali and Canada, providing the main support for growth in China’s imported lithium resource supply during the month.
Oct 20, 2026 19:03 (GMT+8)
[SMM Analysis] Hoa Phat’s record HRC sales reshape Vietnam’s self-sufficiency and China’s export flows
Hoa Phat sold 5.47 Mt of hot-rolled coil in January to September, up 59% and about a third of Vietnam’s consumption, with 24.6% of third-quarter sales exported. Vietnam’s HRC demand of about 17.3 Mt this year still exceeds local output of about 10.8 Mt by 6.5 Mt, and new capacity arrives mainly after 2027. Anti-dumping duties have pushed mainstream Chinese coil out of Vietnam; Chinese mills now face Vietnamese coil in ASEAN and other third markets.
Oct 20, 2026 14:36 (GMT+8)
China's Rare Earth Magnet Exports Hit Record in September, Driven by Backlog Release and Regulatory Easing【SMM Analysis】
China’s September rare earth magnet exports hit a record 6,165 tonnes (+23% MoM), driven by clearance of July–August port backlogs, not new demand. US-China talks unblocked shipments, while EU “green channel” talks lifted Q4 forecast to ~5,700 tonnes/month. Large producers recovered fastest; small mills remain constrained.
Oct 20, 2026 16:06 (GMT+8)
Latest News
【SMM Analysis】Chromium Market Weakens Further as Steel Tender Falls in Line with Expectations
21 hours ago
Tianqi Lithium Achieves Breakthrough in Tantalum-Niobium Recovery from Lithium Slag, Completes First Delivery
Oct 23, 2026 17:04 (GMT+8)
【Flash | Canada’s Davidson Project Targets 6,020 t/y of Molybdenum as Estimated Cost Drops to $4.36/lb Mo】
Oct 23, 2026 14:23 (GMT+8)
ADC12 aluminum prices consolidate wildly during the day, with limited room for spot aluminum to move up or down [ADC12 Price Daily Commentary]
[ADC12 Price Daily Review: Secondary aluminum wild swings intraday, spot upside and downside limited] The ADC12 market overall continued to hold steady with a wait-and-see stance today, with market quotes showing no significant adjustments. SMM ADC12 market quote remained stable from the previous day at 24,500 yuan/mt. Futures movement showed heightened volatility today, and enterprises generally turned cautious in adjusting prices.
Oct 23, 2026 13:24 (GMT+8)
Weakening cost support for silicone; DMC prices slightly lowered [SMM Silicone Weekly Review]
[SMM Silicone Weekly Review: Cost Support for Silicone Weakens, DMC Prices Edge Down] This week, overall silicone costs pulled back, and the industry's comprehensive production costs declined accordingly. As of October 22, the average price of #421 silicon metal for silicone use in east China stood at 9,750 yuan/mt, remaining largely stable; the mainstream transaction price of #421 silicon in east China averaged 9,550 yuan/mt, down 0.52% WoW, with silicon metal prices trending downward this week. Meanwhile, methanol market prices pulled back, dragging methyl chloride costs lower in tandem. This week, the average market price of methyl chloride was 3,450 yuan/mt, down 6.76% WoW.
Oct 22, 2026 16:22 (GMT+8)
【Flash | South Korea’s Molybdenum Flows Diverge as Concentrate Imports Fall 26%】
South Korea imported 2,707.3 tonnes of roasted and other molybdenum concentrates in September 2026, down 25.9% YoY, SMM calculations based on customs data show. Roasted concentrate imports fell 28.8% to 1,740.0 tonnes, including 500.0 tonnes from Chile versus 1,410.7 tonnes a year earlier. Roasted concentrate exports rose 6.5% to 516.6 tonnes, mainly to Japan, India and Vietnam. Ferromolybdenum exports fell 29.2% to 1,121.1 tonnes, with shipments to China dropping from 580.0 to 70.5 tonnes. Imports of molybdenum oxides and hydroxides rose 311.0% MoM to 97.2 tonnes, although January–September volumes were down 39.2% YoY. National customs flows cannot measure Busan port throughput or warehouse spot stocks.
Oct 22, 2026 16:02 (GMT+8)
PV Upstream Multi-Segment Stalemate Holds Steady, Module Prices Continue to Decline [SMM Weekly Review]
[SMM Weekly Review: PV Upstream Segments Hold Steady in Stalemate, Module Prices Continue to Slide] This week, solar cell market prices remained stable overall, with quotes across all sizes unchanged WoW. Supply stayed at low levels and inventory continued to draw down. The market maintained a balance between cost support and demand divergence, with the tug-of-war between upstream and downstream persisting. Prices are expected to remain stable in the short term. In terms of pricing, all sizes held steady. The 183 price range remained at 0.29-0.301 Yuan/W. The 210R price range held at 0.305-0.314 Yuan/W, still dominated by exports to ex-China markets. The export window is expected to extend into early November, with supply prioritized for export orders. Available domestic supply is limited, leaving no basis for price adjustments. The 210N price range held at 0.295-0.3 Yuan/W, stabilizing after last week's raise. Although wafer producers intend to hold prices firm, the recent continued decline in silver prices has offset cost-side support, limiting upward momentum for prices. At this stage, downstream buyers are restocking at a need-based pace, with actual order negotiations locked in a stable tug-of-war. In the short term, the upstream-downstream stalemate may persist until early November, and prices across all sizes are expected to remain stable or move sideways.
Oct 22, 2026 15:31 (GMT+8)
【Flash | Hudbay and Mitsubishi Approve Copper World; Molybdenum Plant Planned for First Operating Year】
Hudbay Minerals Inc. and Mitsubishi Corporation approved the final investment decision for Arizona’s Copper World project. The planned concentrator would produce copper and molybdenum concentrates, with a $25 million molybdenum processing plant scheduled for the first year of operations. The project targets first production in the second half of 2029. These are figures for the entire project, owned 70% by Hudbay and 30% by Mitsubishi. The decision advances a potential future United States molybdenum source; it does not add to current supply.
Oct 22, 2026 11:55 (GMT+8)
ADC12 aluminum alloy futures open high, under pressure; spot cargo mainly wait-and-see [ADC12 Price Daily Review]
[ADC12 Price Daily Review: Aluminum Alloy Futures Open High Under Pressure, Spot Cargo Wait-and-See Dominates] The ADC12 market overall continued its stable wait-and-see trend today, with SMM ADC12 market quotes holding steady at 24,500 yuan/mt from the previous day.
Oct 22, 2026 11:49 (GMT+8)
[SMM Chromium Week Review] Chrome Ore Shipments Fall 40.78% WoW as China's Port Stocks Decline
Published: Oct 21, 2026.
Oct 21, 2026 22:43 (GMT+8)
![[SMM Chromium Flash] Outokumpu Unveils Low-CO₂ Technology to Produce Enriched Ferrochrome and Chromium Metal](https://imgqn.smm.cn/usercenter/HGHao20251217171725.jpg)
[SMM Chromium Flash] Outokumpu Unveils Low-CO₂ Technology to Produce Enriched Ferrochrome and Chromium Metal
Oct 21, 2026 21:35 (GMT+8)
![[SMM Chromium Flash] South Africa’s 62c/kWh Power Tariff Clears Path for Two Ferrochrome Smelter Restarts](https://imgqn.smm.cn/usercenter/QmrGh20251217171725.jpg)
[SMM Chromium Flash] South Africa’s 62c/kWh Power Tariff Clears Path for Two Ferrochrome Smelter Restarts
Oct 21, 2026 21:32 (GMT+8)
![Short-Term Support Finally Breached! The International Molybdenum Oxide Market Now in Free Fall?! [SMM Analysis]](https://imgqn.smm.cn/usercenter/eGQFu20251217171723.jpeg)
Short-Term Support Finally Breached! The International Molybdenum Oxide Market Now in Free Fall?! [SMM Analysis]
Oct 21, 2026 19:14 (GMT+8)
Apple commits up to US$100 million to US titanium supplier
[SMM Titanium Flash] Apple announced that it would commit up to US$100 million over three years to Pennsylvania-based Perryman Company for titanium used in its products, including iPhone Duo. Apple said Perryman melts, forges and rolls titanium for that product with a minimum of 80% recycled content at its Houston, Pennsylvania, site. The amount is a forward commitment, not spending already completed.
The agreement identifies demand for processed titanium with substantial recycled content. It does not disclose a volume of titanium to be bought or establish demand for African titanium ore.
Oct 21, 2026 18:16 (GMT+8)
Short-term support officially declared lost! International molybdenum oxide plunges into a crash?! [SMM Analysis]
The $33/lb Mo level, once seen as a short-term support by the market, was finally broken on October 21. Inquiries in the afternoon session pushed further down to $32.7–32.8/lb Mo, and there were market reports of a deal at $32.75/lb Mo, though this has yet to be verified. Ex-China supply has not tightened significantly, while Asian demand has still failed to pick up in volume. In addition, the raw material cost that buyers can bear has continued to decline. With annual long-term contract negotiations approaching, whether the high $32 level can attract buying again remains to be seen...
Oct 21, 2026 18:05 (GMT+8)
ADC12 aluminum alloy spot prices hold steady; market continues range-bound consolidation [ADC12 Price Daily Commentary]
[ADC12 Price Daily Review: Aluminum Alloy Spot Prices Hold Steady, Market Continues Range-Bound Consolidation] The ADC12 market was largely stable and wait-and-see today, with SMM ADC12 market quotes holding steady at 24,500 yuan/mt from the previous day. Although aluminum prices rebounded somewhat, the recovery was limited, and bullish sentiment in the market has yet to recover significantly, leaving enterprises with insufficient motivation to increase their quotes.
Oct 21, 2026 13:14 (GMT+8)
【Flash | Peru’s Molybdenum Output Falls in August as Major Mines Diverge】
Preliminary figures released by Peru’s Ministry of Energy and Mines show that contained-molybdenum production fell 10.4% from July to 3,233.3 tonnes in August 2026, although it rose 12.5% year on year. Sociedad Minera Cerro Verde produced 698.7 tonnes, about 313.5 tonnes less than in July. Anglo American Quellaveco produced 497.2 tonnes, up 8.5% from July and 38.8% year on year. Peru’s January-August total was 25,617.3 tonnes, down 0.2% year on year. Company figures represent full-mine contained-metal production, not shareholders’ attributable output or molybdenum concentrate product mass.
Oct 21, 2026 09:34 (GMT+8)
[SMM Analysis] Mapping Africa’s Tantalum and Niobium Supply: Operating Mines and Projects in Development
Africa supplied an estimated 2,133 tonnes of mined tantalum in 2025, about 85% of the global total. The DRC, Rwanda and Nigeria dominated output, though mine-level reporting remains uneven. Coltan concentrate, contained metal and future oxide targets measure different things. Projects in Malawi, Tanzania, Kenya, Gabon and Côte d’Ivoire could diversify supply, but funding, processing, site access and traceability will determine when they produce.
Oct 20, 2026 23:59 (GMT+8)
[SMM Chromium Flash] Tharisa and Valterra Explore Fine Chrome Recovery to Improve Resource Utilization
Tharisa and Valterra Platinum are collaborating to explore opportunities for fine chrome recovery and beneficiation at Valterra’s operations, using Tharisa’s proprietary Vulcan X technology. According to Tharisa’s announcement on 15 October, the pilot plant has been completed and testing is underway. The collaboration aims to improve the recovery of fine chromite from processing streams and unlock additional value from material that may otherwise be difficult to recover economically.
The initiative forms part of a broader commercial partnership between the two companies. Under a separate multi-year agreement effective 1 January 2027, Valterra will purchase 50% of the platinum group metal concentrate produced at Tharisa Mine, replacing Sibanye-Stillwater as the offtake partner for that portion, while Northam Platinum will continue purchasing the remaining 50%. No commercial chrome recovery volume or production start date has yet been announced for the Valterra collaboration.
Oct 20, 2026 22:18 (GMT+8)
[SMM Chromium Flash] Tharisa Begins Renewable Power Supply, Targeting 70% of Mine’s Electricity Demand
Tharisa Minerals received its first wheeled renewable electricity from Etana Energy in September 2026, with the initial wind-energy supply expected to cover approximately 10% of the Tharisa Mine’s current monthly electricity demand. The electricity is generated by an early wind-energy tranche in Mpumalanga and delivered through the grid, marking the start of supply under the company’s renewable energy programme.
Under a long-term power purchase agreement signed in July 2024, Etana Energy is forecast to supply approximately 70% of Tharisa Minerals’ current electricity demand from its broader generation portfolio. Wheeled solar supply is expected to begin in the first quarter of 2027, followed by additional wind energy later in the year. The arrangement is intended to reduce electricity costs and Scope 2 emissions, supporting Tharisa’s target of cutting carbon emissions by 30% by 2030.
Oct 20, 2026 22:16 (GMT+8)
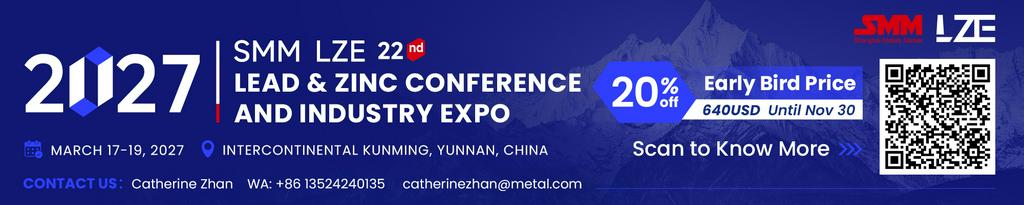
Early Bird Bookings Now Open for 2027 SMM LZE (22nd) Lead & Zinc Conference and Industry Expo in Yunnan next March
——From Conference to Expo · Doubled Scale · Full Upgrade—— [What This Article Brings You] ① Exhibition Introduction ② How to Register ③ First Batch of Exhibitors ④ Conference Agenda I. Doubled Scale, Full Upgrade! In 2026, lead and zinc face sharp volatility—elevated lead prices, scarce high-purity lead, record high LME low-grade lead stocks, lead-acid battery relocation from China to overseas, deeply negative zinc concentrate TCs, tight high-quality imported zinc ore, open export window for zinc ingots, and overseas zinc smelter buildout. The LZE covers market outlook, price forecast, equipment technology, recycling, and downstream applications—driving green transformation and win-win growth. What sets the 2027 (22nd) LZE apart from earlier events is its transformative upgrade: moving from a pure industry conference to a seamlessly combined conference and industry expo — deliver a larger-scale gathering, an expanded industry showcase and far-reaching involvement across the entire lead and zinc value chain. From industry trend analysis to in-depth industry chain exchanges, from upstream and downstream supply-demand matching to concentrated enterprise showcases, from a single industry conference to the further integration of "conference + industry expo"——in 2027, SMM LZE enters the "expo" era! The conference will embrace its 22nd edition with a larger scale, a richer industry lineup, and broader upstream and downstream participation! Scan the QR Code Below to Register as A Visitor for Free 1. Conference Scale Delegation: 6,000+ (up 71.4% from the previous edition) Companies: 2,000+ (up 100% from the previous edition) Exhibitors: 120+ (up 50% from the previous edition) Supply-demand matchmaking: 300+ (up 50% from the previous edition) Dedicated Forums: 7 (1 more than the previous edition) 2. Participant Groups 20% - Miners 23% - Smelters 22% - Processing enterprises 10% - Traders 5% - Lead-zinc end-user procurement 15% - Third-party equipment, technology, auxiliary materials, media, etc. 3% - Government, associations, university research institutions 2% - Financial and futures firms 3. Job Title Breakdown 4. Conference Highlights Price trends, consumption outlook, and policy interpretation Global dialogue on the lead-zinc industry and go-global strategies One-on-One Business Meetings Exploring Breakthrough Paths in Mining & Metallurgy Technology and Resource Recycling Showcase of Cutting-Edge Equipment and Consumables II. Four Identities, One Lead-Zinc Exhibition Whether you are here for market insights, procurement, showcasing or brand exposure, you will find a participation option that suits you. 1. Professional Visitors (Explore the exhibition for business opportunities and connect with the upstream and downstream of the industry) [Visitor Benefits] Exhibition Area Ticket On-site Check-in Gifts SMM Exclusive Lead-Zinc Industry Distribution Map Lead-Zinc Industry Visitor Exchange Group Group Benefits Tickets for Some Forums …… 2. Conference Delegates (Gain insights into new trends and discuss the lead-zinc market) [Delegate Benefits] Exhibition Area Ticket On-site Check-in Gifts SMM Exclusive Lead-Zinc Industry Distribution Map Lead-Zinc Industry Visitor & Conference Exchange Group Ticket for All Forums of the Conference Executive Dinner Voucher Lunch and Dinner Vouchers During the Conference Enterprise Directory Expert Reports 1-on-1 Supply-Demand Matching Post-Conference Field Trip Activities …… 3. Exhibitor (Step onto the industry stage and showcase your strengths) [18㎡ Custom Booth] [Benefits] Design & construction of all materials for the 18㎡ booth, tables, chairs, sofa & reception desk, TV, 5 conference passes, X-banner stand*1, conference booklet color page*1, LOGO display, multi-platform online exposure and promotion, supply-demand 1-on-1 matchmaking, long-term cooperation support from SMM, etc. [9㎡ Premium Booth] [Benefits] Design & construction of all materials for the 9㎡ booth, printed backdrop wall & reception desk & tables and chairs, TV, 3 conference passes, X-banner stand*1 or conference booklet color page*1, LOGO display, multi-platform online exposure and promotion, supply-demand 1-on-1 matchmaking, long-term cooperation support from SMM, etc. [6㎡ Standard Booth] [Benefits] Design & construction of all materials for the 6㎡ booth, one long table & two chairs, 2 X-banner stands with different content, 2 conference passes, multi-platform online exposure and promotion, supply-demand 1-on-1 matchmaking, long-term cooperation support from SMM, etc.
Oct 22, 2026 09:59 (GMT+8)

2027 Global Aluminum Supply-Demand Outlook: High Margins Drive Expansion, Shifting the Market from Tight to Loose
Oct 21, 2026 09:41 (GMT+8)

Chinese $6Billion Battery Investment in Morocco Reshapes EU Lithium Demand Amid Tariff Shifts
Oct 20, 2026 17:02 (GMT+8)
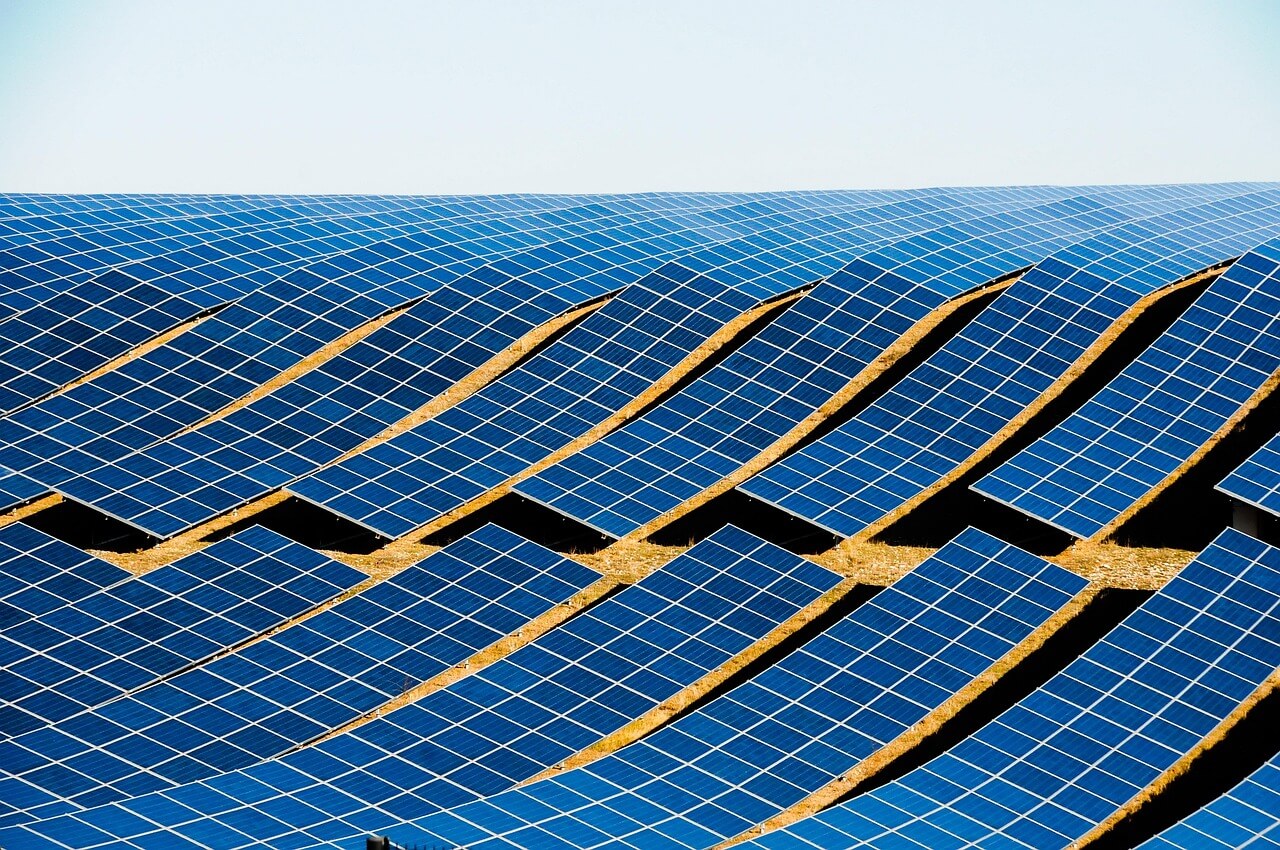
N-Type vs. P-Type Solar PV Modules: What Sets Them Apart, and Why Is N-Type Gaining Ground in the Global Market?
Oct 21, 2026 09:45 (GMT+8)
China’s Spodumene Imports Rise 7% MoM in September, with Australia, Nigeria and Zimbabwe the Top Three Sources
Oct 20, 2026 19:03 (GMT+8)
![[SMM Analysis] Hoa Phat’s record HRC sales reshape Vietnam’s self-sufficiency and China’s export flows](https://imgqn.smm.cn/usercenter/MhPNV20251217171716.jpg)
[SMM Analysis] Hoa Phat’s record HRC sales reshape Vietnam’s self-sufficiency and China’s export flows
Oct 20, 2026 14:36 (GMT+8)
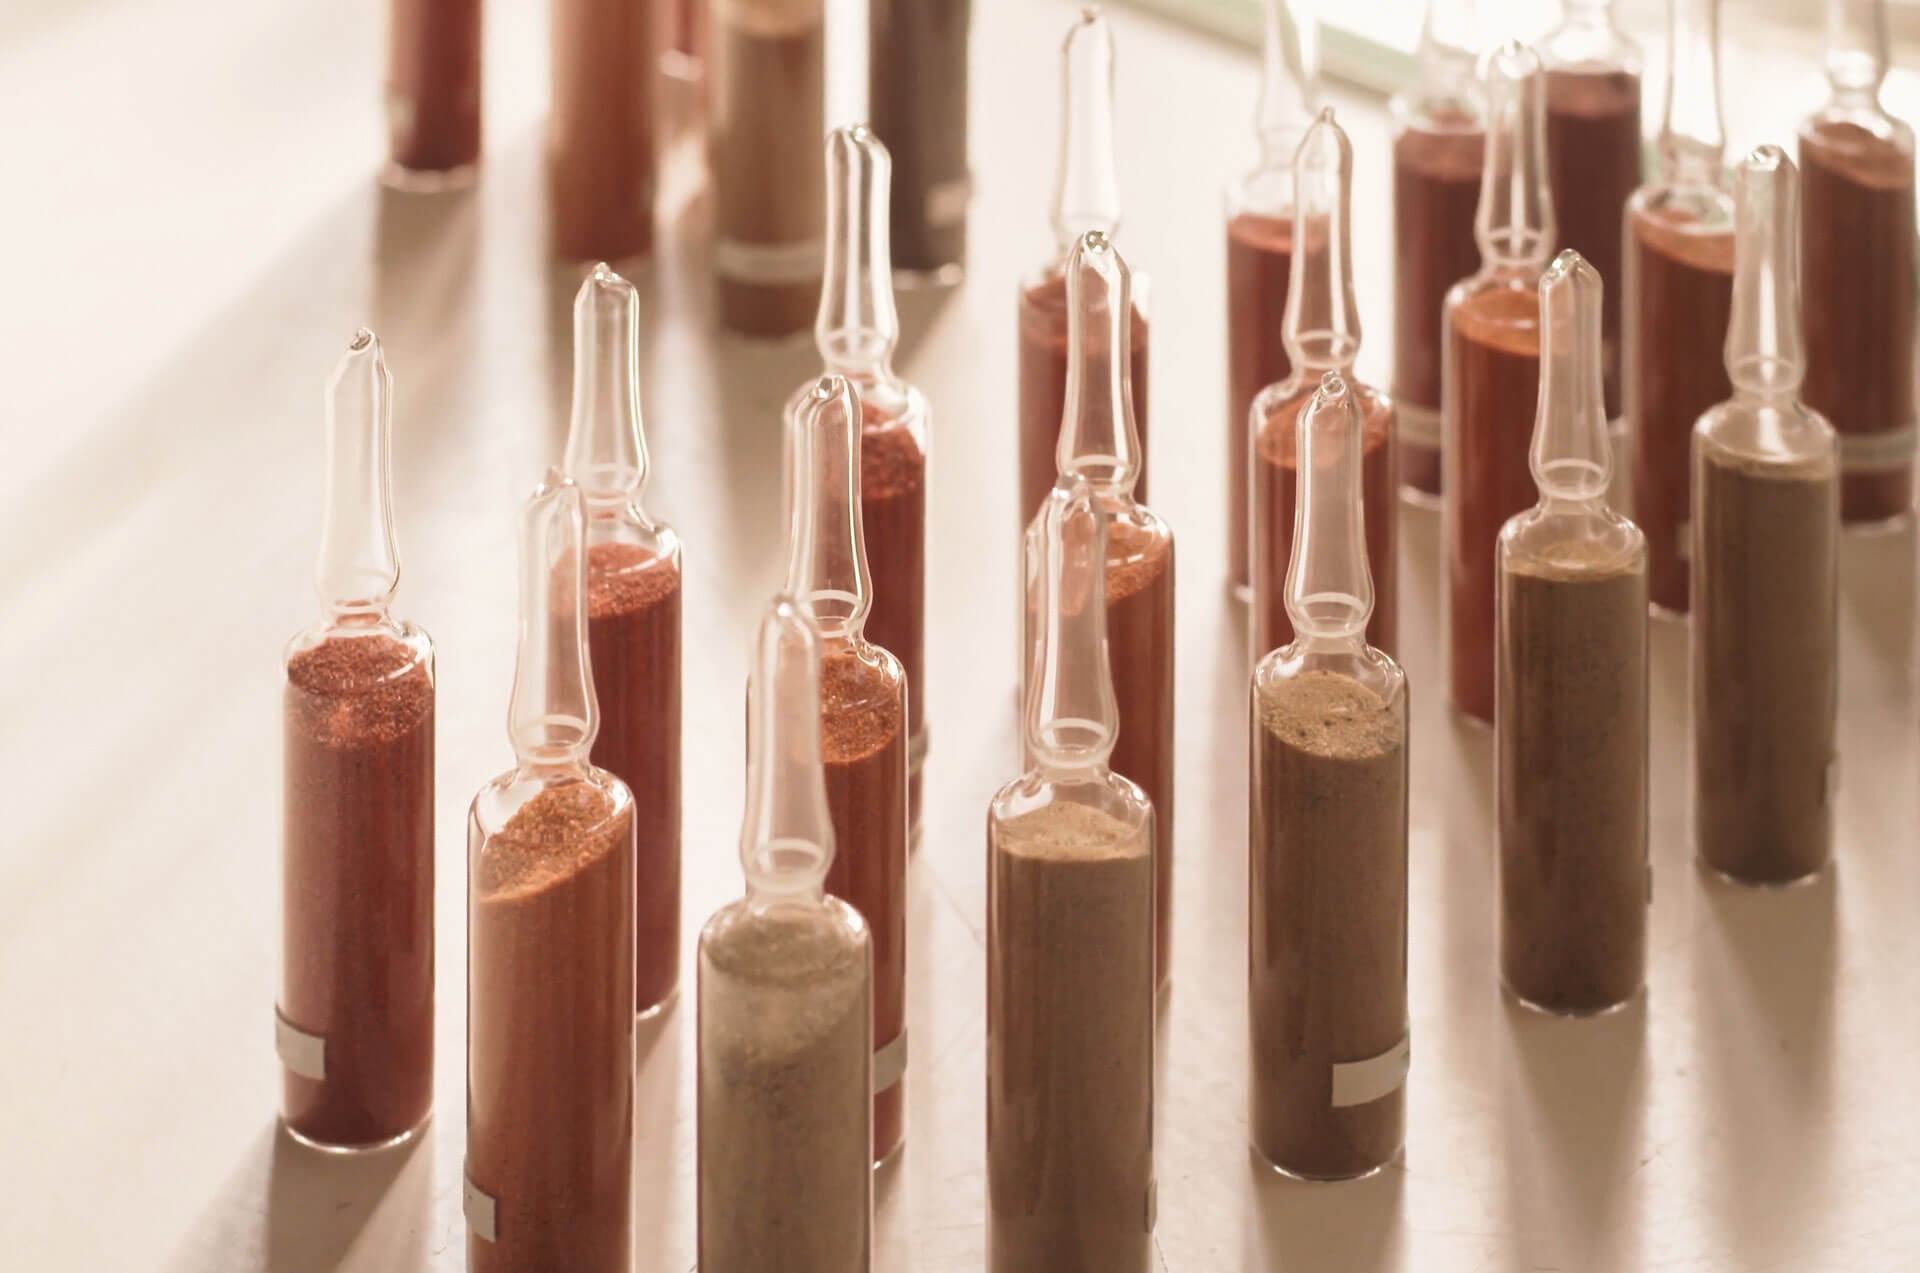
China's Rare Earth Magnet Exports Hit Record in September, Driven by Backlog Release and Regulatory Easing【SMM Analysis】
Oct 20, 2026 16:06 (GMT+8)
Latest News
【SMM Analysis】Chromium Market Weakens Further as Steel Tender Falls in Line with Expectations
21 hours ago
Tianqi Lithium Achieves Breakthrough in Tantalum-Niobium Recovery from Lithium Slag, Completes First Delivery
Oct 23, 2026 17:04 (GMT+8)
【Flash | Canada’s Davidson Project Targets 6,020 t/y of Molybdenum as Estimated Cost Drops to $4.36/lb Mo】
Oct 23, 2026 14:23 (GMT+8)
ADC12 aluminum prices consolidate wildly during the day, with limited room for spot aluminum to move up or down [ADC12 Price Daily Commentary]
Oct 23, 2026 13:24 (GMT+8)
Weakening cost support for silicone; DMC prices slightly lowered [SMM Silicone Weekly Review]
Oct 22, 2026 16:22 (GMT+8)
【Flash | South Korea’s Molybdenum Flows Diverge as Concentrate Imports Fall 26%】
Oct 22, 2026 16:02 (GMT+8)
PV Upstream Multi-Segment Stalemate Holds Steady, Module Prices Continue to Decline [SMM Weekly Review]
Oct 22, 2026 15:31 (GMT+8)
【Flash | Hudbay and Mitsubishi Approve Copper World; Molybdenum Plant Planned for First Operating Year】
Oct 22, 2026 11:55 (GMT+8)
ADC12 aluminum alloy futures open high, under pressure; spot cargo mainly wait-and-see [ADC12 Price Daily Review]
Oct 22, 2026 11:49 (GMT+8)
[SMM Chromium Week Review] Chrome Ore Shipments Fall 40.78% WoW as China's Port Stocks Decline
Oct 21, 2026 22:43 (GMT+8)
[SMM Chromium Flash] Outokumpu Unveils Low-CO₂ Technology to Produce Enriched Ferrochrome and Chromium Metal
Oct 21, 2026 21:35 (GMT+8)
[SMM Chromium Flash] South Africa’s 62c/kWh Power Tariff Clears Path for Two Ferrochrome Smelter Restarts
Oct 21, 2026 21:32 (GMT+8)
Short-Term Support Finally Breached! The International Molybdenum Oxide Market Now in Free Fall?! [SMM Analysis]
Oct 21, 2026 19:14 (GMT+8)
Apple commits up to US$100 million to US titanium supplier
Oct 21, 2026 18:16 (GMT+8)
Short-term support officially declared lost! International molybdenum oxide plunges into a crash?! [SMM Analysis]
Oct 21, 2026 18:05 (GMT+8)
ADC12 aluminum alloy spot prices hold steady; market continues range-bound consolidation [ADC12 Price Daily Commentary]
Oct 21, 2026 13:14 (GMT+8)
【Flash | Peru’s Molybdenum Output Falls in August as Major Mines Diverge】
Oct 21, 2026 09:34 (GMT+8)
[SMM Analysis] Mapping Africa’s Tantalum and Niobium Supply: Operating Mines and Projects in Development
Oct 20, 2026 23:59 (GMT+8)
[SMM Chromium Flash] Tharisa and Valterra Explore Fine Chrome Recovery to Improve Resource Utilization
Oct 20, 2026 22:18 (GMT+8)
[SMM Chromium Flash] Tharisa Begins Renewable Power Supply, Targeting 70% of Mine’s Electricity Demand
Oct 20, 2026 22:16 (GMT+8)