

News
Exclusive analysis articles with the latest market updates, and real-time news feeds.
![[SMM Analysis] India’s BESS Manufacturing Push Accelerates, but Cell Dependence Remains a Key Bottleneck](https://imgqn.smm.cn/production/admin/votes/imagesozVHm20260131125121.jpeg)
[SMM Analysis] India’s BESS Manufacturing Push Accelerates, but Cell Dependence Remains a Key Bottleneck
In the first quarter of 2026, global energy storage system shipments reached 100.0 GWh, a 96.5% increase from 50.9 GWh in the same period of 2025, bringing quarterly shipments to an entirely new scale.
Sep 30, 2026 08:50 (GMT+8)
SMM Launches Aluminium CBAM Calculator: What Cost Estimates Mean for EU-Bound Offers【SMM Analysis】
As the EU Carbon Border Adjustment Mechanism (CBAM) enters its definitive phase, aluminium trade with Europe requires carbon costs to be assessed alongside metal prices, processing charges and logistics. SMM has launched its Aluminium CBAM Calculator , bringing together product codes, origin, emissions data and certificate prices to support export quotations, European procurement and internal budgeting. The aluminium module offers 58 CN codes and 68 origin/default-value categories, covering unwrought aluminium, profiles, sheet, strip, foil and other products. Annual parameters are available for 2026–2030. Users enter a tonnage and select default emissions or enter verified actual emissions. The page then displays estimated certificates per tonne, total certificates, cost per tonne and total budget, with primary and secondary aluminium routes matched to the applicable data basis. The practical benefit is that assumptions and results appear together. Exporters can specify the product, origin, import period and emissions basis behind a quotation, while buyers can compare sources under consistent conditions. The page includes Chinese and English interfaces, parameter tables and a printable cost-sheet option. How the associated costs are shared between buyers and sellers remains a contractual matter. Certificate exposure should be distinguished from its monetary value. As of 29 September 2026, the calculator incorporates official prices of €75.36 per certificate for Q1 2026 and €75.28 for Q2. The Q3 price has not yet been published. Where a price is unavailable, the page retains certificate-volume estimates and leaves costs blank, rather than substituting an assumed price. The current version excludes deductions for carbon prices paid abroad and assessment of the annual import threshold. Its actual-emissions calculation for complex aluminium goods also lacks the free-allocation adjustment attributable to precursors. The analysis below therefore uses the checked default-value calculation. Results are commercial estimates, not final statutory surrender obligations. For market comparisons, the same aluminium product can carry materially different estimated costs depending on its origin-specific default value. Consider CN 76012040—unwrought aluminium alloys in billet form—with primary route K, the Q2 2026 certificate price and a quantity of 1,000 tonnes. Estimated costs under the Chinese, Indian and Canadian default-value cases are €143.98, €50.41 and €57.86 per tonne, respectively. These figures include the annual default-value mark-up and the benchmark-based free-allocation adjustment. The Chinese and Indian default-value cases differ by approximately €93.57 per tonne. Comparing only the metal price or processing charge may therefore miss a meaningful difference in the buyer's budget. Where other commercial terms are similar, estimated CBAM costs could affect an offer's attractiveness. However, this is not a ranking of producers' actual carbon intensity. Freight, customs duties, quality and delivery terms are also outside this comparison, so the figures alone cannot determine the preferred supplier. This highlights the commercial value of supplier emissions documentation. For producers whose actual emissions are below the applicable default value, supported by compliant verification, actual data may change a buyer's cost assessment. Buyers can use defaults for an initial budget when documentation is unavailable, then reassess using supplier evidence. Exporters consequently have a reason to prepare emissions information alongside their product offers, rather than negotiate solely around country-default differences. Annual parameter changes also warrant attention. Holding the Chinese product's base default value, route and benchmark constant, and assuming that the import year and applicable reporting year coincide, estimated certificate exposure rises from 1.912575 per tonne in 2026 to 2.248150 in 2027—an increase of approximately 17.5%. This reflects a higher default-value mark-up and a smaller free-allocation deduction; it does not imply a rise in future certificate prices. For supply arrangements spanning different years, companies can first compare certificate exposure, then discuss price-update mechanisms and cost sharing. Even while future certificate prices remain unknown, identifying that exposure and obtaining supplier documentation can improve the comparability of offers and procurement budgets.
Sep 29, 2026 17:32 (GMT+8)
[SMM Analysis] Low-Carbon of Primary Copper Begin Trading Separately—Will Recycled Copper’s Green Value Be Reassessed?
[SMM Analysis: Low-Carbon of Primary Copper Begin Trading Separately—Will Recycled Copper’s Green Value Be Reassessed?] BHP and Amazon’s EAC pilot separates verified emissions reductions from physical copper trade, giving low-emissions primary copper a new source of environmental value. Recycled copper retains a major energy advantage, but future competitiveness may depend more on traceability, recycled content and verified carbon data, potentially adding an environmental dimension to pricing.
Sep 29, 2026 16:03 (GMT+8)
Latest News
Tusker’s Malawi sampling points to ilmenite dominance
Oct 02, 2026 16:23 (GMT+8)
More than 6,500 Madagascar residents file QMM pollution claim
Oct 01, 2026 16:36 (GMT+8)
Amigo signs $33m agreement for South Africa’s Kamiesberg mineral sands project
Sep 30, 2026 17:15 (GMT+8)
September Peak Season Falls Short of Expectations, Titanium Industry Chain Runs Weak with Divergence [SMM Analysis]
In September, China's titanium industry chain was under pressure overall. For titanium dioxide, industry production rebounded somewhat, and factory inventory saw some destocking, but prices remained flat, lacking upward momentum. Subcategories diverged: chloride-process titanium dioxide prices pulled back 0.62% MoM, while quotes for other titanium dioxide varieties were basically flat. On the titanium sponge side, enterprise production continued to rise MoM, market prices were in the doldrums, and downstream buyers only maintained rigid procurement without active restocking. Overall, the industry's inherent supply-demand imbalance has not eased. The traditional "September peak season" fell short of earlier market expectations, and market participants remained cautious. On balance, the titanium industry chain is expected to remain in the doldrums in the short term.
Sep 30, 2026 17:14 (GMT+8)
Limited Pre-Holiday Restocking Keeps Titanium Dioxide Stable in the Short Term [SMM Titanium Weekly Review]
[SMM Titanium Weekly Review: Limited Pre-holiday Restocking Keeps Titanium Dioxide Prices Largely Stable in the Short Term] The titanium market was in the doldrums this week. Upstream, titanium concentrates supply was ample, with both domestic and imported volumes rising, while downstream buyers pushed for lower prices, leaving ore prices under pressure. Midstream, titanium dioxide benefited from the peak season and pre-holiday stockpiling, with order intake improving MoM, but end-user purchases remained cautious, and actual transaction prices failed to follow through on gains, keeping the market largely stable. Sponge titanium faced a pronounced supply-demand imbalance, with high operating rates combined with sluggish civil demand; the industry was loss-making but production cuts were insufficient, leaving prices weak. The titanium materials market was sharply divided, with the civil segment in the doldrums amid intense price competition, while the aerospace and military segment had full order books and tight supply. Overall, end-use demand had not fully recovered, and the industry chain was dominated by transactions for immediate needs, maintaining a divergent and weak stability in the short term, with the pace of post-holiday restocking being the key variable.
Sep 30, 2026 13:40 (GMT+8)
Pre-holiday Fluctuations Converge, Price Center Shifts to October [SMM Sulphuric Acid Weekly Review]
Pre-holiday Fluctuations Converge, Price Adjustment Center Shifts to October [SMM Sulphuric Acid Weekly Review]
Sep 30, 2026 13:34 (GMT+8)
Pre-holiday stockpiling momentum remains weak; titanium dioxide market consolidates [SMM Titanium Spot Express]
[SMM Titanium Spot Express: Pre-holiday stockpiling momentum weak, titanium dioxide market consolidates] The titanium dioxide market remains stable, with enterprises mainly fulfilling earlier orders. Raw material declines combined with cut-throat competition in the industry mean sulphuric acid process enterprises still face low-price selling due to inventory and capital pressures, while the chloride process highlights cost-related risk resistance advantages. In the short term, the market lacks upward momentum and maintains a fluctuating trend.
Sep 29, 2026 18:00 (GMT+8)
Yongjin Stock Breaks Ground on Precision Metal Materials Project in Zhejiang
【SMM Titanium Flash】On September 28th, Zhejiang Yongjin Precision New Material Co., Ltd., a subsidiary of Yongjin Stock, broke ground on its 100,000-ton annual production project of precision metal new materials in Lanxi, Zhejiang. The project spans an area of 190 acres and focuses on high-value-added products such as ultra-thin precision titanium alloys and metal composites. Targeting high-end markets like electronic information, new energy, and medical equipment, the project, upon completion, will achieve an annual production capacity of 100,000 tons, producing products such as precision composite boards, titanium alloy sheets and strips, and high-performance copper-clad laminates. This project marks the third initiative of Yongjin Stock in Lanxi and is expected to drive the upstream and downstream agglomeration development of the local new material industry chain through the "one enterprise leading one chain" approach.
Sep 29, 2026 09:35 (GMT+8)
Holiday purchases fall short of expectations; titanium market remains stable [SMM titanium spot report]
[SMM Titanium Spot Express: Pre-holiday Purchases Fall Short of Expectations, Titanium Market Remains Stable]. Pre-holiday stockpiling fell short of expectations, with many orders postponed until after the National Day holiday. Although there was slight destocking, the extent was limited, and overall demand remained weak.
Sep 28, 2026 17:22 (GMT+8)
Kazera Executes Northern Cape Mineral Sands Right
[SMM Titanium Flash] Kazera Global said Whale Head Minerals’ mining right over Sea Concession 2A in South Africa’s Northern Cape was formally executed on 23 September, following a grant announced on 2 September. Disclosed on 24 September, the execution covers a 3,095-hectare heavy mineral sands development that includes rutile. Under Kazera’s agreement with South Africa AT Investments, it triggers a further US$1.75 million advance payment against future production. Kazera did not say in this release that the payment had been received.
Execution clears a regulatory step for the proposed expansion. Under the agreement, the partner is responsible for capital and operating funding, while Whale Head Minerals retains a 20% cost-free production entitlement. Kazera targets commercial production from enlarged operations in the first quarter of 2027. That timetable and the proposed volumes are plans, not output already achieved at Concession 2A.
Sep 28, 2026 15:59 (GMT+8)
Amaero Postpones Nasdaq IPO, Expansion Plans Unaffected Amid Market Caution
Sep 28, 2026 13:56 (GMT+8)
Guangxi Hangtai Lays Foundation for Zirconium and Titanium Processing Project in Qinzhou
Sep 28, 2026 13:42 (GMT+8)
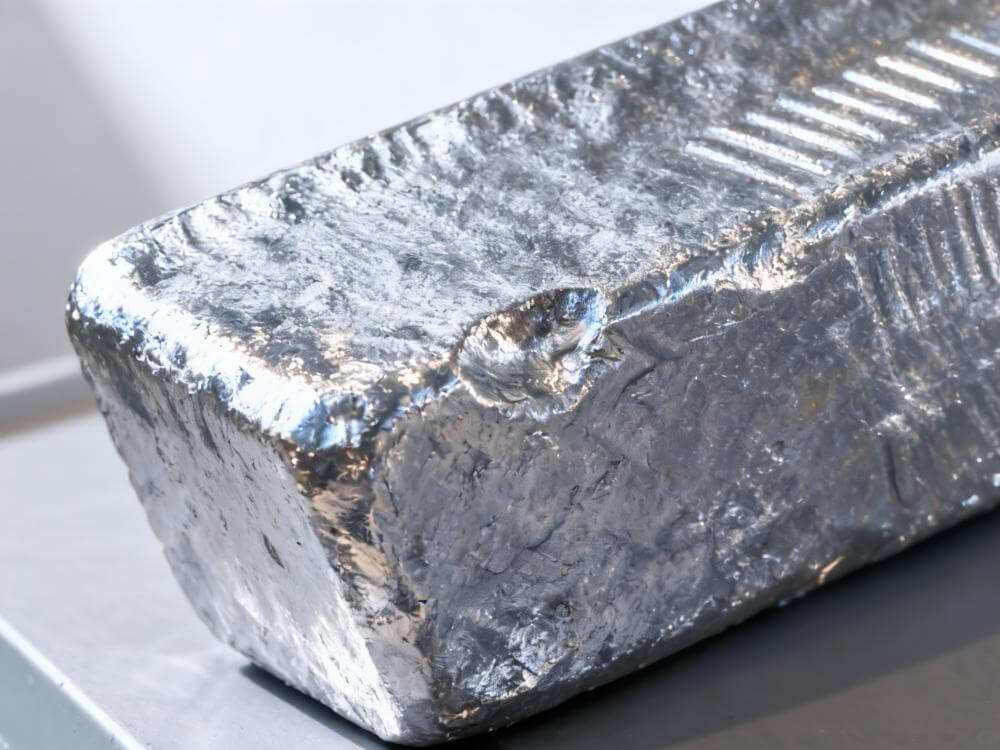
Longbai Lays Foundation for Green Factory in Malaysia, Expanding Global Titanium Dioxide Supply
Sep 28, 2026 13:32 (GMT+8)
Empire produces rutile pigment from Pitfield titanium ore
[SMM Titanium Flash] Empire Metals has successfully produced an uncoated rutile titanium-dioxide pigment from concentrates generated from the in-situ weathered ore at its Pitfield Titanium Project in Western Australia. The company says X-ray diffraction confirmed the TiO₂ was present as rutile. Chemical analysis initially produced 97.6% TiO₂, with sulphur accounting for much of the impurity; correcting for that anomaly gives a calculated grade of about 99.2% TiO₂.
The development moves Pitfield beyond simply demonstrating titanium mineralisation toward producing a higher-value titanium product. Empire is now working on optimisation and surface coating to produce a rutile pigment suitable for architectural coatings. The company says it is also assessing titanium-metal feedstock applications. These remain laboratory and product-development results, not commercial-scale production.
Sep 25, 2026 16:04 (GMT+8)
Insufficient demand growth; titanium industry chain to consolidate on a weak note in the short term [SMM Titanium Weekly Review]
[SMM Titanium Weekly Review: Insufficient Demand Growth Keeps Titanium Industry Chain Consolidating on a Weak Note in the Short Term] In the short term, the titanium industry chain lacks sustained demand growth and continues to consolidate on a weak note overall. Upstream titanium concentrates are in ample supply, and ore prices are under pressure. Titanium slag is suffering losses, with sluggish trading. Titanium dioxide is supported by peak-season orders, but downstream buyers have limited willingness to rush to buy amid continuous price rises, capping the upside. Sponge titanium supply keeps being released, and inventory pressure is hard to digest quickly. Titanium materials continue to show structural divergence, with weak civilian demand dragging down the market, while only the high-end aviation segment maintains resilience. Without the positive catalyst of concentrated downstream restocking, prices across all products are unlikely to see a significant rebound. Going forward, close attention should be paid to changes in actual end-user transactions.
Sep 24, 2026 15:58 (GMT+8)
Waiting for Policies and Winter Stockpiling: The "Sub-Thousand Wave" Spreads to Central China [SMM Sulphuric Acid Weekly Review]
Waiting for Policies and Winter Stockpiling: The “Thousand-Yuan Break” Spreads to Central China [SMM Sulphuric Acid Weekly Review]
Sep 24, 2026 15:12 (GMT+8)
Tug-of-war between sellers and buyers continues, titanium dioxide market operates steadily [SMM Titanium Spot Express]
[SMM Titanium Spot Express: Tug-of-war between sellers and buyers continued, titanium dioxide market remained stable] The titanium dioxide market moved sideways today, with ample supply coexisting with limited peak-season restocking, while cost support and weak demand offset each other, leading to a short-term consolidation on a strong note.
Sep 23, 2026 18:04 (GMT+8)
Eurasian Economic Union Suspends Anti-Dumping Duties on Chinese Titanium Dioxide Until 2027
【SMM Titanium Flash】 On September 21st, the Eurasian Economic Commission Council decided to suspend anti-dumping measures on titanium dioxide imported from China, effective until August 10th, 2027. Previously, in accordance with Resolution No. 96 of October 2025, the Eurasian Economic Union had imposed anti-dumping duties ranging from 14.27% to 16.25% on Chinese titanium dioxide. Analysts believe that the suspension of these measures is beneficial to the interests of the Eurasian Economic Union countries. This move will reduce the tariff costs for Chinese titanium dioxide exports to the Eurasian market, and the relevant export volume is expected to rebound. Domestic titanium dioxide enterprises may further expand their overseas market opportunities.
Sep 23, 2026 16:15 (GMT+8)
North Atlantic Titanium Gets Approval for Drilling at Quebec Project, Aims to Expand Titanium Resources
【SMM Titanium Flash】 On September 22, North Atlantic Titanium Corp. announced that it had obtained approval from the Quebec Ministry of Natural Resources and Forests to conduct drilling at the Everett Titanium-Vanadium-Phosphate project in Havel-Saint-Pierre. The company plans to complete approximately 25,000 meters of drilling on 20 rigs over a three-year period. The weighted average grade of early metallurgical samples is TiO₂ 17.4% and V₂O₅ 0.18%. About 99% of the oxide minerals are high-quality ilmenite, with very low contents of magnesium, manganese, and aluminum. The deposit is located approximately 3 kilometers from the Lac Tio mine. As drilling progresses, the potential of titanium resources in this project is expected to become clearer, potentially adding a new source to the supply of titanium raw materials in North America.
Sep 23, 2026 16:09 (GMT+8)
Price-Holding in Peak Season Faces Resistance; Titanium Dioxide Maintains a Strongly Contested Pattern [SMM Titanium Spot Express]
[SMM Titanium Spot Express: Resistance to Firm Price Implementation During Peak Season; Titanium Dioxide Maintains Strong Bargaining Dynamics] Titanium dioxide enterprises collectively raised their quotes earlier, but end-users only followed up with rigid demand and showed insufficient willingness to stockpile, resulting in limited actual realization of the price hikes. Trader restocking drove orders forward.
Sep 22, 2026 17:30 (GMT+8)
![[SMM Announcement] Chinese Market Metal Prices and News Updates Suspended during National Day Holiday (Oct 1-7)](https://imgqn.smm.cn/usercenter/HeIuV20251217171708.jpg)
[SMM Announcement] Chinese Market Metal Prices and News Updates Suspended during National Day Holiday (Oct 1-7)
Dear Valued SMM Users, The National Day holiday is approaching. Please note that SMM Chinese market metal price assessments and news updates will be temporarily suspended during the holiday (October 1-7) and resume normal release after the break. However, SMM overseas price assessment will continue to be updated as usual throughout the holiday. We apologise for any inconvenience caused and wish you a pleasant holiday. Shanghai Metals Market (SMM)
Sep 28, 2026 17:06 (GMT+8)
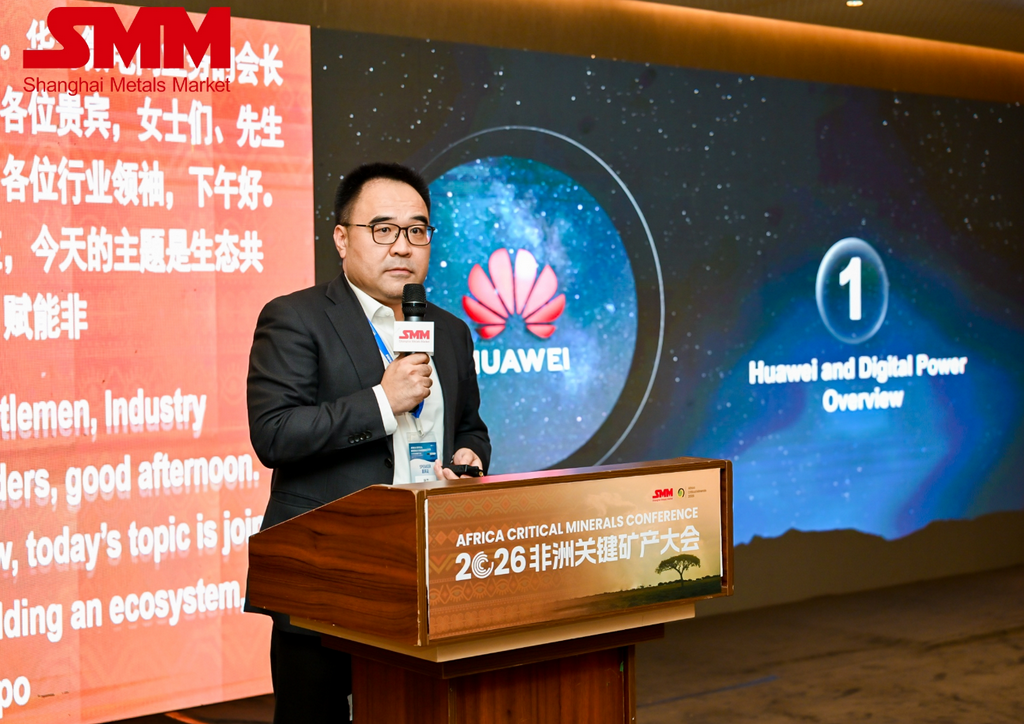
Huawei Pursues Africa Green‑Mining Partnerships and Holds Business Talks with ZESCO at SMM ACM 2026
Sep 23, 2026 16:41 (GMT+8)
![[SMM Analysis] The U.S. Copper Tariff Trade Is Fading — but It Isn’t Over Yet](https://imgqn.smm.cn/production/admin/votes/imagesMbCUq20260929144044.png)
[SMM Analysis] The U.S. Copper Tariff Trade Is Fading — but It Isn’t Over Yet
Sep 29, 2026 14:37 (GMT+8)
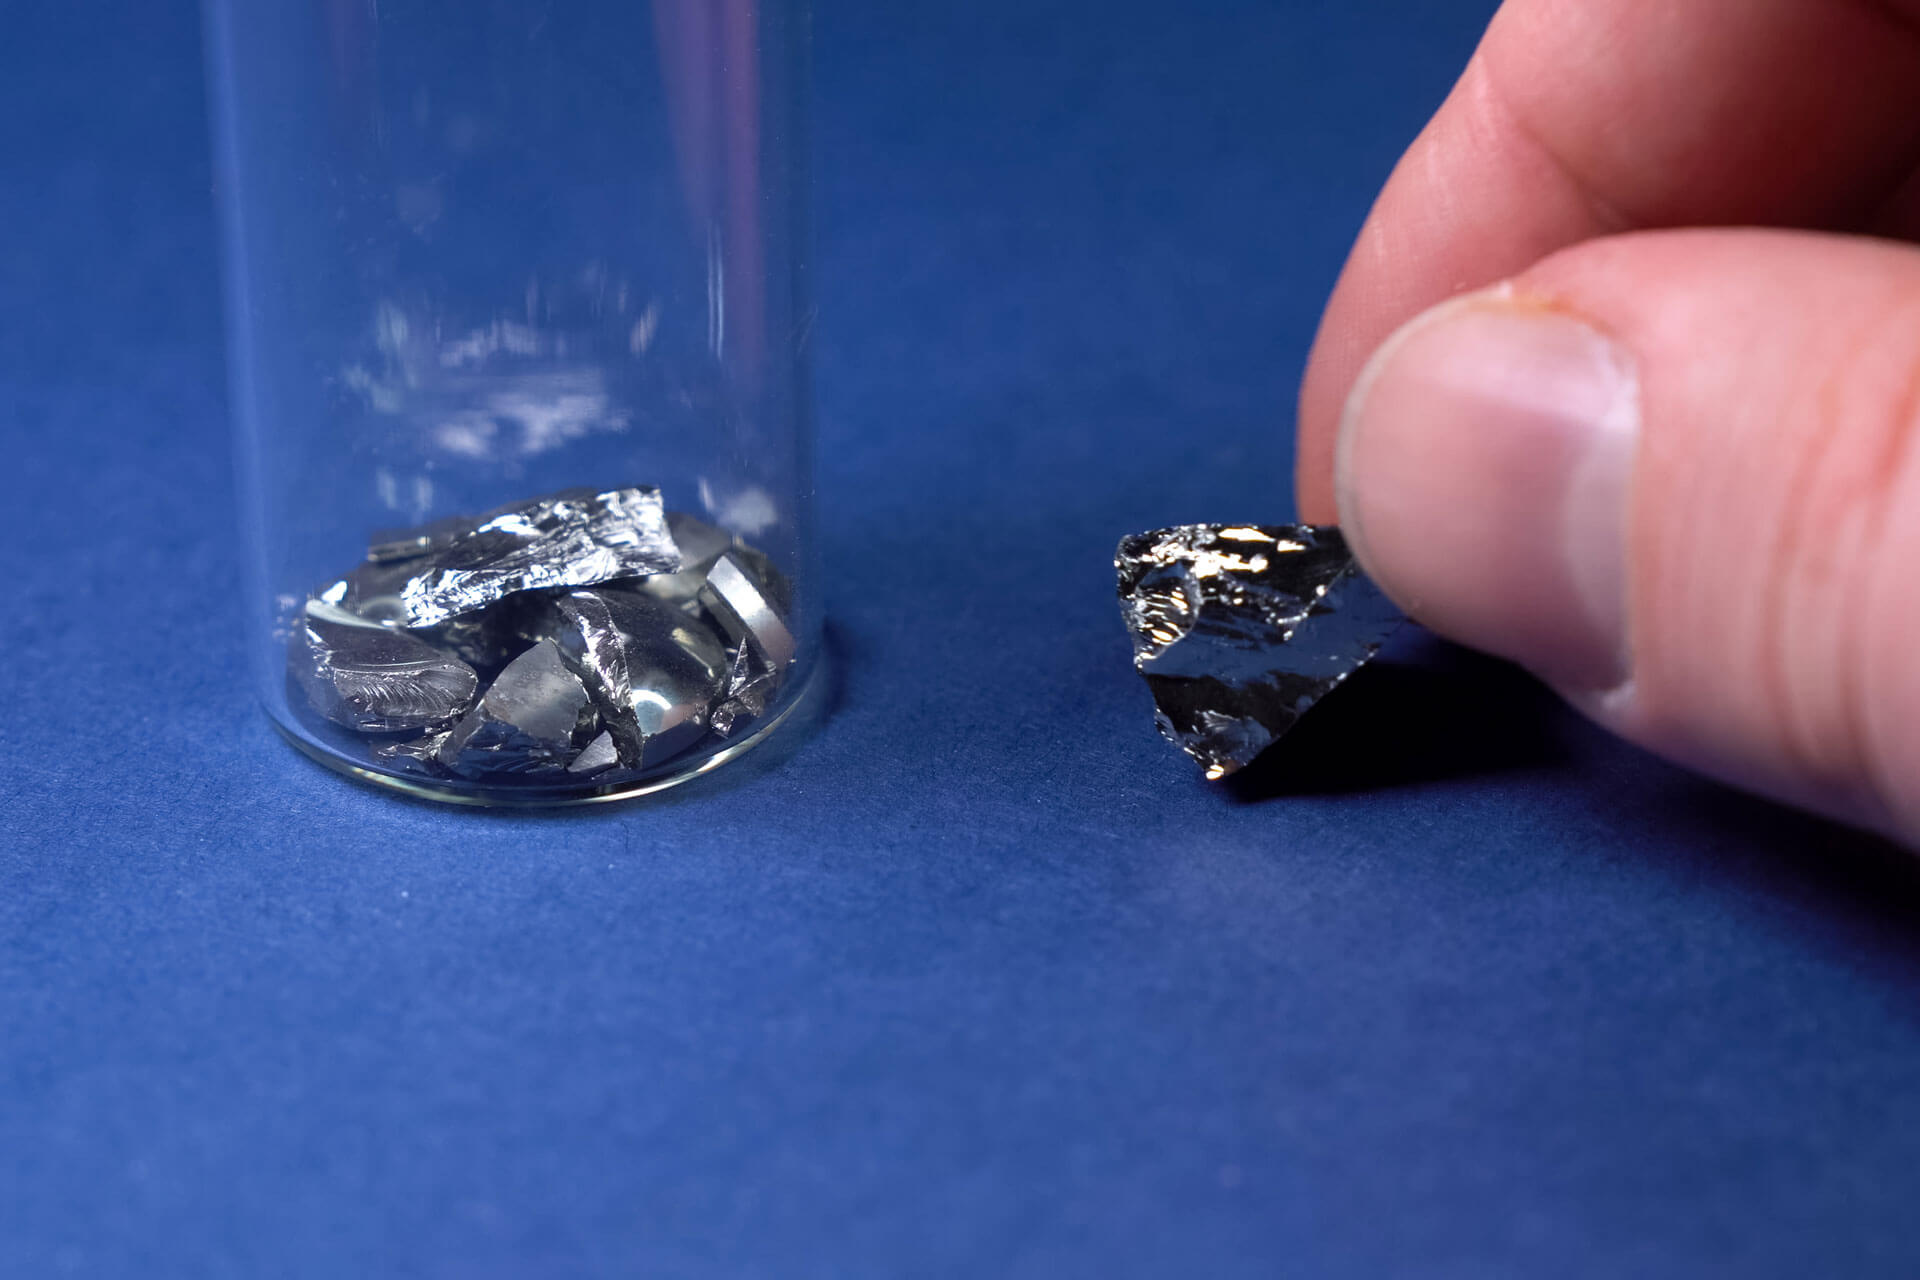
South Africa Poised to Become Key Player in Global Rare Earth Supply Chain by 2034【SMM Analysis】
Sep 29, 2026 18:54 (GMT+8)
[SMM Analysis] India’s BESS Manufacturing Push Accelerates, but Cell Dependence Remains a Key Bottleneck
Sep 30, 2026 08:50 (GMT+8)
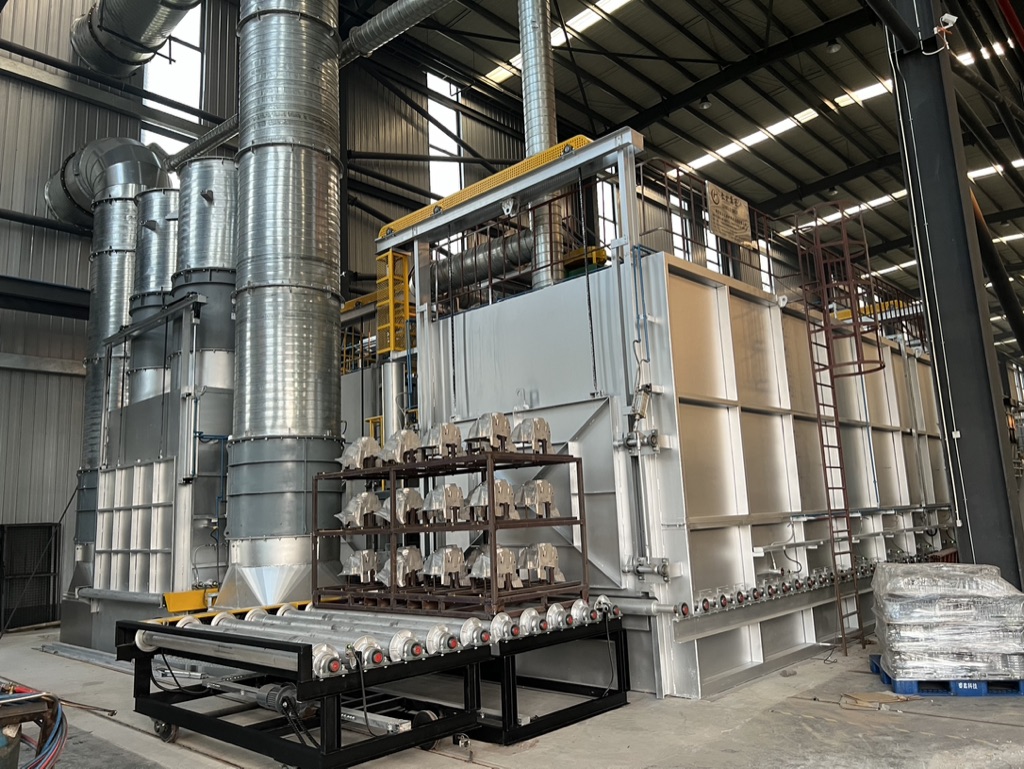
SMM Launches Aluminium CBAM Calculator: What Cost Estimates Mean for EU-Bound Offers【SMM Analysis】
Sep 29, 2026 17:32 (GMT+8)
![[SMM Analysis] Low-Carbon of Primary Copper Begin Trading Separately—Will Recycled Copper’s Green Value Be Reassessed?](https://imgqn.smm.cn/usercenter/MXbup20251217171745.jpg)
[SMM Analysis] Low-Carbon of Primary Copper Begin Trading Separately—Will Recycled Copper’s Green Value Be Reassessed?
Sep 29, 2026 16:03 (GMT+8)
Latest News
Tusker’s Malawi sampling points to ilmenite dominance
Oct 02, 2026 16:23 (GMT+8)
More than 6,500 Madagascar residents file QMM pollution claim
Oct 01, 2026 16:36 (GMT+8)
Amigo signs $33m agreement for South Africa’s Kamiesberg mineral sands project
Sep 30, 2026 17:15 (GMT+8)
September Peak Season Falls Short of Expectations, Titanium Industry Chain Runs Weak with Divergence [SMM Analysis]
Sep 30, 2026 17:14 (GMT+8)
Limited Pre-Holiday Restocking Keeps Titanium Dioxide Stable in the Short Term [SMM Titanium Weekly Review]
Sep 30, 2026 13:40 (GMT+8)
Pre-holiday Fluctuations Converge, Price Center Shifts to October [SMM Sulphuric Acid Weekly Review]
Sep 30, 2026 13:34 (GMT+8)
Pre-holiday stockpiling momentum remains weak; titanium dioxide market consolidates [SMM Titanium Spot Express]
Sep 29, 2026 18:00 (GMT+8)
Yongjin Stock Breaks Ground on Precision Metal Materials Project in Zhejiang
Sep 29, 2026 09:35 (GMT+8)
Holiday purchases fall short of expectations; titanium market remains stable [SMM titanium spot report]
Sep 28, 2026 17:22 (GMT+8)
Kazera Executes Northern Cape Mineral Sands Right
Sep 28, 2026 15:59 (GMT+8)
Amaero Postpones Nasdaq IPO, Expansion Plans Unaffected Amid Market Caution
Sep 28, 2026 13:56 (GMT+8)
Guangxi Hangtai Lays Foundation for Zirconium and Titanium Processing Project in Qinzhou
Sep 28, 2026 13:42 (GMT+8)
Longbai Lays Foundation for Green Factory in Malaysia, Expanding Global Titanium Dioxide Supply
Sep 28, 2026 13:32 (GMT+8)
Empire produces rutile pigment from Pitfield titanium ore
Sep 25, 2026 16:04 (GMT+8)
Insufficient demand growth; titanium industry chain to consolidate on a weak note in the short term [SMM Titanium Weekly Review]
Sep 24, 2026 15:58 (GMT+8)
Waiting for Policies and Winter Stockpiling: The "Sub-Thousand Wave" Spreads to Central China [SMM Sulphuric Acid Weekly Review]
Sep 24, 2026 15:12 (GMT+8)
Tug-of-war between sellers and buyers continues, titanium dioxide market operates steadily [SMM Titanium Spot Express]
Sep 23, 2026 18:04 (GMT+8)
Eurasian Economic Union Suspends Anti-Dumping Duties on Chinese Titanium Dioxide Until 2027
Sep 23, 2026 16:15 (GMT+8)
North Atlantic Titanium Gets Approval for Drilling at Quebec Project, Aims to Expand Titanium Resources
Sep 23, 2026 16:09 (GMT+8)
Price-Holding in Peak Season Faces Resistance; Titanium Dioxide Maintains a Strongly Contested Pattern [SMM Titanium Spot Express]
Sep 22, 2026 17:30 (GMT+8)