Berita
Artikel analisis eksklusif dengan pembaruan pasar terkini dan umpan berita tepat waktu.
![[Analisis SMM] Pajak Konsumsi Baterai Litium Baru Tiongkok: Dampak pada Sektor Sumber Daya Daur Ulang](https://imgqn.smm.cn/usercenter/zWZVI20251217171730.jpg)
[Analisis SMM] Pajak Konsumsi Baterai Litium Baru Tiongkok: Dampak pada Sektor Sumber Daya Daur Ulang
Pengumuman Nomor 20 Tahun 2026 telah resmi berlaku, menjelaskan bahwa Tiongkok akan kembali memberlakukan pajak konsumsi atas baterai litium-ion mulai 1 September 2026. Kebijakan ini mengadopsi mekanisme tarif pajak bertingkat: periode September 2026 hingga Agustus 2027 menjadi masa transisi kebijakan, dengan tarif pajak konsumsi sebesar 2%; mulai 1 September 2027, tarif tersebut resmi dinaikkan menjadi 4%.
28 Jul 2026 14:26
[Analisis SMM] Mengapa India Muncul sebagai Pembeli Aktif di Pasar Skrap Tembaga Global?
[SMM Analysis: Mengapa India Dapat Mempertahankan Penawaran Tinggi untuk Skrap Tembaga Luar Negeri?] Impor skrap tembaga India meningkat karena pasokan domestik tidak mampu memenuhi permintaan yang terus tumbuh dari jaringan listrik, kabel, dan manufaktur. Bea masuk nol, pemrosesan yang fleksibel, biaya pengolahan yang lebih rendah, serta keunggulan biaya angkut mendukung penawaran yang lebih tinggi. Namun, pasokan global yang ketat dan tingginya persentase pembayaran (payability) dapat terus menekan margin.
27 Jul 2026 15:45
Indonesia Dilaporkan Menahan Kargo Alumina karena Logam Tanah Jarang. Berikut Isi Peraturannya yang Sebenarnya.
Pengiriman alumina yang dikabarkan ditahan oleh bea cukai Indonesia menyoroti potensi implikasi regulasi dari terdeteksinya unsur tanah jarang (REE) dalam alumina. Hal ini menimbulkan pertanyaan tentang bagaimana kerangka regulasi tersebut diterapkan dalam kasus di mana kandungan REE terdeteksi pada alumina yang sebaliknya telah memenuhi ketentuan.
27 Jul 2026 15:22
Berita Terbaru
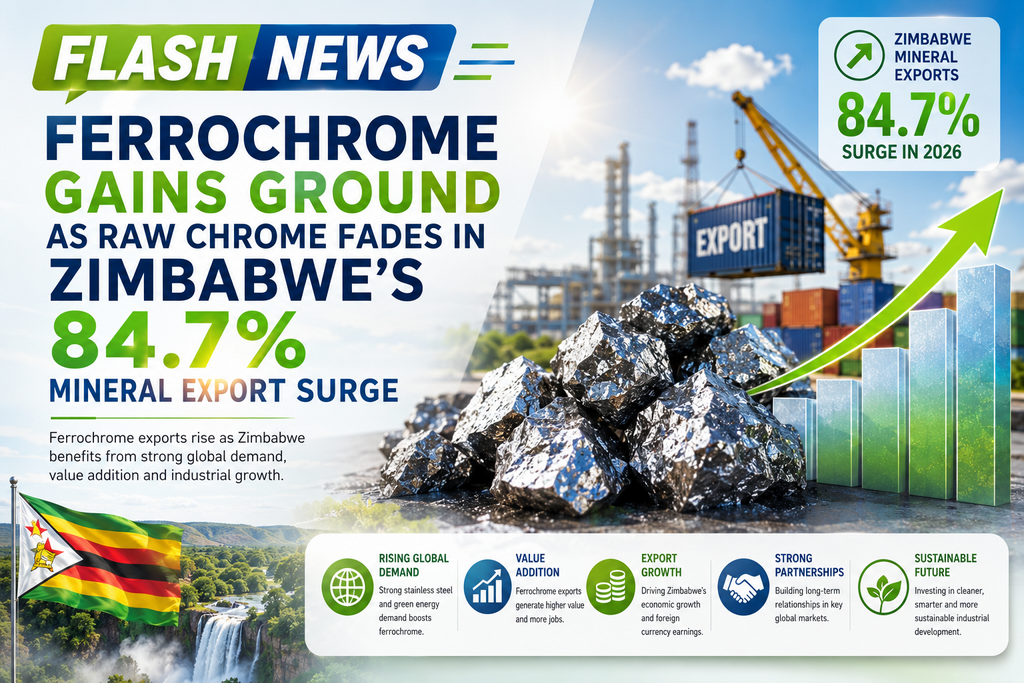
Ferrokrom Menguat seiring Memudarnya Krom Mentah dalam Lonjakan Ekspor Mineral Zimbabwe 84,7%
31 Jul 2026 23:44
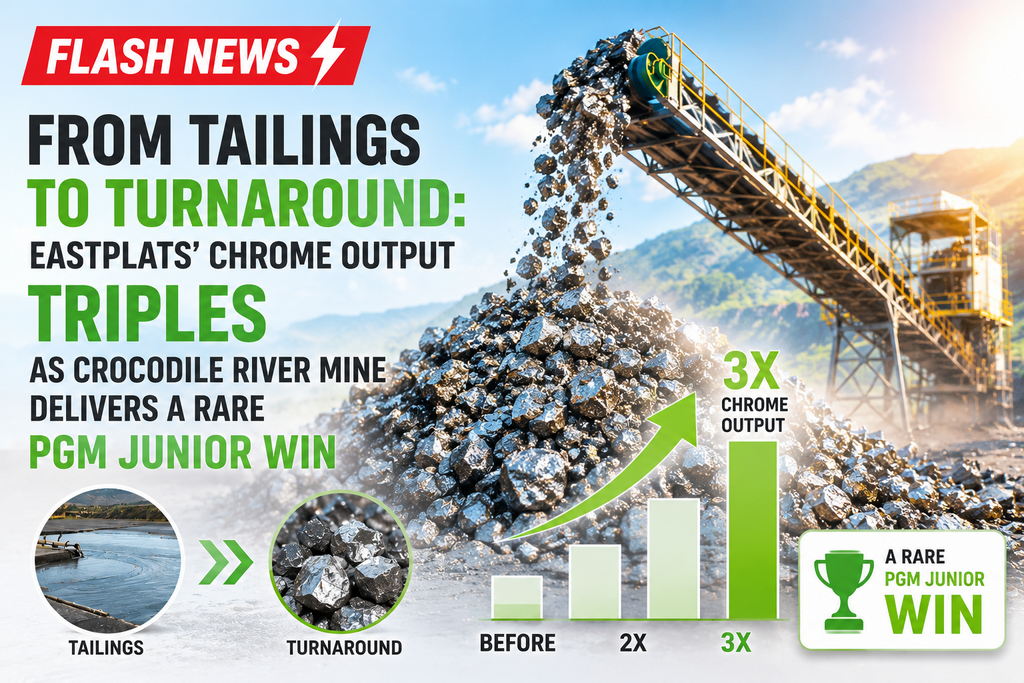
Dari Tailing ke Kebangkitan: Produksi Kromium Eastplats Melonjak Tiga Kali Lipat saat Tambang Crocodile River Memberikan Kemenangan Langka bagi Perusahaan PGM Junior
31 Jul 2026 21:58

【Analisis SMM】Tekanan Musim Sepi: Stok Si-Mn Menumpuk, Pemangkasan Produksi Akan Berlanjut
31 Jul 2026 21:07

Penindakan Penambangan Krom Ilegal di Limpopo Meluas: Penangkapan, Penyitaan Truk, dan Perampasan Aset Meningkat pada 2026
[SMM Ekspres] Operasi penegakan hukum Afrika Selatan terhadap penambangan krom ilegal di Limpopo meningkat hingga pertengahan 2026, dengan Hawks menangkap lima tersangka berusia 43 hingga 50 tahun di lokasi tambang krom ilegal di wilayah kepolisian Thabazimbi pada 12–13 Juli. Operasi yang digelar oleh Tim Investigasi Kejahatan Terorganisir Serius Limpopo bersama unit SAPS setempat, Pusat Rekaman Kriminal, dan Departemen Sumber Daya Mineral dan Perminyakan ini berujung pada dakwaan penambangan ilegal dan pelanggaran hukum lingkungan; para tersangka dihadirkan di Pengadilan Magistrat Thabazimbi pada 14 Juli.
Penangkapan ini merupakan bagian dari pola aktif yang lebih luas, bukan insiden terisolasi. Pada akhir Mei, Unit Perampasan Aset mendapatkan perintah perampasan senilai R4,5 juta yang mencakup truk dan trailer terkait penambangan krom ilegal di distrik Sekhukhune, dan pada awal Juli sebuah putusan pengadilan terpisah mengizinkan pihak berwenang menyita tujuh truk bermuatan bijih krom dari operasi ilegal lainnya. Secara keseluruhan, kasus-kasus ini mengindikasikan aksi terkoordinasi yang berkelanjutan di lintasan krom Limpopo, menyasar truk, lokasi, dan hasil dari ekstraksi krom tanpa izin.
31 Jul 2026 19:52
Sentimen wait-and-see pasar tetap kuat, harga spot terus merosot perlahan [SMM SiMn Weekly Review]
Hingga Jumat ini, SiMn 6517 (tunai) berada di 5.650-5.700 yuan/mt di China utara, tidak berubah dari minggu sebelumnya; di China selatan, SiMn 6517 (tunai) berada di 5.700-5.750 yuan/mt, tidak berubah dari Jumat minggu lalu; SiMn 6014 (tunai) di China selatan berada di 5.350-5.400 yuan/mt, tetap dari minggu sebelumnya.
Baru-baru ini, kontrak berjangka SiMn bergerak mendatar dalam tren lemah, sentimen pasar sangat hati-hati, harga turun, dan harga berjangka pada dasarnya sejalan dengan harga spot.
31 Jul 2026 18:55
[SMM Tinjauan Mingguan Bijih Mangan] Kondisi pasar di luar negeri secara umum menurun ditambah dengan lemahnya permintaan sehingga para pedagang memilih untuk menjual dengan harga lebih rendah.
Laporan 31 Juli:
Pelabuhan China Utara: bongkahan Australia 46% 40,5–41 yuan/mtu, turun WoW; semi-karbonat Afrika Selatan 33,5–34 yuan/mtu, turun WoW; Gabon 38,3–38,7 yuan/mtu, turun WoW; kadar besi tinggi Afrika Selatan 28,8–29,3 yuan/mtu, turun WoW; kadar besi sedang Afrika Selatan 36–36,5 yuan/mtu, stabil WoW.
Pelabuhan China Selatan: bongkahan Australia 46% 42,9–43,4 yuan/mtu, stabil WoW; semi-karbonat Afrika Selatan 36,5–37 yuan/mtu, turun WoW; Gabon 41,1–41,6 yuan/mtu, naik WoW; kadar besi tinggi Afrika Selatan 31,2–31,7 yuan/mtu, turun WoW; kadar besi sedang Afrika Selatan 38–38,5 yuan/mtu, stabil WoW.
Harga bijih mangan terus melemah, permintaan akhir masih lesu, dan pedagang lazim menjual dengan harga lebih rendah.
31 Jul 2026 18:51
Transaksi Stagnan, Tren Ferrochrome dan Bijih Krom Berbeda [SMM Analysis]
31 Juli 2026 - Minggu ini, perdagangan pasar ferokrom stagnan dan harga turun; pasar bijih krom lesu, dengan permintaan terbatas......
31 Jul 2026 18:44
Aluminum Alloy Futures Consolidated at Highs, Closed Lower in Late Trading; Spot Aluminum Quotes Steady [ADC12 Daily Price Review]
[ADC12 Price Daily: Aluminum Alloy Futures Consolidate at Highs, Close Lower; Spot ADC12 Prices Hold Steady] Today, ADC12 market prices were largely stable. The cost side did not show any noticeable changes, still providing some support to prices. However, the demand side was weak, and insufficient orders exerted some pressure on the market, with some enterprises showing a slight willingness to cut prices.
31 Jul 2026 15:54
Kekuatan harga didorong biaya, liburan gelombang panas menghambat permintaan, kenaikan ADC12 terbatas [Tinjauan Mingguan Skrap Aluminium dan Aluminium Sekunder]
[Tinjauan Mingguan Aluminium Bekas dan Aluminium Sekunder: Penguatan Harga Didorong Biaya, Libur Suhu Tinggi Menekan Permintaan, Kenaikan ADC12 Terbatas] Minggu ini, harga pasar ADC12 mula-mula stabil lalu naik. Harga ADC12 SMM bertahan di 24.000 yuan/ton pada awal minggu, dinaikkan dua hari berturut-turut di pertengahan minggu karena dorongan biaya, dan berada di 24.200 yuan/ton pada Kamis, naik 200 yuan/ton dari Kamis lalu. Sisi biaya tetap menjadi pendorong utama kenaikan harga minggu ini.
31 Jul 2026 14:13
Penurunan Pasokan Akibat Kerugian Memanaskan Permainan Long-Short Silikon Industri [Analisis SMM]
Secara keseluruhan, produsen hulu menopang harga di tengah kerugian dengan meningkatnya inventaris pabrik, pedagang tengah terus mengurangi stok, sementara pembeli hilir bersikeras pada pengadaan harga rendah. Dinamika pasar multi-dimensi telah melemahkan likuiditas perdagangan secara keseluruhan. Biaya membentuk dasar dukungan kuat bagi harga spot, sementara tingginya inventaris pabrik dan permintaan musim sepi yang lesu membatasi momentum kenaikan harga. Pelemahan pasar yang berkelanjutan dapat memicu pemotongan produksi aktif lebih lanjut di sisi suplai.
31 Jul 2026 10:41
TCL Zhonghuan, Gokin Solar, Jinko, TrinaSolar, dan 6 Perusahaan Lainnya Masuk Daftar Pendek Prapkualifikasi Pemasok Modul PV 1 GW Shenzhen Energy
31 Jul 2026 10:31

Northam Platinum Bergabung dengan Sibanye-Stillwater & Bengwenyama dalam Meningkatkan Produksi Krom karena Produsen PGM Mengejar Sumber Pendapatan Baru
30 Jul 2026 20:45
Pasar Konsentrat Tantalum Nigeria: Harga, Kualitas, dan Pembeli
30 Jul 2026 20:16
Produksi di bawah tekanan, sisi pasokan menunjukkan penurunan marjinal; tren struktural berbeda untuk logam silikon [SMM Silicon Industry Weekly Review]
[Produksi Tertekan, Pengurangan Pasokan Marjinal, Divergensi Tren Struktural Logam Silikon]: Rantai industri logam silikon memperlihatkan pola tarik-menarik yang jelas, dengan divergensi struktural antara hulu dan menengah. Di sisi pasokan, produsen silikon mengalami kerugian arus kas, dan sebagian kecil melakukan pemeliharaan serta penghentian produksi; namun, pemangkasan aktual yang terbatas tidak berdampak pada arah sentimen pasar. Produsen silikon menunjukkan kecenderungan kuat menahan harga dan enggan menurunkan kuotasi demi mendorong pesanan, sementara persediaan di dalam pabrik menunjukkan tren penumpukan. Di sektor menengah, stok sosial terus berkurang dalam beberapa pekan terakhir. Perusahaan dagang yang bermain di pasar spot dan berjangka mengalami peningkatan aktivitas transaksi saat harga berjangka rendah, dan persediaan di segmen sirkulasi perdagangan terus menyusut. Pengetatan pasokan yang beredar mendorong penguatan selisih harga spot-berjangka, dan logam silikon spot lebih tahan terhadap penurunan dibandingkan kontrak berjangka.
30 Jul 2026 19:03
Kedatangan rendah, terutama pengambilan kargo; stok sosial logam silikon melanjutkan tren pengurangan stok [SMM Silicon Inventory]
[SMM: Kedatangan Rendah, Utamanya Pengambilan Kargo, Persediaan Sosial Logam Silikon Terus Menunjukkan Tren Destocking] Statistik SMM per 30 Juli menunjukkan bahwa persediaan sosial logam silikon di wilayah utama turun 13.000 mt dari minggu sebelumnya.
30 Jul 2026 18:00
GAM Luncurkan Proses Pemurnian Canggih, Meningkatkan Hasil Niobium Mutu Superkonduktor sebesar 18%
【SMM Berita Kilat Tantalum & Niobium】Global Advanced Metals (GAM), produsen tantalum dan niobium kemurnian tinggi terkemuka di Amerika Utara, resmi mengoperasikan proses pemurnian metalurgi baru yang ditingkatkan di pabrik Boyertown, Pennsylvania, pada Juni tahun ini. Proses pemurnian terintegrasi ini merevolusi alur kerja peleburan berkas elektron dan ekstraksi pelarut konvensional, memungkinkan kontrol presisi terhadap jejak pengotor oksigen, karbon, dan logam dalam bahan baku tantalum dan niobium. Terverifikasi melalui beberapa batch uji coba industri, tingkat hasil niobium kelas superkonduktor untuk komponen magnet fusi meningkat 18 poin persentase dibandingkan proses sebelumnya. Niobium kelas superkonduktor memerlukan kandungan pengotor sangat rendah untuk memastikan rasio resistansi sisa ultra-tinggi, menjadikannya bahan baku inti yang tak tergantikan untuk kumparan superkonduktor Nb₃Sn ITER. GAM telah menandatangani perjanjian kerangka pasokan tetap jangka panjang dengan General Atomics, kontraktor utama manufaktur domestik AS untuk ITER. Proses baru ini sekaligus meningkatkan efisiensi pemurnian ingot tantalum kemurnian tinggi tingkat semikonduktor, memangkas siklus produksi per batch sebesar 22% dan mengurangi kehilangan material secara signifikan. Saat ini, pasokan global niobium khusus untuk aplikasi fusi sangat ketat, dan peningkatan teknologi ini memungkinkan GAM memperluas kapasitas pasokan stabil untuk ITER dan proyek akselerator partikel skala besar lainnya. Perusahaan menyatakan akan memperluas lini produksi pemurnian lebih lanjut pada tahun 2027 guna memenuhi lonjakan permintaan pasar logam superkonduktor yang didorong oleh industri energi fusi global dan semikonduktor kelas atas.
30 Jul 2026 17:59
Beberapa harga batu bara silikon individu masih mengalami sedikit penurunan, sementara pasar kokas minyak bumi melanjutkan konsolidasi dengan nada kuat [SMM Silicon Metal Raw Materials Weekly Review]
30 Jul 2026 16:50
Sebagian besar perusahaan monomer silikon menangguhkan penawaran, harga DMC melonjak kembali. [SMM Tinjauan Mingguan Silikon]
[Ulasan Mingguan Silikon SMM: Sebagian Besar Perusahaan Monomer Menangguhkan Penawaran, Harga DMC Melonjak Kembali] Minggu ini, harga DMC tetap kuat dan naik tajam, dengan penawaran antara 12.500 hingga 12.800 yuan/ton, naik 1.050 yuan/ton dibandingkan minggu lalu. Di sisi permintaan, harga sebelumnya sempat turun ke titik terendah sementara, dan stok bahan baku di perusahaan menengah dan hilir juga menipis ke level rendah, sehingga beberapa pelanggan mulai melakukan pembelian penimbunan secara bertahap. Hal ini mendorong pengurasan stok di perusahaan monomer, dan pesanan pra-penjualan sudah terjadwal hingga akhir Agustus. Dengan memanfaatkan tunggakan pesanan ini, sebagian besar perusahaan monomer menghentikan penawaran, menunggu penyesuaian seragam setelah Pertemuan Hanye Agustus. Hanya sedikit produsen yang melepas kargo spot, dengan sistem satu pesanan satu negosiasi. Pasokan harga murah di pasar semakin mengetat, yang secara signifikan mempersempit ruang tawar pembeli hilir.
30 Jul 2026 16:37
Polisilikon Menanti Rencana Pertemuan Biaya, Harga Modul Stabil Didukung oleh Keinginan Melindungi Keuntungan [Tinjauan Mingguan SMM]
[Tinjauan Mingguan SMM: Polisilikon Menunggu Rencana Pertemuan Biaya, Harga Modul Stabil karena Kemauan Melindungi Laba] Pekan ini, harga modul Tiongkok menunjukkan tanda-tanda stabilisasi. Akibat kinerja keuangan yang buruk dari sejumlah perusahaan pada pertengahan tahun, dengan perusahaan-perusahaan dalam kondisi rugi yang berkelanjutan, sentimen untuk bersaing harga demi penjualan mulai mereda, bergeser dari sebelumnya menggenjot pengiriman menjadi kini memprioritaskan perlindungan laba. Harga modul mulai menunjukkan kestabilan. Namun, dipengaruhi oleh laju penarikan modul efisiensi rendah dari gudang, pesanan berharga rendah masih ada di pasar, dan harga modul terdistribusi relatif beragam. Di sisi terpusat, tender proyek terbaru masih langka, dan pemulihan permintaan lebih lambat dari perkiraan.
30 Jul 2026 13:31
Futures paduan aluminium melonjak, kemudian tertekan dan terkoreksi, dengan harga aluminium spot ikut naik di tengah transaksi yang lesu [ulasan harga harian ADC12]
[Ulasan Harian Harga ADC12: Kontrak Berjangka Paduan Aluminium Melonjak, Tertekan lalu Mundur; Aluminium Spot Ikut dengan Perdagangan Lesu] Kontrak paduan aluminium 2609 dibuka pada 23.140 yuan/mt hari ini, dengan harga tertinggi intraday 23.290 yuan/mt dan terendah 23.055 yuan/mt.
30 Jul 2026 13:07
China Tempatkan Entitas Uni Eropa dalam Daftar Pantauan Kontrol Ekspor, Targetkan Rantai Pasokan Logam Tanah Jarang【Analisis SMM】
Pada 24 Juli 2026, Kementerian Perdagangan Tiongkok (MOFCOM) mengeluarkan Pengumuman No. 30 Tahun 2026, menempatkan 14 entitas berbasis UE—termasuk Lafert S.p.A., Rheinmetall AG, InPACT S.A., dan Vigo Photonics S.A.—dalam Daftar Pengawasan Pengendalian Ekspor. Pengumuman tersebut, yang dikeluarkan berdasarkan Undang-Undang Pengendalian Ekspor Republik Rakyat Tiongkok dan Peraturan Pengendalian Ekspor Barang-Barang Dual-Use, mewajibkan
29 Jul 2026 19:06
![AS Perketat Akses untuk Inverter Terhubung Baru: Apa Dampaknya terhadap Pasar Saat Ini? [Analisis SMM]](https://imgqn.smm.cn/usercenter/VEROo20251217171737.jpg)
AS Perketat Akses untuk Inverter Terhubung Baru: Apa Dampaknya terhadap Pasar Saat Ini? [Analisis SMM]
29 Jul 2026 16:48
![[Analisis SMM] Korea Selatan Rencanakan Deklarasi Ekspor Skrap Tembaga Lebih Ketat—Akankah Arus Perdagangan Asia Bergeser?](https://imgqn.smm.cn/usercenter/MXbup20251217171745.jpg)
[Analisis SMM] Korea Selatan Rencanakan Deklarasi Ekspor Skrap Tembaga Lebih Ketat—Akankah Arus Perdagangan Asia Bergeser?
29 Jul 2026 16:31
![[SMM Analysis] Biaya CBAM Mulai Berlaku, Kapasitas Verifikasi Tertinggal: Yang Perlu Diketahui Eksportir Baja Tahan Karat](https://imgqn.smm.cn/usercenter/yUOUz20251217171732.jpg)
[SMM Analysis] Biaya CBAM Mulai Berlaku, Kapasitas Verifikasi Tertinggal: Yang Perlu Diketahui Eksportir Baja Tahan Karat
29 Jul 2026 13:53
[Analisis SMM] Pajak Konsumsi Baterai Litium Baru Tiongkok: Dampak pada Sektor Sumber Daya Daur Ulang
28 Jul 2026 14:26
[Analisis SMM] Mengapa India Muncul sebagai Pembeli Aktif di Pasar Skrap Tembaga Global?
27 Jul 2026 15:45
Indonesia Dilaporkan Menahan Kargo Alumina karena Logam Tanah Jarang. Berikut Isi Peraturannya yang Sebenarnya.
27 Jul 2026 15:22
Berita Terbaru
Ferrokrom Menguat seiring Memudarnya Krom Mentah dalam Lonjakan Ekspor Mineral Zimbabwe 84,7%
31 Jul 2026 23:44
Dari Tailing ke Kebangkitan: Produksi Kromium Eastplats Melonjak Tiga Kali Lipat saat Tambang Crocodile River Memberikan Kemenangan Langka bagi Perusahaan PGM Junior
31 Jul 2026 21:58
【Analisis SMM】Tekanan Musim Sepi: Stok Si-Mn Menumpuk, Pemangkasan Produksi Akan Berlanjut
31 Jul 2026 21:07
Penindakan Penambangan Krom Ilegal di Limpopo Meluas: Penangkapan, Penyitaan Truk, dan Perampasan Aset Meningkat pada 2026
31 Jul 2026 19:52
Sentimen wait-and-see pasar tetap kuat, harga spot terus merosot perlahan [SMM SiMn Weekly Review]
31 Jul 2026 18:55
[SMM Tinjauan Mingguan Bijih Mangan] Kondisi pasar di luar negeri secara umum menurun ditambah dengan lemahnya permintaan sehingga para pedagang memilih untuk menjual dengan harga lebih rendah.
31 Jul 2026 18:51
Transaksi Stagnan, Tren Ferrochrome dan Bijih Krom Berbeda [SMM Analysis]
31 Jul 2026 18:44
Aluminum Alloy Futures Consolidated at Highs, Closed Lower in Late Trading; Spot Aluminum Quotes Steady [ADC12 Daily Price Review]
31 Jul 2026 15:54
Kekuatan harga didorong biaya, liburan gelombang panas menghambat permintaan, kenaikan ADC12 terbatas [Tinjauan Mingguan Skrap Aluminium dan Aluminium Sekunder]
31 Jul 2026 14:13
Penurunan Pasokan Akibat Kerugian Memanaskan Permainan Long-Short Silikon Industri [Analisis SMM]
31 Jul 2026 10:41
TCL Zhonghuan, Gokin Solar, Jinko, TrinaSolar, dan 6 Perusahaan Lainnya Masuk Daftar Pendek Prapkualifikasi Pemasok Modul PV 1 GW Shenzhen Energy
31 Jul 2026 10:31
Northam Platinum Bergabung dengan Sibanye-Stillwater & Bengwenyama dalam Meningkatkan Produksi Krom karena Produsen PGM Mengejar Sumber Pendapatan Baru
30 Jul 2026 20:45
Pasar Konsentrat Tantalum Nigeria: Harga, Kualitas, dan Pembeli
30 Jul 2026 20:16
Produksi di bawah tekanan, sisi pasokan menunjukkan penurunan marjinal; tren struktural berbeda untuk logam silikon [SMM Silicon Industry Weekly Review]
30 Jul 2026 19:03
Kedatangan rendah, terutama pengambilan kargo; stok sosial logam silikon melanjutkan tren pengurangan stok [SMM Silicon Inventory]
30 Jul 2026 18:00
GAM Luncurkan Proses Pemurnian Canggih, Meningkatkan Hasil Niobium Mutu Superkonduktor sebesar 18%
30 Jul 2026 17:59
Beberapa harga batu bara silikon individu masih mengalami sedikit penurunan, sementara pasar kokas minyak bumi melanjutkan konsolidasi dengan nada kuat [SMM Silicon Metal Raw Materials Weekly Review]
30 Jul 2026 16:50
Sebagian besar perusahaan monomer silikon menangguhkan penawaran, harga DMC melonjak kembali. [SMM Tinjauan Mingguan Silikon]
30 Jul 2026 16:37
Polisilikon Menanti Rencana Pertemuan Biaya, Harga Modul Stabil Didukung oleh Keinginan Melindungi Keuntungan [Tinjauan Mingguan SMM]
30 Jul 2026 13:31
Futures paduan aluminium melonjak, kemudian tertekan dan terkoreksi, dengan harga aluminium spot ikut naik di tengah transaksi yang lesu [ulasan harga harian ADC12]
30 Jul 2026 13:07