

News
Exclusive analysis articles with the latest market updates, and real-time news feeds.
China’s Spodumene Imports Rise 7% MoM in September, with Australia, Nigeria and Zimbabwe the Top Three Sources
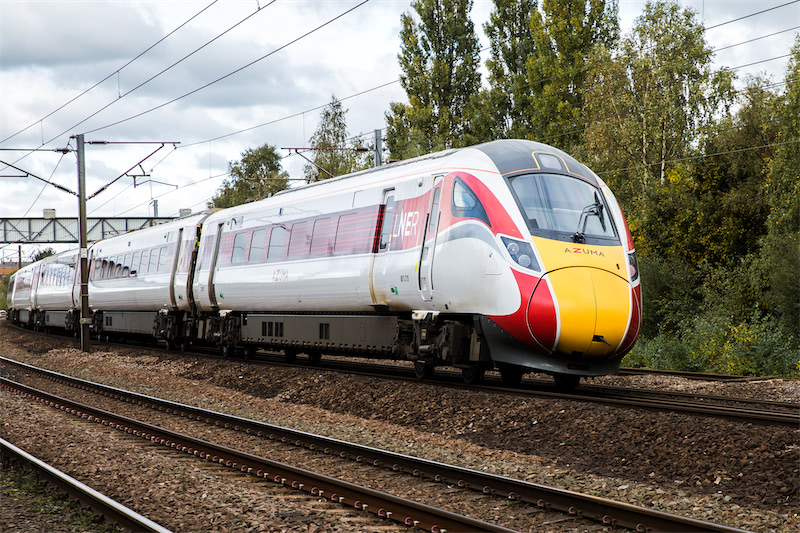
According to compiled Chinese customs data, China imported 970,100 physical tonnes of spodumene in September 2026, up approximately 7.0% from 906,600 tonnes in August. Based on the classification and assumed grades, moisture content and conversion factors used in this analysis, September imports represented approximately 81,300 tonnes of lithium carbonate equivalent (LCE). By origin, imports from Australia, Nigeria and Zimbabwe increased significantly. Australia remained the largest supplier, with shipments to China reaching 446,200 tonnes, up approximately 36.7% month on month and accounting for around 46.0% of total imports. Nigeria became the second-largest supplier at 189,800 tonnes, up approximately 40.1%, while imports from Zimbabwe rose approximately 83.0% to 136,500 tonnes. Imports from South Africa fell approximately 49.6% to 112,400 tonnes, whereas imports from Brazil increased approximately 30.9% to 81,200 tonnes. Smaller volumes came from Burundi, Rwanda and Mozambique, at approximately 1,800 tonnes, 1,300 tonnes and 1,000 tonnes, respectively, with limited shipments from Zambia and Somalia. No imports from Mali or Canada appeared in the September dataset. Overall, China’s spodumene imports continued to grow in September, with the composition shifting toward concentrate. Under the classification used in this analysis, concentrate imports reached approximately 688,800 tonnes, accounting for 71.0% of total physical imports, compared with 60.7% in August. Raw ore imports stood at approximately 281,300 tonnes. Increased concentrate imports from Australia, Zimbabwe and Nigeria offset lower imports from Mali and Canada, providing the main support for growth in China’s imported lithium resource supply during the month.
Oct 20, 2026 19:03 (GMT+8)
[SMM Analysis] Hoa Phat’s record HRC sales reshape Vietnam’s self-sufficiency and China’s export flows
Hoa Phat sold 5.47 Mt of hot-rolled coil in January to September, up 59% and about a third of Vietnam’s consumption, with 24.6% of third-quarter sales exported. Vietnam’s HRC demand of about 17.3 Mt this year still exceeds local output of about 10.8 Mt by 6.5 Mt, and new capacity arrives mainly after 2027. Anti-dumping duties have pushed mainstream Chinese coil out of Vietnam; Chinese mills now face Vietnamese coil in ASEAN and other third markets.
Oct 20, 2026 14:36 (GMT+8)
China's Rare Earth Magnet Exports Hit Record in September, Driven by Backlog Release and Regulatory Easing【SMM Analysis】
China’s September rare earth magnet exports hit a record 6,165 tonnes (+23% MoM), driven by clearance of July–August port backlogs, not new demand. US-China talks unblocked shipments, while EU “green channel” talks lifted Q4 forecast to ~5,700 tonnes/month. Large producers recovered fastest; small mills remain constrained.
Oct 20, 2026 16:06 (GMT+8)
Latest News
![[ SMM Analysis] September Battery Material Trade Data Released: Lithium Carbonate Imports Continued to Rise YoY, What About Other Segments?](https://imgqn.smm.cn/usercenter/BmqWy20251217171726.jpg)
[ SMM Analysis] September Battery Material Trade Data Released: Lithium Carbonate Imports Continued to Rise YoY, What About Other Segments?
Oct 23, 2026 19:22 (GMT+8)
![Cobalt product prices remain under pressure, with some enterprises in the cobalt salt market falling into losses. When will prices stop falling? [Weekly Observation]](https://imgqn.smm.cn/usercenter/AmiJU20251217171730.jpg)
Cobalt product prices remain under pressure, with some enterprises in the cobalt salt market falling into losses. When will prices stop falling? [Weekly Observation]
Oct 23, 2026 19:22 (GMT+8)

37 battery and new energy companies' report cards: highest growth of 19,540.5%! 6 turned losses into profits! Is the material chain the big winner again?
Oct 23, 2026 19:13 (GMT+8)
2 Billion! LFP Leader Expands Production Again
On the evening of October 19, LFP leader Hunan Yuneng disclosed an investment plan to build the Phase VI LFP project in Heling Town, Yuhu District, Xiangtan, with a total investment of no more than 2 billion yuan, funded entirely by the company itself. The announcement noted that Xiangtan has a solid foundation for battery materials industry clustering and complete industrial supporting facilities, which is conducive to project production and operations. The project has a total building area of approximately 80,000 m² and a construction period of 12 months. It will mainly involve the construction of new production plants, supporting public works such as plant roads, power facilities, fire protection and security, and environmental protection treatment, as well as the procurement of complete LFP production line equipment.
Oct 23, 2026 16:40 (GMT+8)
[SMM Cobalt-Lithium Morning Meeting Summary] Market demand remains persistently weak, supply-demand imbalance intensifies, raw material prices fall under pressure
The industry chain remained weak overall this week, with raw material prices continuing to decline, end-use demand falling short of expectations, and the market supply-demand imbalance becoming more pronounced. Battery-grade lithium carbonate averaged below 100,000 yuan/mt, at 99,350 yuan/mt, down 2.7% week-on-week, with supply continuing to increase and downstream purchasing turning more cautious. Refined cobalt prices consolidated around 230,000 yuan/mt, with low import data and production cut rumours briefly lifting sentiment, but fundamentals remained weak. Cobalt sulphate prices approached the 40,000 yuan/mt mark, while nickel sulphate saw weak supply and demand, keeping prices under pressure. In cathode materials, ternary cathode material and LFP prices fell in tandem, with EV and ESS orders slowing and enterprise inventory pressure rising. Anode and separator prices remained stable, with separator supply tight and further room for price increases ahead. Electrolyte prices are likely to gradually weaken due to lower raw material costs. Demand in the sodium-ion battery industry chain was relatively steady, with top-tier players maintaining high operating rates. Overall, the industry chain has entered a phase of cooling demand and inventory adjustment, with prices expected to consolidate on a subdued note in the short term.
Oct 23, 2026 15:34 (GMT+8)
[SMM Cobalt Morning Meeting Summary] Industry Chain Prices Remain Under Pressure, End-use Demand Weakness Drags Market Trend
The cobalt industry chain remained weak overall this week, with falling raw material prices and sluggish end-use demand continuing to weigh on the market. Refined cobalt temporarily stabilised, supported by low import data and rumours of MHP production cuts, with prices consolidating around 230,000 yuan/mt, though actual demand showed no improvement. Trading in the cobalt intermediate products market stalled, with September imports up 78% MoM and the share of bonded logistics rising to 65.5%, while actual circulating supply remained limited. The cobalt sulphate price center shifted lower, with 40,000 yuan/mt becoming a key psychological level; cobalt chloride and Co3O4 continued to grind lower, with losses and inventory pressure intensifying. Cobalt powder transaction prices fell to around 285,000 yuan/mt, and the stabilisation of tungsten carbide prices may drive some subsequent restocking. Downstream ternary cathode precursor, ternary cathode material, and LCO prices weakened in tandem, with insufficient orders and slow inventory destocking, while November production schedules are expected to decline. On the policy front, GFEX flagged lithium carbonate price fluctuation risks, and the national standard for in-service power battery testing will take effect in March 2027. Overall, the market is expected to remain weak in the short term, with demand recovery being the key to price stabilisation.
Oct 23, 2026 15:30 (GMT+8)
【SMM Flash】Zhuhai CosMX Discloses Major Shareholder Stake Reduction Result
【Zhuhai CosMX Discloses Shareholder Stake Reduction Result】Zhuhai CosMX Battery disclosed the stake reduction result of a shareholder holding more than 5% of its shares. Ningbo Huijincheng Venture Investment Partnership (Limited Partnership) reduced its holding by 21,440,812 shares in aggregate between August 17 and October 21, 2026, via centralized bidding and block trades, representing 1.88% of total share capital, at prices ranging from CNY 12.99 to CNY 15.43 per share, with total consideration of CNY 297.78 million. Following the reduction, the shareholder’s holding decreased from 78,354,828 shares (6.88% of total share capital) to 56,914,016 shares (5.00%). The reduction plan was first disclosed on June 30, 2026, with an original plan to reduce no more than 22,765,592 shares (up to 2.00% of total share capital); the actual reduction fell short of the plan ceiling by 1,324,780 shares and was not completed in full, nor terminated early. The company’s controlling shareholder and actual controller remain unchanged.
Oct 22, 2026 20:58 (GMT+8)
[SMM Analysis] Cost Inversion Fails to Halt Slide as Cobalt Salt Weakness Spreads Down the Chain
Oct 22, 2026 20:43 (GMT+8)
[SMM Analysis] Cobalt Market Weekly Review: News-Driven Warmth Can't Offset Fundamental Chill
Oct 22, 2026 18:24 (GMT+8)
[SMM Analysis] Cobalt Market Weekly Review: Positive News Fails to Offset Weak Fundamentals, Cobalt Market Diverges and Declines: Metal Stabilises, Salts and Powders Plunge
Oct 22, 2026 18:16 (GMT+8)
Solid-State Batteries Under the 2027 Consensus: EVE Energy and Chery, Two Representative Players, Unveil Products
Oct 22, 2026 17:37 (GMT+8)
"Lithium Carbonate Prices Drop Below 100,000 Yuan/mt; Supply Growth Outpaces Declining Demand"
Oct 22, 2026 17:34 (GMT+8)
![[SMM Analysis] Ternary Cathode Production Schedules May Continue to Decline Going Forward](https://imgqn.smm.cn/usercenter/fblvS20251217171729.png)
[SMM Analysis] Ternary Cathode Production Schedules May Continue to Decline Going Forward
Oct 22, 2026 17:27 (GMT+8)
[SMM Analysis] Ternary Cathode Production Schedule May Continue to Decline
Oct 22, 2026 17:26 (GMT+8)
[Lithium battery: Shanshan plans RMB 4 billion private placement for 150kt anode base]
Shanshan announced a private share placement to its indirect controlling shareholder Conch Group, which will subscribe in full with cash, raising up to RMB 4 billion. Part of the proceeds will fund a 150,000-ton-per-year lithium battery anode integrated base in Baotou, Inner Mongolia, with planned investment of RMB 5.106 billion and 50,000 tons of supporting graphitization capacity; RMB 1.5 billion will supplement working capital.
Oct 22, 2026 17:05 (GMT+8)
[Lithium battery: Do-Fluoride Q1-Q3 net profit up 659% YoY to RMB 592 million]
Do-Fluoride released its Q3 2026 report, with revenue of RMB 10.927 billion for the first three quarters, up 62.39% YoY, and net profit attributable to shareholders of RMB 592 million, up 658.72% YoY. The company said the growth was mainly driven by rising revenue from its new energy materials and battery segments.
Oct 22, 2026 17:05 (GMT+8)
GM Plans LMR Prismatic Batteries From LG Energy Solution Joint Venture for Fourth-Generation EV Platform
GM outlined its fourth-generation EV platform at the GM Forward event in New York on October 21 local time. The platform will use lithium manganese-rich (LMR) prismatic cells to be manufactured by Ultium Cells, its joint venture with LG Energy Solution, in Spring Hill, Tennessee.
GM’s design target is 33% greater energy density than LFP batteries at a comparable cost. Combining the new batteries, propulsion systems and aerodynamics, the company also targets approximately 20% more driving range per kilowatt-hour than its current vehicles.
The new drive units are designed with 40% fewer internal components, while the electrical architecture reduces wiring length by 30%.
Oct 22, 2026 16:55 (GMT+8)
This week, second-life application market prices pulled back, with weakening costs driving looser quotes [SMM Weekly Review]
This week, second-life application market prices began to pull back, with overall trading sentiment remaining subdued. The continued weakening of raw materials on the cost side is the core driver behind this round of price softening. Raw materials on the cost side extended their downward pattern, with divergence in the pace of movement across categories. Lithium carbonate maintained a downward trend overall this week; cobalt sulphate fell notably at the start of the week before gradually stabilising; nickel sulphate continued its earlier grind lower, further weakening cost support for second-life products overall. The supply side showed no significant changes, with stable circulation pace across categories and a steady market supply state, with no extreme situations such as concentrated volume releases or tightening supply. The demand side showed no clear improvement, and combined with falling cost-side prices dragging market expectations weaker, previously stable quotes began to loosen and move lower. In the short term, if cost-side prices continue to pull back, the likelihood of further downside in second-life application market prices is relatively high.
Oct 22, 2026 16:18 (GMT+8)
[SMM Weekly Review] This week in new energy hydrometallurgical disassembly recycling: lower raw material prices dragged down the overall recycled materials market
Raw material side: At the start of this week, lithium carbonate prices held around 100,000 yuan/mt; on Wednesday, futures prices fell sharply, and as of October 22, quotes were down roughly 3,000 yuan from the start of the week. Nickel sulphate prices weakened slightly during the week before stabilising, with the decline slowing; cobalt sulphate, pressured by sluggish demand, fell quickly at the start of the week and then gradually stabilised.
By material type, LFP hydrometallurgy recycling side: Taking LFP electrode black mass as an example, battery black mass prices moved lower overall, while electrode black mass prices fluctuated more noticeably due to expectations of falling lithium carbonate and the impact of the LFP repair market. The high-premium sentiment for LFP electrode repair material gradually returned to rationality, and downstream acceptance of current prices per % lithium declined further. However, because front-end powder producers were clearly holding back from selling due to cost support, market tug-of-war sentiment remained strong. Meanwhile, as LFP electrode repair prices gradually converged toward market prices, the price spread between repair material and battery black mass narrowed further, and the spread between LFP electrode black mass and battery black mass has returned to a historically reasonable range. Ternary and LCO recycling side: Ternary electrode black mass payables continued to grind lower as nickel, cobalt, and lithium chemical prices weakened in turn. Affected by the recent decline in cobalt prices and persistently low downstream demand, cobalt payables in some downstream quotes began to show a trend of weakening independently. Cobalt and lithium payables for LCO black mass were similarly dragged down by weaker cobalt and lithium material prices and sluggish cobalt demand, and downstream purchase quotes fell further and more rapidly. However, supported by earlier procurement costs, some holders were unwilling to concede at low prices, resulting in a wide price spread between upstream and downstream quote payables. Market transactions were sluggish, with LCO black mass demand significantly lower than that for LFP and ternary materials.
Oct 22, 2026 16:16 (GMT+8)
Electrolyte prices remained stable this week (2026.10.19-10.22) [SMM lithium battery electrolyte market weekly review]
[SMM Lithium Battery Electrolyte Market Weekly Review: Electrolyte Prices Remain Stable This Week, 2026.10.19-10.22] From October 19 to October 22, 2026, electrolyte prices remained stable. The future market trend of electrolyte prices still needs continuous tracking of raw material price fluctuations and their transmission.
Oct 22, 2026 16:02 (GMT+8)

Early Bird Bookings Now Open for 2027 SMM LZE (22nd) Lead & Zinc Conference and Industry Expo in Yunnan next March
——From Conference to Expo · Doubled Scale · Full Upgrade—— [What This Article Brings You] ① Exhibition Introduction ② How to Register ③ First Batch of Exhibitors ④ Conference Agenda I. Doubled Scale, Full Upgrade! In 2026, lead and zinc face sharp volatility—elevated lead prices, scarce high-purity lead, record high LME low-grade lead stocks, lead-acid battery relocation from China to overseas, deeply negative zinc concentrate TCs, tight high-quality imported zinc ore, open export window for zinc ingots, and overseas zinc smelter buildout. The LZE covers market outlook, price forecast, equipment technology, recycling, and downstream applications—driving green transformation and win-win growth. What sets the 2027 (22nd) LZE apart from earlier events is its transformative upgrade: moving from a pure industry conference to a seamlessly combined conference and industry expo — deliver a larger-scale gathering, an expanded industry showcase and far-reaching involvement across the entire lead and zinc value chain. From industry trend analysis to in-depth industry chain exchanges, from upstream and downstream supply-demand matching to concentrated enterprise showcases, from a single industry conference to the further integration of "conference + industry expo"——in 2027, SMM LZE enters the "expo" era! The conference will embrace its 22nd edition with a larger scale, a richer industry lineup, and broader upstream and downstream participation! Scan the QR Code Below to Register as A Visitor for Free 1. Conference Scale Delegation: 6,000+ (up 71.4% from the previous edition) Companies: 2,000+ (up 100% from the previous edition) Exhibitors: 120+ (up 50% from the previous edition) Supply-demand matchmaking: 300+ (up 50% from the previous edition) Dedicated Forums: 7 (1 more than the previous edition) 2. Participant Groups 20% - Miners 23% - Smelters 22% - Processing enterprises 10% - Traders 5% - Lead-zinc end-user procurement 15% - Third-party equipment, technology, auxiliary materials, media, etc. 3% - Government, associations, university research institutions 2% - Financial and futures firms 3. Job Title Breakdown 4. Conference Highlights Price trends, consumption outlook, and policy interpretation Global dialogue on the lead-zinc industry and go-global strategies One-on-One Business Meetings Exploring Breakthrough Paths in Mining & Metallurgy Technology and Resource Recycling Showcase of Cutting-Edge Equipment and Consumables II. Four Identities, One Lead-Zinc Exhibition Whether you are here for market insights, procurement, showcasing or brand exposure, you will find a participation option that suits you. 1. Professional Visitors (Explore the exhibition for business opportunities and connect with the upstream and downstream of the industry) [Visitor Benefits] Exhibition Area Ticket On-site Check-in Gifts SMM Exclusive Lead-Zinc Industry Distribution Map Lead-Zinc Industry Visitor Exchange Group Group Benefits Tickets for Some Forums …… 2. Conference Delegates (Gain insights into new trends and discuss the lead-zinc market) [Delegate Benefits] Exhibition Area Ticket On-site Check-in Gifts SMM Exclusive Lead-Zinc Industry Distribution Map Lead-Zinc Industry Visitor & Conference Exchange Group Ticket for All Forums of the Conference Executive Dinner Voucher Lunch and Dinner Vouchers During the Conference Enterprise Directory Expert Reports 1-on-1 Supply-Demand Matching Post-Conference Field Trip Activities …… 3. Exhibitor (Step onto the industry stage and showcase your strengths) [18㎡ Custom Booth] [Benefits] Design & construction of all materials for the 18㎡ booth, tables, chairs, sofa & reception desk, TV, 5 conference passes, X-banner stand*1, conference booklet color page*1, LOGO display, multi-platform online exposure and promotion, supply-demand 1-on-1 matchmaking, long-term cooperation support from SMM, etc. [9㎡ Premium Booth] [Benefits] Design & construction of all materials for the 9㎡ booth, printed backdrop wall & reception desk & tables and chairs, TV, 3 conference passes, X-banner stand*1 or conference booklet color page*1, LOGO display, multi-platform online exposure and promotion, supply-demand 1-on-1 matchmaking, long-term cooperation support from SMM, etc. [6㎡ Standard Booth] [Benefits] Design & construction of all materials for the 6㎡ booth, one long table & two chairs, 2 X-banner stands with different content, 2 conference passes, multi-platform online exposure and promotion, supply-demand 1-on-1 matchmaking, long-term cooperation support from SMM, etc.
Oct 22, 2026 09:59 (GMT+8)

2027 Global Aluminum Supply-Demand Outlook: High Margins Drive Expansion, Shifting the Market from Tight to Loose
Oct 21, 2026 09:41 (GMT+8)
Chinese $6Billion Battery Investment in Morocco Reshapes EU Lithium Demand Amid Tariff Shifts
Oct 20, 2026 17:02 (GMT+8)
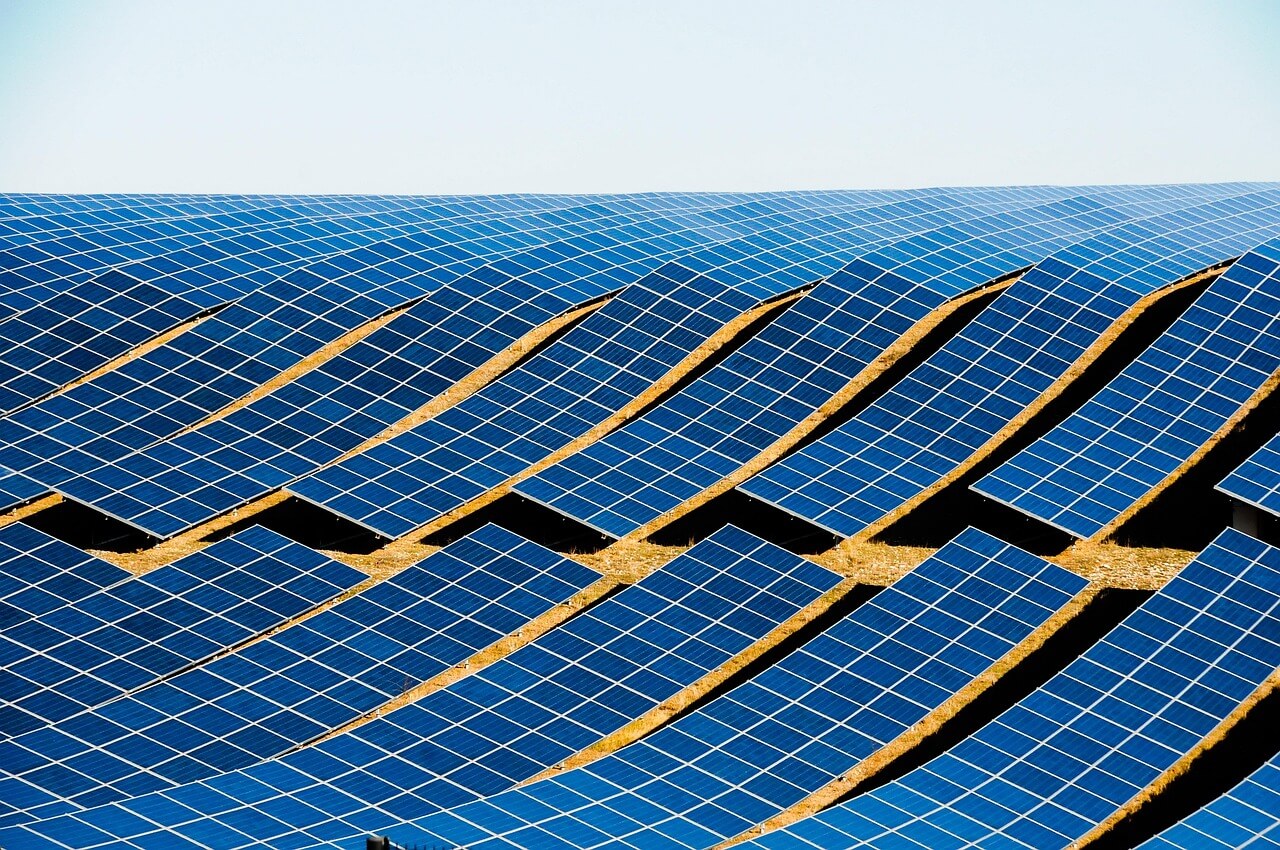
N-Type vs. P-Type Solar PV Modules: What Sets Them Apart, and Why Is N-Type Gaining Ground in the Global Market?
Oct 21, 2026 09:45 (GMT+8)
China’s Spodumene Imports Rise 7% MoM in September, with Australia, Nigeria and Zimbabwe the Top Three Sources
Oct 20, 2026 19:03 (GMT+8)
![[SMM Analysis] Hoa Phat’s record HRC sales reshape Vietnam’s self-sufficiency and China’s export flows](https://imgqn.smm.cn/usercenter/MhPNV20251217171716.jpg)
[SMM Analysis] Hoa Phat’s record HRC sales reshape Vietnam’s self-sufficiency and China’s export flows
Oct 20, 2026 14:36 (GMT+8)
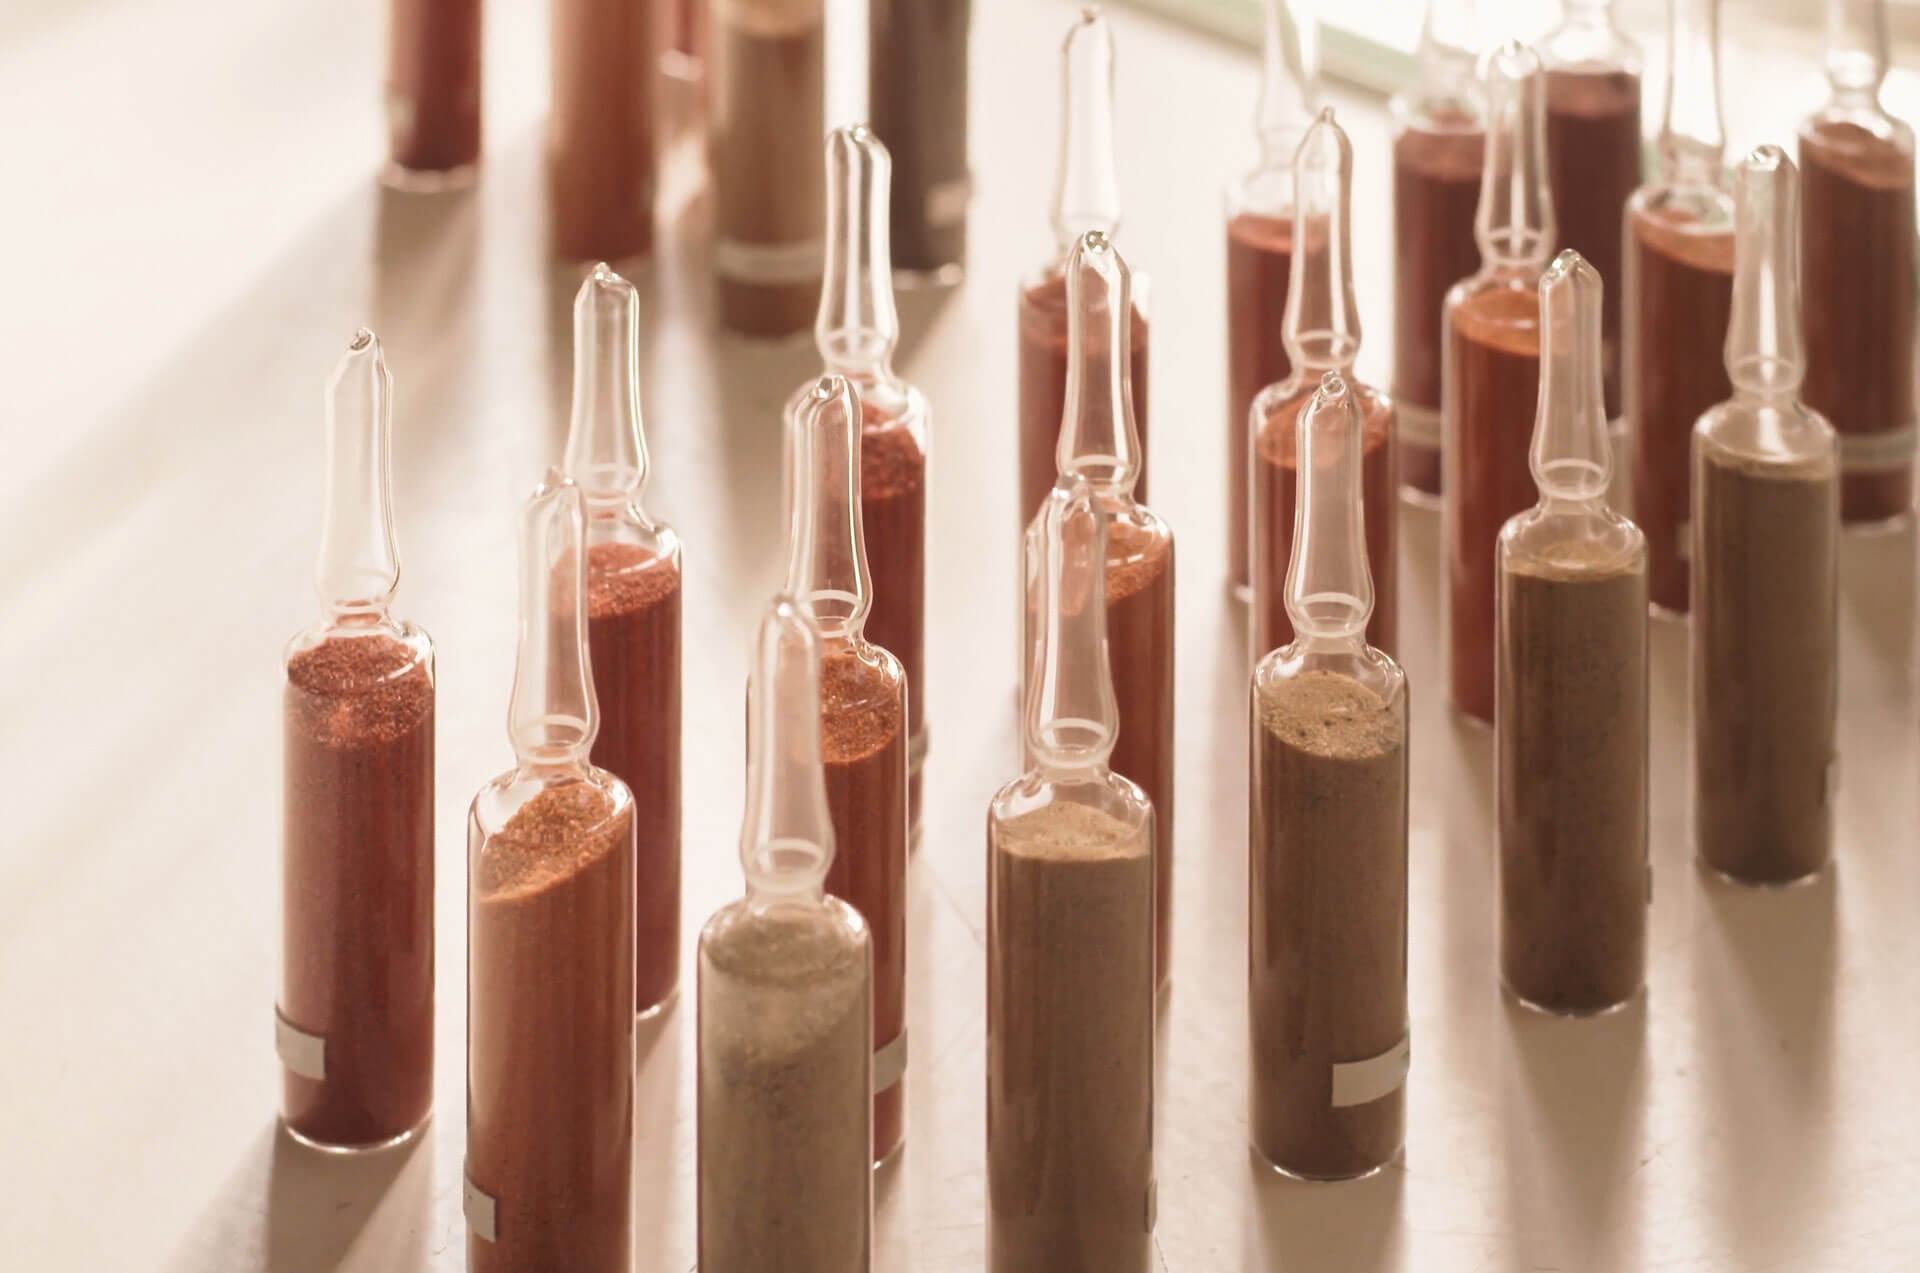
China's Rare Earth Magnet Exports Hit Record in September, Driven by Backlog Release and Regulatory Easing【SMM Analysis】
Oct 20, 2026 16:06 (GMT+8)
Latest News
[ SMM Analysis] September Battery Material Trade Data Released: Lithium Carbonate Imports Continued to Rise YoY, What About Other Segments?
Oct 23, 2026 19:22 (GMT+8)
Cobalt product prices remain under pressure, with some enterprises in the cobalt salt market falling into losses. When will prices stop falling? [Weekly Observation]
Oct 23, 2026 19:22 (GMT+8)
37 battery and new energy companies' report cards: highest growth of 19,540.5%! 6 turned losses into profits! Is the material chain the big winner again?
Oct 23, 2026 19:13 (GMT+8)
2 Billion! LFP Leader Expands Production Again
Oct 23, 2026 16:40 (GMT+8)
[SMM Cobalt-Lithium Morning Meeting Summary] Market demand remains persistently weak, supply-demand imbalance intensifies, raw material prices fall under pressure
Oct 23, 2026 15:34 (GMT+8)
[SMM Cobalt Morning Meeting Summary] Industry Chain Prices Remain Under Pressure, End-use Demand Weakness Drags Market Trend
Oct 23, 2026 15:30 (GMT+8)
【SMM Flash】Zhuhai CosMX Discloses Major Shareholder Stake Reduction Result
Oct 22, 2026 20:58 (GMT+8)
[SMM Analysis] Cost Inversion Fails to Halt Slide as Cobalt Salt Weakness Spreads Down the Chain
Oct 22, 2026 20:43 (GMT+8)
[SMM Analysis] Cobalt Market Weekly Review: News-Driven Warmth Can't Offset Fundamental Chill
Oct 22, 2026 18:24 (GMT+8)
[SMM Analysis] Cobalt Market Weekly Review: Positive News Fails to Offset Weak Fundamentals, Cobalt Market Diverges and Declines: Metal Stabilises, Salts and Powders Plunge
Oct 22, 2026 18:16 (GMT+8)
Solid-State Batteries Under the 2027 Consensus: EVE Energy and Chery, Two Representative Players, Unveil Products
Oct 22, 2026 17:37 (GMT+8)
"Lithium Carbonate Prices Drop Below 100,000 Yuan/mt; Supply Growth Outpaces Declining Demand"
Oct 22, 2026 17:34 (GMT+8)
[SMM Analysis] Ternary Cathode Production Schedules May Continue to Decline Going Forward
Oct 22, 2026 17:27 (GMT+8)
[SMM Analysis] Ternary Cathode Production Schedule May Continue to Decline
Oct 22, 2026 17:26 (GMT+8)
[Lithium battery: Shanshan plans RMB 4 billion private placement for 150kt anode base]
Oct 22, 2026 17:05 (GMT+8)
[Lithium battery: Do-Fluoride Q1-Q3 net profit up 659% YoY to RMB 592 million]
Oct 22, 2026 17:05 (GMT+8)
GM Plans LMR Prismatic Batteries From LG Energy Solution Joint Venture for Fourth-Generation EV Platform
Oct 22, 2026 16:55 (GMT+8)
This week, second-life application market prices pulled back, with weakening costs driving looser quotes [SMM Weekly Review]
Oct 22, 2026 16:18 (GMT+8)
[SMM Weekly Review] This week in new energy hydrometallurgical disassembly recycling: lower raw material prices dragged down the overall recycled materials market
Oct 22, 2026 16:16 (GMT+8)
Electrolyte prices remained stable this week (2026.10.19-10.22) [SMM lithium battery electrolyte market weekly review]
Oct 22, 2026 16:02 (GMT+8)