News

Exclusive analysis articles with the latest market updates, and real-time news feeds.

Milestone Hit: China NEV Penetration Rate Tops 50%, Yet Full‑Year Sales Projected to Dip
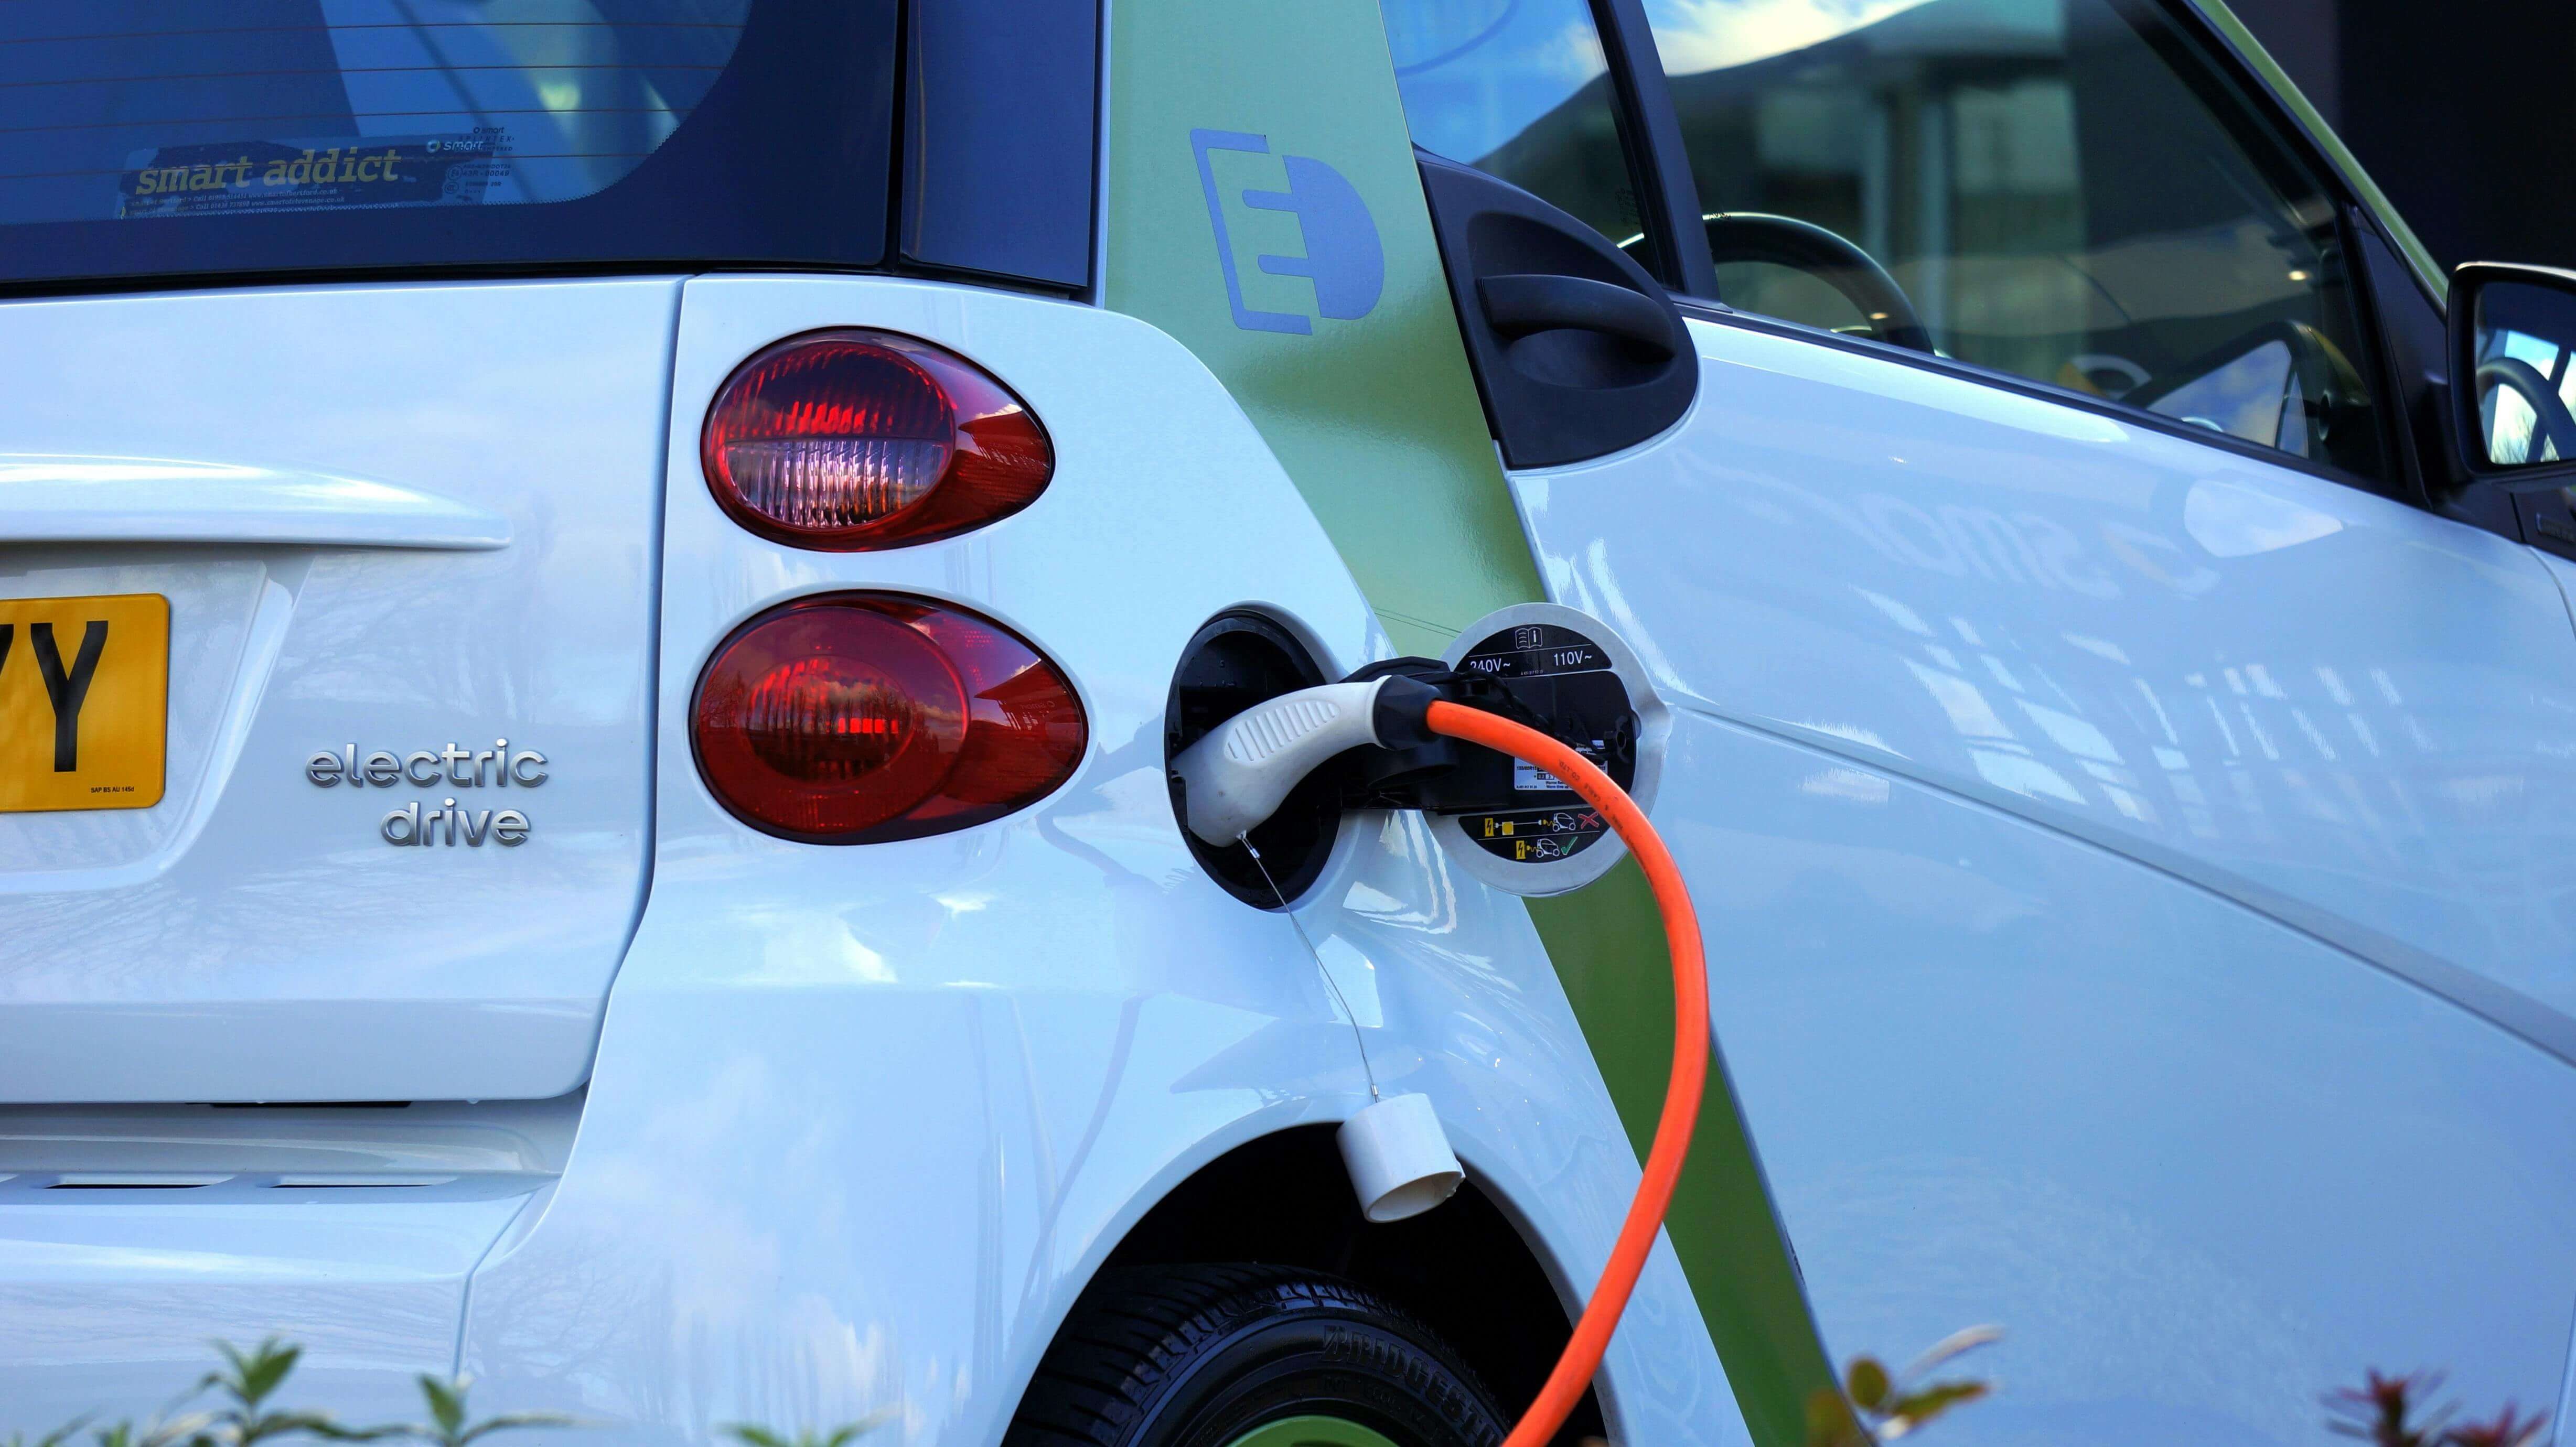
NEV Penetration Rate Surpasses 50% for First Time in July, Exports Continue High Growth In July, China's auto sales were about 2.584 million units, down 8% MoM and down 0.3% YoY. Of this total, NEV sales were 1.561 million units, down 5% MoM and up 23.7% YoY. Notably, this was the first time that China's NEV sales penetration rate (without distinguishing between passenger and commercial vehicles or between exports and domestic sales) exceeded 50% — meaning that one of every two vehicles sold in the market was an NEV — marking the formal transition of NEVs from a policy-driven "supplementary choice" to a market-driven "mainstream choice" and a structural turning point of milestone significance in the energy transition of China's automotive industry. Broken down by domestic sales and exports: Domestic Sales: Clear Seasonal Pullback, Accelerating Contraction of Traditional Fuel Vehicles In July, domestic auto sales were 1.541 million units, down 13.1% MoM and down 23.6% YoY. Of this total, domestic sales of traditional fuel vehicles were 533,000 units, down 18.4% MoM and down 45.7% YoY; the decline widened further, reflecting that NEV models are replacing the share of traditional fuel vehicles in the Chinese market at an accelerating pace. Domestic NEV sales were 1.008 million units, down 10% MoM and down 2.8% YoY, with a penetration rate of about 65%. By segment, domestic passenger NEV sales were 916,000 units, down 9% MoM and down 6.1% YoY; domestic commercial NEV sales were 92,000 units, down 18.8% MoM and up 48.8% YoY, continuing the rapid growth trend. In July, domestic sales showed a clear seasonal pullback, mainly due to two factors: first, automakers' concentrated sales pushes around the previous half-year period had released some demand in advance; second, extreme weather nationwide, such as high temperatures and typhoons, curbed offline sales activities. Exports: High Growth Continues, PHEV Growth Leads In July, auto exports were 1.043 million units, up 0.6% MoM and up 81.3% YoY. Of this total, NEV exports were 553,000 units, up 5.7% MoM and up by 1.5 times YoY; the export penetration rate reached 53% and has exceeded 50% for two consecutive months . By technology route, battery electric vehicle exports were 331,000 units, accounting for about 60% and up by 1.4 times YoY; plug-in hybrid vehicle exports were 222,000 units, up by 1.6 times YoY. In terms of annual growth, plug-in hybrid vehicles performed more prominently and are expected to continue expanding their share in the export market. Market Outlook: Domestic Sales Under Pressure, Exports Promising Looking ahead, domestic NEV sales still face certain pressure. Although H2 will enter the traditional sales peak season, against the current backdrop of no new policy incentives, overall growth room is expected to be limited, and full-year domestic sales are still expected to decline by more than 10% YoY. Export side, automakers generally view exports as a core source of future growth; the export market is expected to continue expanding (currently, NEV exports account for about 35%), becoming the main driver of growth for China's NEV industry.
Aug 18, 2026 17:53
Milestone Hit: China NEV Penetration Rate Tops 50%, Yet Full‑Year Sales Projected to Dip
Solar Cells in the Eye of the Section 232 Storm: How Long Can a Trader-Driven Rally Last?【SMM Analysis】
Since the beginning of August, China’s solar cell market has staged a sharp reversal. TOPCon cell prices bottomed out in late July and rebounded rapidly. Compared with the lows seen from late July to early August, mainstream prices as of August 18 had risen by more than 20% across major formats, with gains in some specifications approaching 30%. The rally was initially supported by a rising cost floor. Since mid-August, however, the pace of price increases has clearly exceeded what can be explained by cost recovery alone. Following the rollout of the U.S. Section 232 measures, expectations for front-loaded procurement across supply chains serving the U.S. market have intensified. Traders have increasingly become marginal buyers of higher-priced cells, further amplifying gains in the spot market. In contrast, domestic module manufacturers remain reluctant to accept current high cell prices. This means that while the market is being supported by the policy window and export-related stockpiling, whether the rally can evolve from a short-term move into a more sustainable uptrend will ultimately depend on whether higher cell costs can be passed through to module prices and whether domestic demand can take over once the policy-driven export window begins to close. Current Market: Cost Recovery Sets the Floor, Export Stockpiling Amplifies the Rally The market began to reverse rapidly in August. According to SMM data, as of August 18, mainstream price ranges for TOPCon G12R, M10 and G12 cells had risen to RMB 0.316-0.367/W, RMB 0.316-0.367/W and RMB 0.319-0.352/W, respectively. Offers for some G12R and M10 cells briefly reached around RMB 0.38/W. Costs provided the initial foundation for the rebound. Since late July, stronger expectations for higher polysilicon prices, a rapid recovery in wafer prices, and rising costs for silver paste and other auxiliary materials have jointly lifted the cost floor for solar cells and strengthened producers’ willingness to hold firm on offers. However, cost movements can largely explain why prices were able to rebound from low levels; they do not fully explain the pace of gains since mid-August. The stronger driver behind the acceleration has been rapidly rising expectations for advance procurement following the rollout of the U.S. Section 232 measures. On August 6, the United States formally announced Section 232 measures covering polysilicon and its derivatives. The measures set minimum import prices of $0.22/W for solar cells and $0.38/W for solar modules. They will take effect at 12:01 a.m. U.S. Eastern Time on December 4, 2026, for covered products entered for consumption or withdrawn from warehouse for consumption. Certain polysilicon derivatives listed in the announcement will also be subject to additional ad valorem duties. The transition period between the announcement and implementation has prompted front-loaded procurement and inventory building across the Asian solar supply chain serving the U.S. market. Based on current transaction patterns, this incremental demand is becoming an increasingly important marginal driver in the spot market. According to feedback from supply-chain traders surveyed by SMM, the market could see around 15-20 GW of solar cell stockpiling demand during the policy window, with traders also emerging as key buyers of some higher-priced material. It is important to stress that the 15-20 GW figure remains an industry survey estimate and market expectation. It does not represent volumes that have already been contracted, prepaid, assigned shipping schedules or exported. Only if a substantial portion of this expected demand is ultimately converted into actual purchase orders will it materially affect near-term cell shipment flows and spot inventories. Module Makers: Domestic Demand May Take Over, but Acceptance of High Cell Prices Remains Limited Compared with traders, domestic module manufacturers remain cautious about purchasing high-priced cells. On the one hand, domestic project demand is expected to improve in Q4, which could support a sequential recovery in module production schedules and cell procurement. On the other hand, module producers remain constrained by end-market tender prices, project returns and their own inventory positions. At present, module makers generally view RMB 0.33-0.35/W as a more acceptable procurement range for solar cells. In terms of cost pass-through, solar cells have responded relatively quickly in the current round of price increases, but whether module prices can rise in tandem remains uncertain. If module selling prices fail to absorb the increase in cell costs, module producers are more likely to delay procurement, reduce safety inventories, prioritize internally produced cells or adjust production schedules rather than continue chasing higher-priced external supply. This is likely to lead to greater market segmentation. Cell producers with well-secured export orders may be able to maintain firmer offers, while standard domestic orders and more abundantly supplied formats may remain subject to pricing pressure from module makers. As a result, the current rally is more likely to remain structural rather than develop into a synchronized increase across all formats and all producers. Why Could Mid-October Become a Key Turning Point? It is worth noting that the Section 232 measures do not provide an unrestricted window for imports ahead of implementation. The U.S. presidential proclamation also states that if the Secretary of Commerce determines that a company has stockpiled polysilicon or its derivatives before the measures take effect, the department may coordinate with U.S. Customs and Border Protection to impose import restrictions. Advance procurement by traders therefore should not be viewed as risk-free front-loading. How U.S. authorities distinguish between normal inventory preparation and policy-avoidance stockpiling, as well as how strictly the provision is ultimately enforced, could also affect actual shipment flows. The Section 232 measures are scheduled to take effect on December 4, 2026. According to trader feedback, arranging shipments from China or other major Asian production hubs, completing ocean freight and clearing U.S. customs generally requires at least around 40-45 days. Working backward from the implementation date, shipments intended to enter the U.S. before the new measures take effect may therefore need to depart by around mid-October to provide a more comfortable logistics buffer. From a procurement perspective, the closer the market gets to mid-October, the less time remains to arrange new export orders, which could gradually reduce traders’ willingness to chase higher prices. Assuming no major changes in logistics conditions, trader purchasing patterns or subsequent U.S. implementation rules, the market could follow a baseline pattern in which export-related stockpiling continues to support orders and prices through August and September. As the available shipping window narrows and compliance risks rise in October, new inquiries may gradually decline. If incremental export procurement weakens materially by mid- to late October, domestic module producers could once again become more influential in setting solar cell prices. Q4 Outlook: Domestic Demand May Provide a Floor, but Correction Risks Rise After October From a supply-demand perspective, the solar cell market could see two distinct phases of demand in Q4. The first phase is concentrated procurement linked to front-loaded exports. Such orders tend to be released quickly and are highly sensitive to delivery timing. Traders may be willing to pay a certain premium to secure product within the available policy window, helping reduce inventories at cell producers and providing continued support to prices. The second phase would depend more heavily on domestic demand. Q4 project deliveries could lift module production schedules and, in theory, increase solar cell consumption. However, domestic module producers are much more cost-sensitive than traders purchasing against a time-limited export window. Their procurement is more closely tied to immediate production needs, and they are less willing to absorb elevated prices. In other words, stronger domestic demand could provide downside support, but may not be sufficient to sustain the high prices created during the export-driven procurement window. Based on this logic, SMM expects solar cell prices to remain relatively firm through August and September, while upward momentum could gradually weaken after entering October. If new export orders begin to decline from early October while module producers continue to resist higher prices, the probability of a downward shift in transaction prices will increase in mid- to late October. The scale of any correction will depend on the actual volume purchased by traders, incremental production at cell manufacturers and the strength of domestic module demand. At the same time, if a substantial portion of the expected 15-20 GW of stockpiling demand is converted into trader purchases but downstream consumption ultimately lags the pace of earlier inventory building, stock pressure could increase once the policy window closes. If part of the material remains in trader inventories or overseas warehouses, subsequent channel restocking demand may effectively have been pulled forward, potentially weakening export orders further in November and December. Three Indicators to Watch First, changes in the volume and pricing of solar cell purchases by module manufacturers. If higher-priced transactions remain concentrated among traders while module makers continue to procure only on a low-inventory, just-in-time basis, the rally will still lack sustained downstream support. Second, cell producer inventories and production schedules. If manufacturers rapidly increase output in response to stronger export orders, but the additional production encounters weaker export demand after October, inventories could begin building again and amplify downward price pressure. Third, order divergence among different cell formats. High-efficiency products and formats better suited to export demand may remain relatively firm, while more abundantly supplied products primarily serving the domestic market could feel pricing pressure from module makers earlier. Overall, the impact of the current Section 232-driven market on China’s solar cell sector can be summarized as “near-term export-led destocking, a shift in demand drivers around October, and a return to domestic fundamentals in Q4.” With traders still driving a significant share of high-priced procurement and module producers yet to broadly accept current cell prices, the rally remains clearly cyclical and structural in nature. As the front-loading window narrows after mid-October, the risk of a correction in solar cell prices is likely to rise materially.
Aug 18, 2026 18:37
[SMM Analysis] Global Lithium-ion Battery Industry Navigates Capacity Switch Between ESS and EV
[SMM Analysis] Global Lithium-ion Battery Industry Navigates Capacity Switch Between ESS and EV
The Global lithium-ion battery manufacturing landscape is undergoing a distinctive pattern of demand-driven capacity reallocation. Rather than a structural migration, the industry is experiencing flexible production switching between energy storage systems (ESS) and electric vehicle (EV) power batteries—driven by policy incentives, demand cycles, and the differing economics of each segment. In 2025, global lithium-ion battery production exceeded 2100 GWh, with power battery drawing near 1,500 GWh and energy storage battery production near 550 GWh . By 2026, total lithium battery production are projected to grow approximately 56% year-on-year to over 3,300 GWh, with energy storage lithium battery production expected to exceed 1,000GWh. Within this rapidly expanding market, production capacity is not static—it flows between segments in response to discrete demand pulses triggered by policy windows and regulatory deadlines. Switching Drivers and Timeline The capacity switching pattern observed throughout 2025–2026 is driven by discrete demand signals: policy windows, regulatory deadlines, and segment-specific surges. Q2–Q3 2025: ESS → Electric Commercial Vehicle Shift The global commercial vehicle segment experienced a surge in demand, with new energy commercial vehicle sales reaching close to a million units in 2025—an approximately 60% year-on-year increase and a market penetration rate of about one quarter. Within this, new energy heavy-duty trucks saw explosive growth. Coupled with a full purchase tax exemption policy, this demand surge triggered a redirection of ESS production capacity toward commercial vehicle power batteries. Q4 2025: Electric Commercial Vehicle → ESS Reversal The year-end concentrated delivery window for energy storage projects—mainly driven by annual grid-connection deadlines in China—prompted capacity to flow back toward ESS. H1 2026: Continued Energy Storage Delivery + Residential ESS Shift The first half of 2026 saw sustained storage project deliveries alongside a marginal slowdown in electric commercial vehicle demand. Meanwhile, ex-China residential ESS demand recovered, supported by incentives in selected markets—most notably Australia, which drove some power capacity toward the residential storage segment. What Switched, and At What Cost Capacity reallocation operated along two distinct pathways, each involving different cell models: Pathway 1: Large-cell switching within power batteries (324Ah & 588Ah). Larger-format cells—principally 324Ah and 588Ah—move between commercial vehicle and passenger vehicle power battery lines. When commercial vehicle demand surges (as it did in 2025 with heavy-duty trucks), these lines can be repurposed to serve the higher-volume passenger segment, and vice versa. Both applications sit on the power-battery side of the industry, so the switch is intra-segment. Pathway 2: Power-to-ESS line conversion (120Ah). Smaller 120Ah cells sit at the boundary between power and energy storage applications. Lines producing 120Ah cells can be converted from power battery duty to ESS duty—or redirected back—depending on which segment offers better near-term economics. This is the cross-segment switch that links the two halves of the battery market. Switching cost and lead time: On average, retooling a production line for a different cell model takes two to four weeks and costs roughly USD 140,000 per switch. This is the baseline friction that makes capacity reallocation a considered decision rather than a continuous flow—and it is the reason process technology becomes decisive, as the next section explains. Process Technology Determines Switching Flexibility Not all production lines can switch with equal ease. The underlying cell manufacturing process defines the elasticity of capacity reallocation: Winding Process: In this approach, electrodes are wound around a winding needle. Physical constraints—needle length and curvature radius—limit production to fixed cell models. Switching to different models requires changing the winding needle, incurring high retrofitting costs and long lead times. As a result, 324Ah winding lines can only switch between ESS and commercial vehicle power cells of the same model. Stacking Process: Electrodes and separators are stacked layer by layer, free from winding needle and radius constraints. By adjusting electrode length and the number of stacked layers, stacking lines can produce cells of any capacity. This enables flexible switching across all cell models. BYD is the primary player with large-scale stacking capacity—its Blade Battery lineup is entirely produced using the stacking process. Switching Direction Cell Type / Process Process Characteristics ESS ⇄ Commercial Vehicle 324Ah(Winding) Limited by winding-mandrel size; same model production line can switch both ways ESS ⇄ Commercial Vehicle Stacking, non model specific Not constrained by mandrel/curvature; electrode-layer count freely adjustable, flexible switching across all cell models Power ⇄ Residential Storage 120Ah residential storage cell Shifting power-cell capacity to residential storage to maximize subsidy capture Conclusion The lithium-ion battery industry's ability to flexibly reallocate production capacity between energy storage and EV power segments reflects both the scale of its manufacturing base and the responsiveness of its supply chain. As energy storage continues its rapid ascent—with 2026 energy storage lithium-ion battery production projected to grow over 90% year-on-year—and the continuous acceleration of commercial vehicle electrification process, this demand-driven switching dynamic is likely to persist. However, the degree of flexibility varies significantly by process technology. Stacking-based manufacturers like BYD are positioned to respond to demand shifts with minimal friction, while winding-based players face higher switching costs and narrower optionality.
Aug 17, 2026 18:08
【SMM Analysis】TOPCon Cell Prices Surge: Sentiment, Cost, and Policy Factors Drive Market Rally
After nearly two months of continuous declines, TOPCon cell prices have recently seen a strong rebound. Prices of various sizes have risen sharply within just one week, drawing significant attention from companies across the PV industry chain. According to SMM data, as of August 12, the actual transaction prices of monocrystalline TOPCon cells in 183mm, 210R and 210mm sizes were RMB 0.29/W, RMB 0.285/W and RMB 0.29/W, respectively, up about 15% from the beginning of August.
Aug 17, 2026 11:54
Chicago Summit Sets the Tone for SSB Race: Oxide Route Prevails, Sulfide‑Route Mass Production Delayed until 2030
his week, the Chicago Summit clarified the industry timeline: oxide electrolytes will be prioritized for deployment within 2–3 years, while all‑solid‑state sulfide batteries will be delayed until 2028–2030. The Baihu Lake Laboratory achieved a breakthrough in boride‑based solid‑state batteries with 400 Wh/kg, wide temperature range, and low‑pressure operation, targeting low‑altitude economy and robotics applications.
Aug 14, 2026 09:14
Is recent gold price strength fleeting or sustainable?
Thursday, August 13, 2026 Following a brutal 30% decline in the price of gold since the start of the year, there are signs the yellow metal is coming back to life with the bullion price up 8% since the beginning of August. The more volatile silver price is up around 16% since the middle of July. The sharp pullback at the start of the year should perhaps not have come as much of a surprise given gold had gained 60% in 2025 and another 30% in January 2026. A contributing factor to recent strength of gold and silver has been renewed weakness in the US dollar against a basket of major currencies in recent weeks. A weaker dollar makes precious metals cheaper for non-dollar buyers. It is the mirror image of the dollar strength which contributed to gold weakness in early 2026. Dollar strength was exacerbated by expectations for central banks to hike interest rates following the US-Iran war in late February as higher energy prices fed through to higher inflation. Since gold does not provide a yield, rising interest rates make gold less attractive compared to stocks and bonds , everything else being equal. Renewed Central Bank buying According to The World Gold Council (WGC), central banks and sovereign wealth funds purchased 289 tonnes of gold in the second quarter of 2026, up 62% year-over-year. Poland was the largest buyer, followed by China, which bought its largest quarterly addition since 2023, taking its reported holdings to 2,346 tonnes. Looking ahead, the WGC’s annual survey found 89% of central bank reserve managers expect central bank holdings to keep rising over the next 12-months, sending a message that demand remains in an upward trend. A separate survey across 76 institutions pointed to structural changes in how reserves were managed, with more than half of central banks running domestic purchase programmes which involved governments buying gold from smaller-scale gold miners within their own country. The WGC describes this as a shift away from holding gold as a legacy asset towards treating gold as an active, strategic allocation amid geopolitical uncertainty, rising currency volatility and reserve diversification . Gold as a hedge Kevin Smith, chief investment officer at Crescat Capital believes there is a scenario where gold could rise to $20,000 per ounce over the next few years. It is a long shot, but not unprecedented. One of Smiths arguments is that the gold price relative to the S&P 500 index is as low as it has been since 2009 and 1970, which reflects the fact that US valuations are at all-time highs, implying there is a small margin of error priced into investor's expectations. Prior peaks in the gold to S&P 500 ratio have coincided with market dislocations. In the current set up, Smith is looking at a scenario where the AI boom doesn’t provide the expected investment returns, leading to disappointment which could cause the stock market to drop in similar fashion to the declines seen in 2001 and 2008, when the S&P 500 halved in value. “A 50% lower S&P 500, combined with a 5.25 gold-to-S&P 500 multiple, which is well below its 1980 peak of 7.58, though slightly above its 1933 peak of 4.76, also gets us to our $20,000 price target for gold,” argues Smith. All bets are off if interest rates stay higher for longer With Federal Reserve chair Kevin Walsh seemingly intent on establishing his inflation-fighting credentials, central banks could hike interest rates to bring inflation back to target, after missing it for more than four years. This would create a headwind for precious metals, which tend to do better in low interest rate environments. Despite these concerns, markets are also cognisant of the other side of the Fed’s dual mandate, which is to keep the economy chugging along and the labour market healthy. The bull market in US stocks means households have a greater proportion of their wealth tied to stocks than ever before, while the national US debt relative to the size of the economy is forecast by the Congressional Budget Office to climb to its highest level since the second world war over the next decade. These factors suggest the central bank will not act hastily to risk failing to meet the other side of its mandate.
Aug 14, 2026 22:02

Latest News

Weekly LFP Market Recap: Processing Fees Rise amid Tight Supply & Strong Demand
Aug 13, 2026 18:55
[Energy Storage: Boshi Energy Storage's First Product Rolls Off 587Ah Large-Capacity Cell PACK Production Line]
Recently, Boshi Energy Storage announced that the dedicated PACK automated production line for 587Ah cells, built at its Jiashan intelligent manufacturing base specifically for large-capacity long-duration energy storage applications, has been successfully commissioned, with the first product officially rolling off the line. Going forward, the production line will initiate trial production verification as planned, steadily advancing capacity ramp-up. Once mass production begins, it will form synergistic capacity with existing production lines. The 587Ah cell energy storage PACK products produced will be supplied in volume to commercial and industrial energy storage projects and containerized energy storage power stations both domestically and internationally, capable of accommodating standardized complete machine deliveries as well as customized OEM/ODM requirements, thus building a more resilient large-capacity product supply system.
Aug 13, 2026 14:03
[SMM Energy Storage Battery Cell Market Weekly Review 8.13] Utility-Scale Energy Storage Prices Hold Steady, Residential ESS Market Cools Marginally
[SMM Analysis] This week, the energy storage battery cell market showed structural divergence, with demand for utility-scale energy storage remaining stable, the supply-demand pattern remaining tight, and mainstream product prices holding steady overall; residential ESS was affected by weakening demand expectations outside China and earlier inventory accumulation, with integrators' cargo pick-up pace slowing and some residential battery cell quotes revised downward.
Aug 13, 2026 13:00
Orders skyrocketing 3000%! Global ESS battery annual sales poised to historically surpass 1 TWh!
As "full capacity" and "flooded with orders" became the truest reflections of the ESS sector in H1, a growth wave driven by both AI computing power and the energy transition is propelling the global ESS battery market to unprecedented heights. Data from the National Energy Administration shows that in H1, investment in key energy projects in China maintained positive growth despite last year's high base, with new-type energy storage up 74.3% YoY. As of end-June, completed and operational new-type energy storage installations nationwide reached 153 GW/396 GWh (153 GW/396 GWh), up 61% YoY. Compared with the end of 2025, when the figures stood at 136 GW/351 GWh (136 GW/351 GWh), this implies new installations of 17 GW/45 GWh in H1.
Aug 10, 2026 08:39
[Storage: South Africa to develop 184MW solar and 300MWh storage project]
SolarAfrica has partnered with MPower, the energy platform of the Moolman Group, and Fledge Capital to develop the Highveld Hybrid Energy project near eMalahleni in Mpumalanga, South Africa. The project will combine a 184MW utility-scale solar PV plant with a 300MWh battery storage system and is expected to begin supplying wheeled renewable electricity from 2029. It aims to provide businesses with greater energy security, long-term price certainty and access to clean electricity.
Aug 7, 2026 16:51
[Storage: Syria signs deals for 760MW solar and storage projects with Saudi firm]
The Syrian Electricity Company has signed three agreements with Saudi Arabia’s Al-Harfi Construction to develop solar projects with a combined capacity of 760MW in the Widyan ar-Rabi’ area of Damascus Countryside. The projects will be backed by battery energy storage systems totaling 1,077MW. The agreements follow a February 2026 MoU between PETDE and Al-Harfi Construction for a 210MW solar project supported by an 827MWh BESS facility.
Aug 7, 2026 16:48
[SMM Energy Storage Battery Cell Market Weekly Review 8.06] Energy storage battery cell prices remain stable, with large-capacity products expected to accelerate shipments in H2
[SMM Analysis] This week, the energy storage battery cell market remained stable overall. The pullback in lithium chemical prices has not yet significantly transmitted to the battery cell side, and only some orders adopting a raw material linkage mechanism saw slight downward adjustments. The average price of 314 Ah battery cells remained around 0.365 Yuan/Wh. As the implementation details of the battery consumption tax have not yet been released, most battery cell enterprises have not yet uniformly raised prices. The additional tax costs may be shared through negotiation between upstream and downstream players in the industry chain. In terms of product structure, in H1, shipments of large-capacity battery cells above 500 Ah reached approximately 42 GWh, accounting for 8.6%. The market is still dominated by deliveries of 314 Ah products. As large battery cell capacity is gradually released in H2, the shipment share of these cells is expected to increase to around 15%.
Aug 6, 2026 18:49
SMM Releases the 2026 Energy Storage Tier 1 List, Recognizing Industry Leaders Powering Next-Generation Energy Systems
Aug 5, 2026 15:51
H1 Global Lithium Battery ESS Shipments Exceed 461 GWh: CATL, EVE, and Hithium Account for Nearly Half
In H1 2026, global lithium battery ESS shipments reached 461.3 GWh, up 71% from 269.7 GWh in the same period last year. The overall market presented a competitive landscape of "the first tier remains dominant, the second and third tiers are locked in a melee, while other enterprises struggle to survive in the cracks.
Aug 5, 2026 08:31
Base Power Raises US$1 Billion to Expand Residential Energy Storage
US residential energy storage company Base Power has secured a US$1 billion funding round, bringing its valuation to US$13 billion and total funding to over US$2.5 billion. The company has deployed more than 23,000 residential battery systems, representing around 550MWh of installed storage capacity, and plans to double its installation pace by the end of 2026 while expanding into more US states and international markets.
Aug 4, 2026 19:41
Samsung SDI to Start US LFP ESS Cell Production in October
Samsung SDI said its US prismatic lithium iron phosphate (LFP) battery cell production line for energy storage systems (ESS) has entered mass production quality validation and is scheduled to begin production in October 2026, with customer deliveries starting before year-end. The company said ESS orders have already secured a substantial portion of its production capacity through 2029 and demand is expected to exceed capacity from 2028, prompting a review of additional capacity expansion. Samsung SDI has also established a Non-FEOC-compliant LFP supply chain to support the US ESS market.
Aug 4, 2026 19:38
Sichuan Yingfa Ruineng Technology Looks Forward to Meeting You at the 2026 SMM (5th) PV and Energy Storage Industry Conference
Aug 4, 2026 15:55
Guangdong Aodiya Electronics Co., Ltd. Looks Forward to Meeting You at the 2026 SMM (5th) PV & Energy Storage Industry Conference
Aug 4, 2026 14:05
Jiangsu Runergy New Energy Technology Co., Ltd. Looks Forward to Meeting You at the 2026 SMM (5th) PV & Energy Storage Industry Conference
Aug 4, 2026 10:35
Milestone Hit: China NEV Penetration Rate Tops 50%, Yet Full‑Year Sales Projected to Dip
NEV Penetration Rate Surpasses 50% for First Time in July, Exports Continue High Growth In July, China's auto sales were about 2.584 million units, down 8% MoM and down 0.3% YoY. Of this total, NEV sales were 1.561 million units, down 5% MoM and up 23.7% YoY. Notably, this was the first time that China's NEV sales penetration rate (without distinguishing between passenger and commercial vehicles or between exports and domestic sales) exceeded 50% — meaning that one of every two vehicles sold in the market was an NEV — marking the formal transition of NEVs from a policy-driven "supplementary choice" to a market-driven "mainstream choice" and a structural turning point of milestone significance in the energy transition of China's automotive industry. Broken down by domestic sales and exports: Domestic Sales: Clear Seasonal Pullback, Accelerating Contraction of Traditional Fuel Vehicles In July, domestic auto sales were 1.541 million units, down 13.1% MoM and down 23.6% YoY. Of this total, domestic sales of traditional fuel vehicles were 533,000 units, down 18.4% MoM and down 45.7% YoY; the decline widened further, reflecting that NEV models are replacing the share of traditional fuel vehicles in the Chinese market at an accelerating pace. Domestic NEV sales were 1.008 million units, down 10% MoM and down 2.8% YoY, with a penetration rate of about 65%. By segment, domestic passenger NEV sales were 916,000 units, down 9% MoM and down 6.1% YoY; domestic commercial NEV sales were 92,000 units, down 18.8% MoM and up 48.8% YoY, continuing the rapid growth trend. In July, domestic sales showed a clear seasonal pullback, mainly due to two factors: first, automakers' concentrated sales pushes around the previous half-year period had released some demand in advance; second, extreme weather nationwide, such as high temperatures and typhoons, curbed offline sales activities. Exports: High Growth Continues, PHEV Growth Leads In July, auto exports were 1.043 million units, up 0.6% MoM and up 81.3% YoY. Of this total, NEV exports were 553,000 units, up 5.7% MoM and up by 1.5 times YoY; the export penetration rate reached 53% and has exceeded 50% for two consecutive months . By technology route, battery electric vehicle exports were 331,000 units, accounting for about 60% and up by 1.4 times YoY; plug-in hybrid vehicle exports were 222,000 units, up by 1.6 times YoY. In terms of annual growth, plug-in hybrid vehicles performed more prominently and are expected to continue expanding their share in the export market. Market Outlook: Domestic Sales Under Pressure, Exports Promising Looking ahead, domestic NEV sales still face certain pressure. Although H2 will enter the traditional sales peak season, against the current backdrop of no new policy incentives, overall growth room is expected to be limited, and full-year domestic sales are still expected to decline by more than 10% YoY. Export side, automakers generally view exports as a core source of future growth; the export market is expected to continue expanding (currently, NEV exports account for about 35%), becoming the main driver of growth for China's NEV industry.
Aug 18, 2026 17:53
Solar Cells in the Eye of the Section 232 Storm: How Long Can a Trader-Driven Rally Last?【SMM Analysis】
Aug 18, 2026 18:37
[SMM Analysis] Global Lithium-ion Battery Industry Navigates Capacity Switch Between ESS and EV
[SMM Analysis] Global Lithium-ion Battery Industry Navigates Capacity Switch Between ESS and EV
Aug 17, 2026 18:08
 Solid-State Battery  Accelerates, Supply Chain Diverge Sharply – Review of Listed Companies' H1 2026 Performance
 Solid-State Battery Accelerates, Supply Chain Diverge Sharply – Review of Listed Companies' H1 2026 Performance
Aug 17, 2026 15:16
【SMM Analysis】TOPCon Cell Prices Surge: Sentiment, Cost, and Policy Factors Drive Market Rally
Aug 17, 2026 11:54
Chicago Summit Sets the Tone for SSB Race: Oxide Route Prevails, Sulfide‑Route Mass Production Delayed until 2030
Aug 14, 2026 09:14
Is recent gold price strength fleeting or sustainable?
Aug 14, 2026 22:02
Latest News
LG Energy Solution Begins Operations at Michigan Lansing Plant
13 hours ago
[SMM Analysis] Global Lithium-ion Battery Industry Navigates Capacity Switch Between ESS and EV
Aug 17, 2026 18:08
Shandong Hithium Launches World's First Integrated LDES Industrial Park in Heze
Aug 17, 2026 11:16
Weekly LFP Market Recap: Processing Fees Rise amid Tight Supply & Strong Demand
Aug 13, 2026 18:55
[Energy Storage: Boshi Energy Storage's First Product Rolls Off 587Ah Large-Capacity Cell PACK Production Line]
Aug 13, 2026 14:03
[SMM Energy Storage Battery Cell Market Weekly Review 8.13] Utility-Scale Energy Storage Prices Hold Steady, Residential ESS Market Cools Marginally
Aug 13, 2026 13:00
Orders skyrocketing 3000%! Global ESS battery annual sales poised to historically surpass 1 TWh!
Aug 10, 2026 08:39
[Storage: South Africa to develop 184MW solar and 300MWh storage project]
Aug 7, 2026 16:51
[Storage: Syria signs deals for 760MW solar and storage projects with Saudi firm]
Aug 7, 2026 16:48
[SMM Energy Storage Battery Cell Market Weekly Review 8.06] Energy storage battery cell prices remain stable, with large-capacity products expected to accelerate shipments in H2
Aug 6, 2026 18:49
Tesla Starts Megapack 3 Production in Texas
Aug 6, 2026 18:31
LS Electric Makes First Shipment of ESS PCS
Aug 6, 2026 16:03
[SMM Analysis] 486GWh! Who Is Leading the Energy Storage Battery Cell Market in 2026H1?
Aug 6, 2026 11:56
SMM Releases the 2026 Energy Storage Tier 1 List, Recognizing Industry Leaders Powering Next-Generation Energy Systems
Aug 5, 2026 15:51
H1 Global Lithium Battery ESS Shipments Exceed 461 GWh: CATL, EVE, and Hithium Account for Nearly Half
Aug 5, 2026 08:31
Base Power Raises US$1 Billion to Expand Residential Energy Storage
Aug 4, 2026 19:41
Samsung SDI to Start US LFP ESS Cell Production in October
Aug 4, 2026 19:38
Sichuan Yingfa Ruineng Technology Looks Forward to Meeting You at the 2026 SMM (5th) PV and Energy Storage Industry Conference
Aug 4, 2026 15:55
Guangdong Aodiya Electronics Co., Ltd. Looks Forward to Meeting You at the 2026 SMM (5th) PV & Energy Storage Industry Conference
Aug 4, 2026 14:05
Jiangsu Runergy New Energy Technology Co., Ltd. Looks Forward to Meeting You at the 2026 SMM (5th) PV & Energy Storage Industry Conference
Aug 4, 2026 10:35