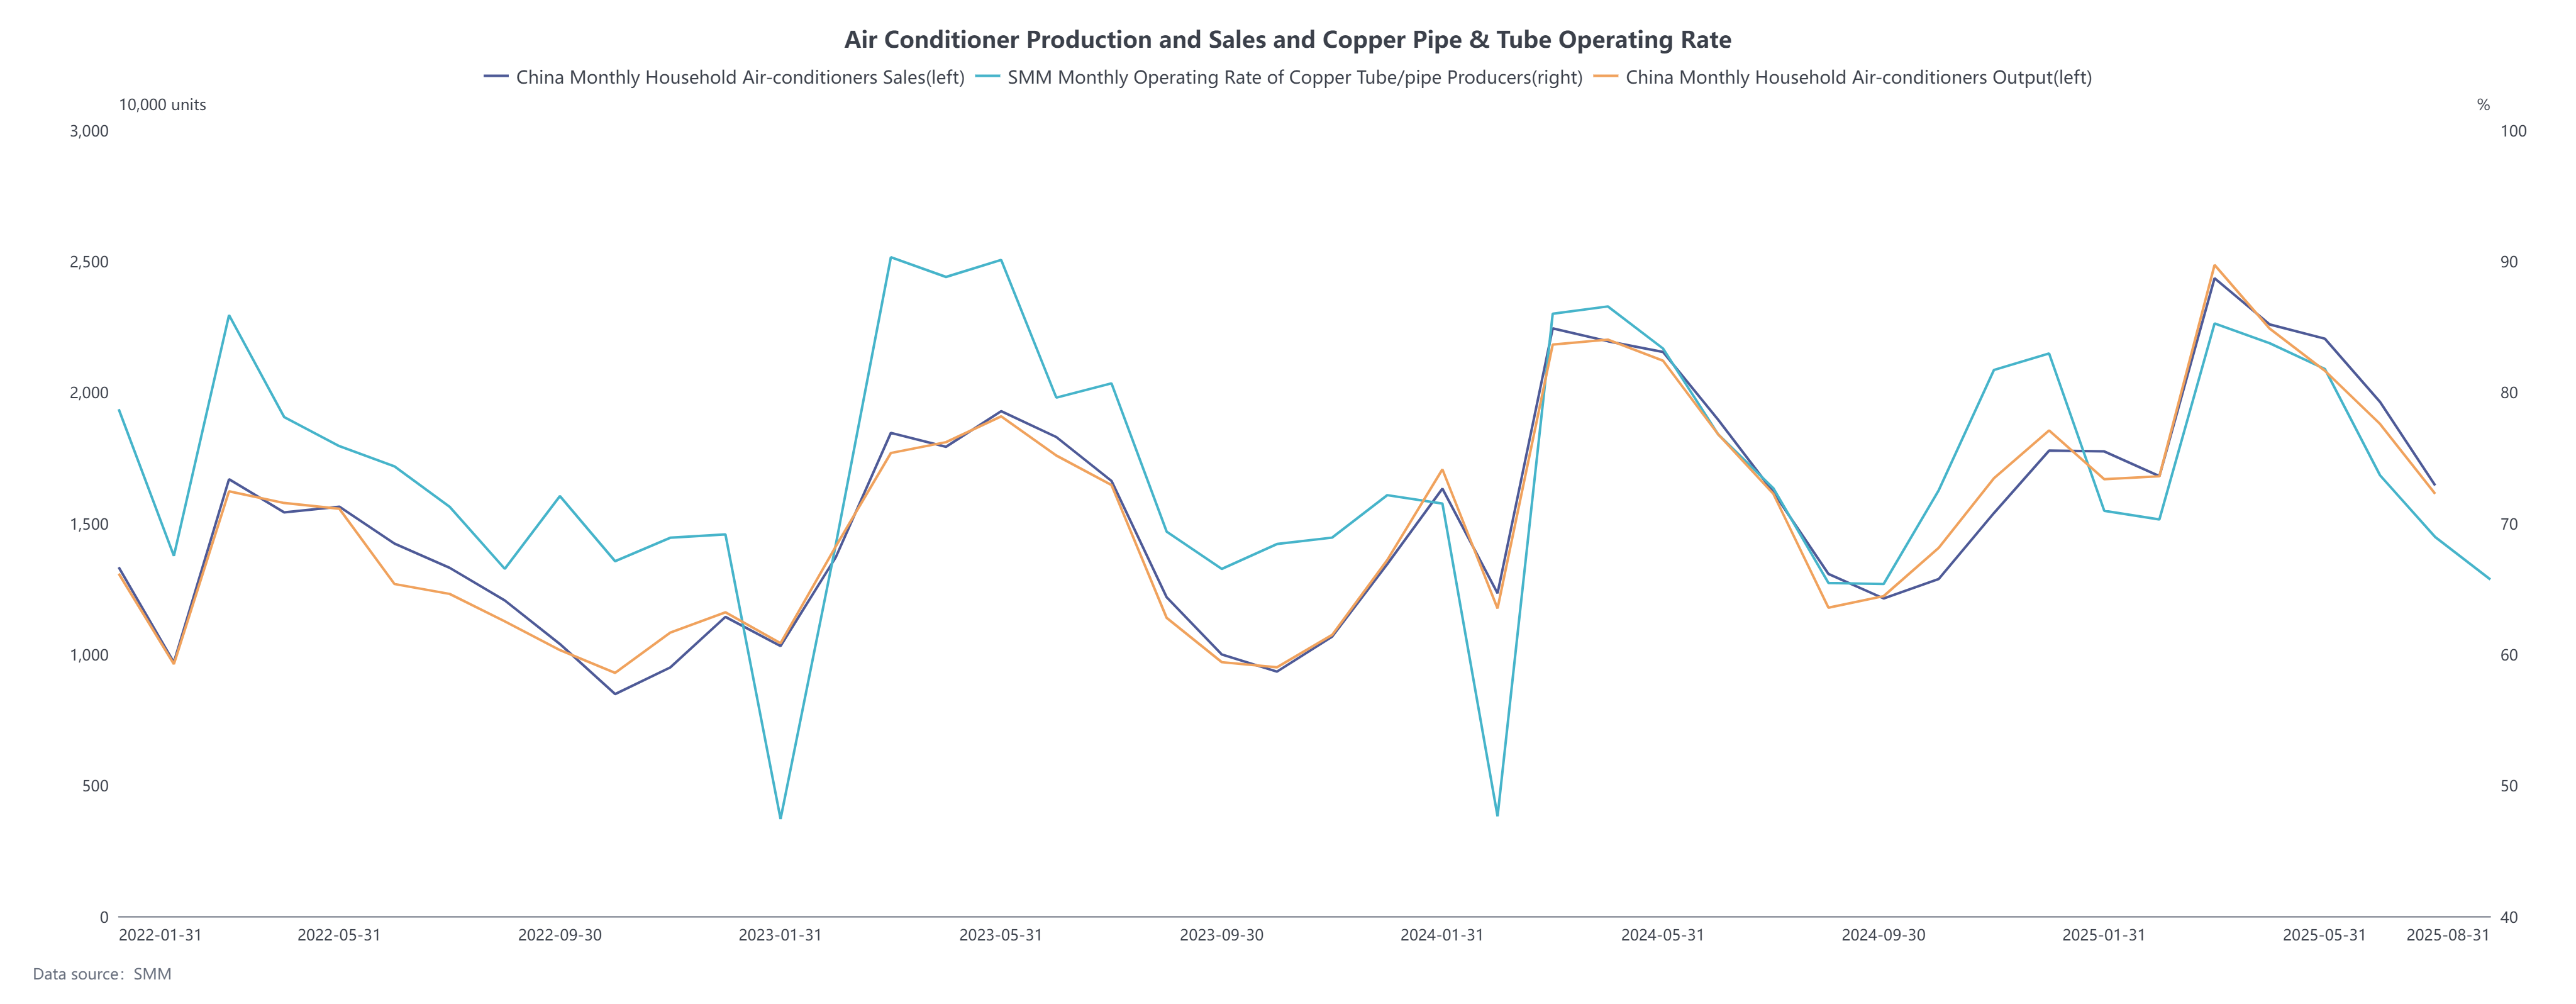
The operating rate of copper pipe & tube producers stood at 65.70% in August.
According to SMM data, the operating rate of copper pipe & tube producers in August was 65.70%, down 3.24 percentage points MoM but up 0.27 percentage points YoY. The August operating rate marked the lowest level so far this year, with the off-season being the dominant factor. Additionally, starting from August 1, a 50% tariff was imposed on imported semi-finished copper products (e.g., copper pipes, wires, billets, plates, and tubes) as well as copper-intensive derivatives (e.g., fittings, cables, connectors, and electrical components). Direct export orders for copper pipes to the US declined, significantly impacting production at some enterprises. However, US factory operations surged, processing fees also rose substantially, and the tariffs are expected to significantly boost domestic copper pipe capacity utilization rates in the US while facilitating the ramp-up of new capacity.
The raw material inventory ratio for copper pipe producers was 3.86% in August, down 0.23 percentage points MoM. Copper pipe production fell 4.71% MoM, while raw material inventories dropped 10.15% MoM. Rising copper prices and premiums, coupled with reduced production schedules at copper pipe producers, led to lower raw material stockpiles.
The operating rate of copper pipe & tube producers is expected to reach 68.92% in September.
SMM data shows that the projected operating rate for copper pipe producers in September 2025 is 68.92%, up 3.22 percentage points MoM and 3.57 percentage points YoY. The operating rates for large, medium, and small copper pipe producers in September were 68.65%, 72.52%, and 63.06%, respectively. Feedback from a major OEM indicates that the addition of more suppliers this year has led to more evenly distributed orders across copper pipe producers of varying scales, diluting order concentration for large producers. Consequently, large copper pipe factories reported weaker operating rates than medium-sized ones.
According to ChinaIOL, domestic sales of household air conditioners in September 2025 are scheduled at 5.72 million units, down 6.3% YoY compared to actual sales in the same period last year. October domestic sales are scheduled at 4.815 million units (down 23.4% YoY), while November domestic sales are scheduled at 5.55 million units (down 17.6% YoY). Export schedules for household air conditioners in September 2025 stand at 5.025 million units, down 16.6% YoY compared to actual exports in the same period last year. October exports are scheduled at 6.065 million units (down 7.8% YoY), and November exports are scheduled at 7.86 million units (down 9.1% YoY).
The overall decline in air conditioner production schedules from September to November, apart from export impacts, is mainly attributed to high sales driven by last year’s national subsidy policies. As high temperatures subside, sales expectations gradually weaken, prompting OEMs to adopt a more cautious approach in H2 after aggressive production scheduling in H1. Copper pipe operating rates are expected to show only mild MoM growth from September to November.