Quarterly focus: can copper and dollar fly together?
The dollar fluctuated upward in the first quarter, which suppressed the copper price to a certain extent. The vaccination level of the United States was ahead of Europe, the economic data remained strong, and the nominal interest rate of US debt strengthened, driving the nominal spread between US debt and other countries (such as Germany) to widen. Under the influence of a variety of factors, the speculative bulls of the US dollar regained the upper hand, pushing up the dollar index back to the previous platform range.
Looking forward to the second quarter, two scenarios need to be considered: the labor market continues to improve-market expectations for FED tightening are growing-and the space above the dollar index opens; Limited improvement in the labor market-market expectations for FED tightening-limited room above the dollar index, the second scenario is obviously more beneficial to copper prices in theory, and we need to focus on the first case: if the space above the dollar index opens, whether it will be a significant drag on copper prices (metal prices), in other words, whether copper prices can rise with the dollar;
Historically, there has not always been an inverse relationship between the dollar index and metal prices, and the two have risen or fallen together for a period of time (we mainly examined the period of the same rise). It appeared in 1973-1975, 1979-1981, 1982-1984, 2009-2010, 2016. we sort out the main paths behind the co-rise of the two, and try to explore the questions raised in this paper.
In essence, whether the US dollar and copper prices can rise with each other depends on whether the logic behind the two is the same or not. Based on the known path, it is expected that it will be difficult for the two to form co-directional resonance in the second quarter. This means that even if the US economy continues to recover and the labor market continues to improve, due to the domestic leading US recovery, and in the context of tighter credit margins and high pressure on refined copper supply, if the upper space of the US dollar is opened. There is a high probability that the copper price will be suppressed to a certain extent, and the pattern of the two rising together may be difficult to reappear.
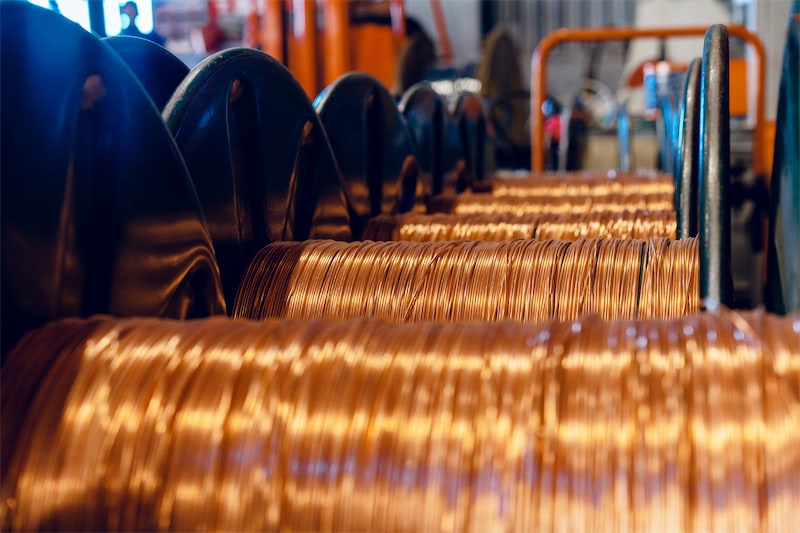
Quarterly fundamentals: there is a lot of pressure on the supply of refined copper.
In terms of copper concentrate, although the world's major mining companies have not yet announced their output in the first quarter, it can be learned from previous news that the increase in global copper concentrate in the first quarter is limited; looking forward to the second quarter, copper concentrate may rebound significantly compared with the same period last year, mainly because Peru's copper concentrate production was seriously disturbed by the epidemic in the second quarter of last year, and its base is low, and this part of the reduction will be made up for this year. However, the increment brought by the low base is difficult to alleviate the tense pattern of copper concentrate, and the game between overseas mines and smelting enterprises around raw material TC will not weaken in the second quarter.
In terms of refined copper, according to the research data of third-party institutions, the output in the first quarter increased by about 330000 tons compared with the same period last year, with an increase of more than 15%, and the supply pressure is not small. Based on the current maintenance and scheduling of smelting enterprises, the monthly output level or month-on-month output decreased by 10-20 million tons in the second quarter of last year, but due to the low production base in the second quarter of last year, the year-on-year increase will still be high.
In terms of scrap copper, from January to February, the total import of scrap copper was 191700 physical tons, about 172700 metal tons, an increase of more than 60% over the same period last year. Due to the low base of imported scrap copper last year and the relatively high import growth rate this year, we need to pay attention to the impact of shipping problems on scrap copper imports in the second quarter.
In terms of refined copper imports, the import volume of refined copper from January to February was 558000 tons, slightly lower than that of the same period last year, and returned to the average level of about 300000 tons per month. Hulun price comparison did not have a particularly good trend in the first quarter, hovering around 7.4 as a whole, and the import window did not open significantly. In the second quarter, the domestic supply pressure is still not small, consumption has a large probability of marginal improvement, and price comparison may be difficult to have trend logic under the background of double increase in supply and demand.
On the demand side, the overall demand for copper downstream in the first quarter was neutral, and some links performed well, but under the pressure of high supply and high prices, consumption was restrained to a certain extent, and the inventory curve was also lengthened. With the advent of the peak season in the second quarter, demand may continue to improve marginally, so there is no need to be too pessimistic about refined copper consumption in the second quarter.
Quarterly focus: can Copper and US Dollar fly together
If the space above the dollar opens.
The divergence of the confidence index between the United States and Europe rebounded ahead of the rebound of the dollar index.
The nominal spread between US debt and other major national debt widened, and the speculative net position in the dollar index was more than that of other major countries.
At present, the epidemic control and vaccination progress of the United States are ahead of EU, UK and other major economies, and the economic data of the United States are good, and the market has always expected tightening of FED policies. If the labor market indicators, the anchor of FED, continue to improve, the market expectations of tightening may be stronger, so the probability of the dollar index strengthening will be greater.
So there are two possible scenarios in the second quarter:
(1) the improvement in the labour market is limited-there is still a huge poor Gap-- inflation transmission path in employment compared with that before the epidemic-market expectations for marginal tightening of FED policy remain stable-and the space above the dollar is temporarily limited.
(2) continued improvement in the labour market-gradual opening of the inflation transmission path-increased expectations of marginal tightening of FED policy-space above the dollar may open
Under scenario 1, the space above the dollar may be relatively limited, and at a stage when the recovery is still expected to be strong, it is naturally good for copper prices; the key issue to consider is scenario 2, if the space above the dollar is opened in the second quarter, should copper prices adjust, continue consolidation, or is it possible to fly with the dollar?
In order to explore this question, we focus on the periods in which metals and the dollar rise and fall together in history and the logic behind them, and then try to answer this question in the light of the current situation.
The same Operation of US Dollar and Metal
From 1973 to 1975, the dollar index and metal prices showed a significant upward trend of Synchronize. The main leading factor is the outbreak of the fourth Middle East War. At that time, in retaliation for US support for Israel, the OPEC countries decided to reduce oil production by 5% every month, and then, led by Saudi Arabia, changed into a comprehensive oil embargo. International crude oil prices immediately rose, with Saudi oil prices rising from $1.80 per barrel to $10 per barrel, directly contributing to the overall rise in commodity prices. On the other hand, as oil, metals and other commodities are denominated in dollars, the sharp rise in commodity prices has increased the demand for dollar reserves in many countries, leading to an increase in demand for dollars, and the dollar index has strengthened to a high level of 110. The dollar index rose sharply at the same time as metal prices. However, after the end of the crude oil embargo, oil prices peaked and fell, driving down metal prices, weakening demand for dollar reserves, and a strong dollar harmed the economic development of the United States and caused the dollar index to weaken. As a result, the dollar index and metal prices fell again in the pattern of Synchronize.
From 1979 to 1981, the dollar index and metal prices rose and fell at the same time. This is mainly due to the outbreak of the "Islamic Revolution" in Iran at the end of 1978 and the subsequent "Iran-Iraq War". During this period, the oil production of Iran and Iraq, the two big oil exporters, fell sharply as a result of the war, resulting in a 160% rise in crude oil prices over the same period, based on similar factors to those during the 70-year oil crisis. The dollar index also rose significantly during this period. After the end of the war, oil production returned to normal, and the dollar index and metal prices entered a downward pattern of Synchronize.
Before Reagan became president in 1981, the US economy was in trouble: high unemployment and inflation and slow economic growth, which are typical characteristics of the stagflation stage of the economy. After Reagan took office, he vigorously promoted the economic thinking of the "supply school". The main policies included reducing the tax burden of enterprises, activating the creativity of small and medium-sized enterprises, and increasing jobs; adopting a relatively tight monetary policy and strictly controlling the money supply to deal with high inflation; government departments increased fiscal expenditure, developed infrastructure and military projects, and led the technological progress of the United States with military projects. After the introduction of some of Reagan's economic policies, the US economy rebounded significantly in 1982, growing much faster than other developed countries. The expansion of domestic aggregate demand drove commodity demand and stimulated commodity prices. At the same time, as the economy rebounded, the Federal Reserve gradually entered the interest rate hike cycle, and the money returned to the United States, pushing up the dollar index and the Synchronize of metal prices at this stage.
The European debt crisis began to ferment in the fourth quarter of 2009, and the market risk aversion mood heightened. As a kind of safe haven assets, funds entered the dollar to push up the dollar index. On the other hand, as a result of China's 4 trillion yuan economic stimulus policy in 2009, investment in real estate, infrastructure, manufacturing and other areas rebounded significantly, boosting demand for commodities and leading to a rebound in metal prices. the dollar and metals have risen in the same direction for about two quarters.
In 2016, the US economy led the global recovery, the Federal Reserve began the process of raising interest rates, US bond yields rebounded, and overseas liquidity returned to the United States, pushing up the dollar index. at the same time, emerging market countries represented by China have also begun to recover, demand for metals has rebounded, and superimposed "supply-side reforms" and other factors, metal prices have also risen, and the dollar and metals have risen in the same market for nearly three quarters.
After combing through several significant movements of the US dollar and metals in the same direction in history, we believe that there may be the following two paths:
The first path: the resource-exporting countries led by oil-exporting countries contract the supply side due to geopolitical and other factors, which leads to a sharp rise in resource prices, which is easy to pull up commodity prices. As the settlement currency and safe-haven currency of commodities, the US dollar will be favored by funds, when the US dollar rises with commodities.
The second path: the United States, as the leader of the global economy, took the lead in coming out of the economic downturn, bond yields rebounded, entered the interest rate raising cycle, US dollar assets were favored, and funds entered the United States, leading to the strengthening of the dollar index. on the other hand, aggregate demand rebounded, driving demand for industrial products, leading to a rebound in commodity prices, giving rise to inflation expectations and forming a pattern in which the dollar index and commodity prices rose together.
The variant of the second path: the variant comes from the formation of the G2 pattern and the change of the global metal consumption pattern, that is, the country with the largest metal consumption has shifted from developed market countries to emerging market countries (represented by China). At this time, if the global economy begins to recover and the pace of recovery in the United States is ahead of emerging markets, there may be a co-rise between the dollar and metals, because the peak demand in emerging markets appears relatively late.
For the time being, the world is still in the process of recovery, but this recovery in emerging markets (China) is ahead of the United States in rhythm, and the recovery within emerging market countries is uneven, so if the United States maintains a strong recovery in the second quarter, the strength of the dollar corresponds to a calmer Chinese demand (tight credit, high prices to curb demand), there is a good chance that it will still put some pressure on copper prices.
Quarterly fundamentals: a lot of supply pressure
At present, the output of the major mining enterprises in the first quarter has not yet been announced, waiting to be updated in the later period.
Last year, the output of major mining enterprises decreased by about 370000 tons compared with the same period last year.
Forecast of copper concentrate output for the whole year
Theoretically, the increment of copper concentrate this year is not low, which mainly includes Kamoa-Kukula, Grasberg underground project, Chuquicamata underground project and so on. The theoretical increment can reach 1 million tons.
However, if the interference of strikes, epidemics and other problems are taken into account, it is expected to fall in the range of 2-3%.
The output of Chile and Peru was mediocre at the beginning of the year.
According to the latest news, Chile produced 882000 tons of copper from January to February, a decrease of about 20, 000 tons compared with the same period last year, while Peru produced 347000 tons of copper from January to February, basically the same as last year.
Production at the Escondidaos copper mine controlled by BHP Billiton and the Pelambres copper mine at Antofagasta was poor at the beginning of the year, falling by 14.9 per cent and 11.8 per cent respectively; on the contrary, production by Chilean state-owned copper company Codelco increased by 10.7 per cent to 264800 tons in the first two months of this year, of which Chuquicamata copper production increased by 23.3 per cent to 128900 tons.
Peru's copper production is likely to increase in the second quarter, mainly because it was affected by the epidemic last year and the monthly output from April to May was at an all-time low. But even if we give an optimistic estimate of 204000 tons per month (19-year average) from March to June, the increase in Peruvian copper production in the first half of the year is just over 200000 tons, and it is not easy to achieve the official target of 400000 tons increment, because monthly production has returned to normal in the second half of 2020, and this increase will be even more difficult if Peru's production is affected by the epidemic. In fact, the recent epidemic in South America is indeed worthy of special attention.
Copper concentrate processing fees continue to decline
The bulk order processing fee for copper concentrate continues to decline, and the latest processing fee has fallen below US $30 / ton.
The floor price of copper concentrate processing fee was $53 in the first quarter, but CSPT failed to finalize the floor price in the second quarter, indicating that there are great differences in the market for raw materials.
At present, although processing fees continue to fall and squeeze smelter profits, crude copper processing fees continue to rise, and the price of sulfuric acid is also in a reasonable range.
The increment of refined copper is not low.
From January to March, domestic refined copper output was 2.48 million tons, an increase of 330000 tons over the same period last year, or an increase of 15.7%.
According to the current maintenance arrangements of domestic smelting enterprises, as well as the tension of raw materials, the monthly output in the second quarter does not rule out a month-on-month decline;
However, taking into account the low base affected by the epidemic last year, as well as the release of new capacity, the supply increase in the second quarter is not small;
Although the TC is low, squeezing smelter profits, but crude copper processing fees continue to rise, sulfuric acid prices are at a reasonable level, so from a month-on-month point of view, there may not be a large-scale reduction on the supply side of the closure in the second quarter.
Regression of import mean value of refined copper
The import of refined copper from January to February was 558000 tons, slightly lower than that of the same period last year, and returned to the average monthly average of about 300000 tons.
Shanghai and Lun price comparison did not have a particularly good trend in the first quarter, hovering around 7.4 as a whole, and the import window did not open significantly.
In the first quarter, domestic refined copper production increased greatly, scrap copper imports resumed growth, while consumption was slightly weak, which determined that the Shanghai-London price trend will not be too strong, and it is difficult to continue to open the import window.
In the second quarter, the domestic supply pressure will not decrease month-on-month, consumption will have a greater probability of marginal improvement, and price comparison may be difficult to have trend logic in the context of double increase in supply and demand.
The import of scrap copper was repaired as scheduled.
From January to February, the total import of scrap copper was 191700 physical tons, about 153000 metal tons, an increase of 60,000 tons over the same period last year, an increase of more than 60% over the same period last year.
In the second quarter, we need to pay attention to the impact of transportation on the import of scrap copper;
The annual increase of 20-300000 tons of scrap copper imports is expected to remain unchanged for the time being.
The inflection point of inventory has not been seen for a long time.
In the first quarter, the domestic social inventory has not seen an inflection point for a long time, and the feeling of consumption is overall neutral and local bright spot.
We believe that on the one hand, the "on-the-spot Spring Festival" during the Spring Festival lengthens the seasonality of the inventory curve, on the other hand, high output and high prices also form a certain pressure on the removal of inventory.
It is expected that the inventory inflection point will still come in the second quarter, but the slope of going to the warehouse will not be too steep.
Global explicit inventory of refined copper (LME+COMEX+SHFE+ bonded area) also rebounded, LME, COMEX have delivery positions in the first quarter;
The second quarter does not rule out the possibility that there will be a certain delivery position in LME.
Details of Electroweb investment
National Network has increased the amount of investment in the Electroweb plan from 408 billion yuan to 450 billion yuan in 2020, but the planned investment for 2021 has not yet been announced.
In addition to Electroweb investment, the renovation of old residential areas has also brought corresponding cable consumption. According to the national plan for the renovation of 39000 old residential areas, it is estimated that it will bring about 50, 000 tons of copper demand, and 53000 households are planned in 2021. It is expected to bring about 70, 000 tons of copper consumption.
The inventory of air conditioners is still high.
The production and marketing of air conditioners continued to be repaired in the first quarter.
However, the current problem of high inventory of air conditioners has not been significantly alleviated, and the ratio of inventory to consumption has returned to a high level again, and will still face the pressure of de-stocking in the later stage.
Another way to alleviate the high inventory of air conditioners may be the pick-up in export growth.
If the problem of high inventory of air conditioners is not alleviated, it will have a long-term worry about the demand for copper tubes.
Operating rate and inventory of copper rod
The operating rate of copper rod in the first quarter is weaker than that of seasonality.
The inventory of finished products in copper bar enterprises is at a high level, although the inventory of raw materials is at a low level, but the willingness to replenish the stock is weak.
The operating rate is expected to rise above the seasonal average in the second quarter.
Cable operating rate and inventory
The operating rate of cable enterprises in the first quarter is slightly weaker than that of seasonality.
The raw material inventory and finished product inventory of cable enterprises are at a high level, so it is difficult for enterprises to buy under the current high price.
It is expected that the inventory of finished goods in the second quarter is still under pressure of elimination.
Operating rate and inventory of copper tubes
The operating rate of copper tube enterprises in the first quarter is the same as that of seasonality and better than that of the same period last year, which is consistent with what we perceive from the air conditioning field.
At present, the inventory of finished goods and raw materials are high, and the inventory of air conditioners is also high, so we need to guard against the possible risks in the later stage.
Operating rate and inventory of copper sheet, strip and foil
The operating rate of copper plate, strip and foil enterprises is much better than that of seasonality and the same period last year, which is at the high level of several years in history.
This is consistent with our actual understanding of the situation, the high-end manufacturing, communications electronics and other industries have brought a boost to the demand for copper foil;
At present, the high inventory of raw materials is worthy of attention, but it is expected that the second quarter as a whole is still not bad.
Previous rising trajectories of copper prices
We maintain the previous view that this round of copper price rise is more comparable with 09-11;
This round, because the demand side lacks the huge flexibility of China's 4 trillion yuan and demand in traditional areas, the final increase is likely to be less than 2.5 times that of 2009-11.
However, as there is no interruption in the release of liquidity in Europe and the United States, and the economic recovery and household balance sheets are better than at that time, the depth of this round of adjustment will be shallower and the time of adjustment will be shorter.
In early 2010, copper prices fluctuated for nearly three quarters after hitting the first high before starting the second round of rally, with the maximum correction depth of more than 20%.
It is expected that the current round of adjustment is less than 20% and the adjustment time is less than three quarters, but at present, we are more inclined to be in a state of adjustment or shock in the second quarter, especially if the US dollar opens the upper space in the second quarter. we think that there is still a certain degree of suppression on copper prices, of course, it is less likely to directly turn copper prices.
It is estimated that the amount of copper used in the world's emerging areas will account for 6-7% in 2021;
From the point of view of the balance sheet, the annual balance shows a small surplus after taking full account of the increase in demand in emerging areas.
This means that although there is an icing on the cake for demand in emerging areas, it is difficult to see an obvious gap and feel the tension of refined copper if the demand in traditional areas is only neutral.
We believe that this result is consistent with the current situation, and the second quarter is still the key point to test demand.