Review of 2025H1 China's NEV Market: Dual New Policies + Purchase Tax Exemptions + Price Wars Among Automakers
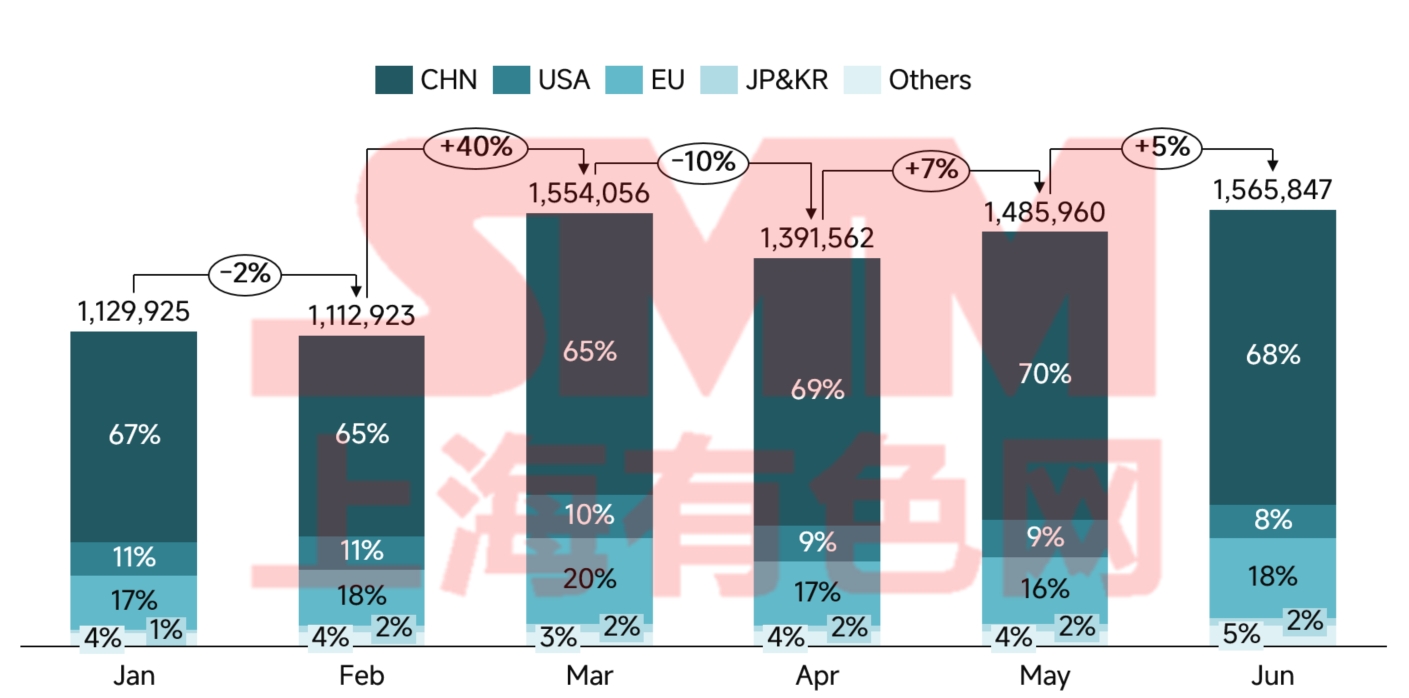
In 2025H1, the global NEV market continued to grow, with a remarkable YOY increase of 25%. By country/region, China's NEV sales in H1 2025 remained the global leader, with a penetration rate of 46.6%. Policy support and price wars drove strong growth among domestic brands, and exports reached record highs. In Europe, market demand showed signs of recovery, but NEV growth was only in the low single digits due to subsidy reductions and supply chain bottlenecks, while Chinese automakers accelerated localized layouts to capture market share. The U.S. NEV market lagged behind China and Europe, with high interest rates and policy uncertainty suppressing its potential. Emerging markets such as Southeast Asia and Latin America showed early signs of explosive growth.
Figure 1: Global NEV Passenger Car Sales and Share by Country
In 2025H1 China's NEV market continued its rapid growth from 2024H2 under the influence of the dual new policies and purchase tax exemptions, with H1 sales reaching 6.935 million units.
Figure 2: China NEV Sales and Year-on-Year Growth Rate
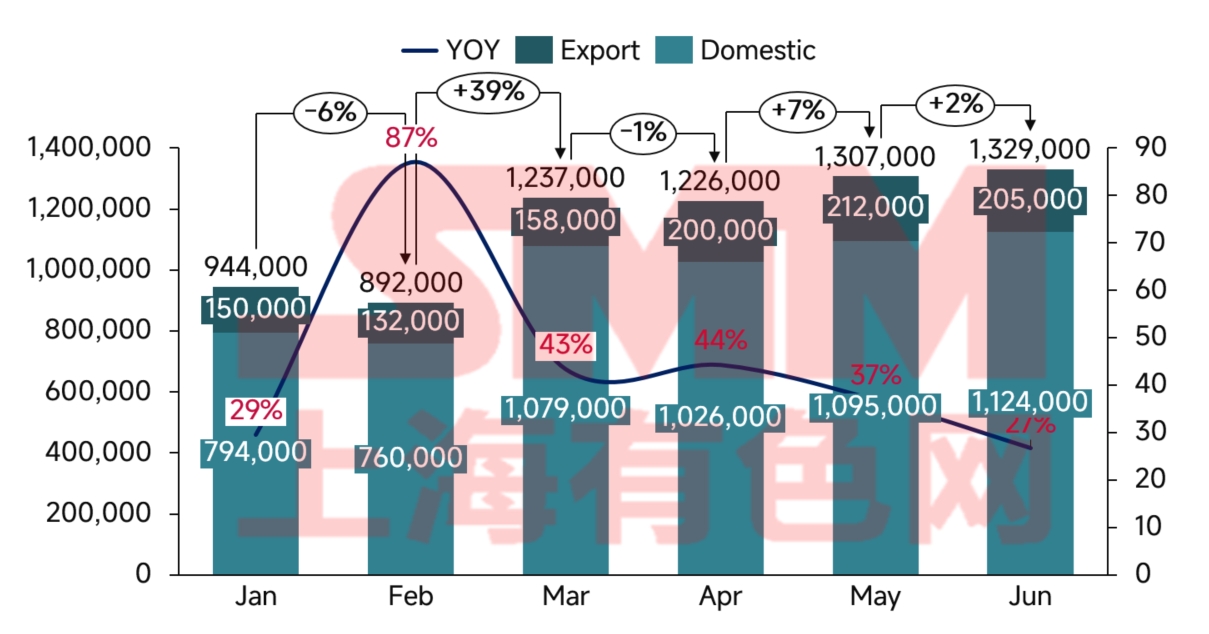
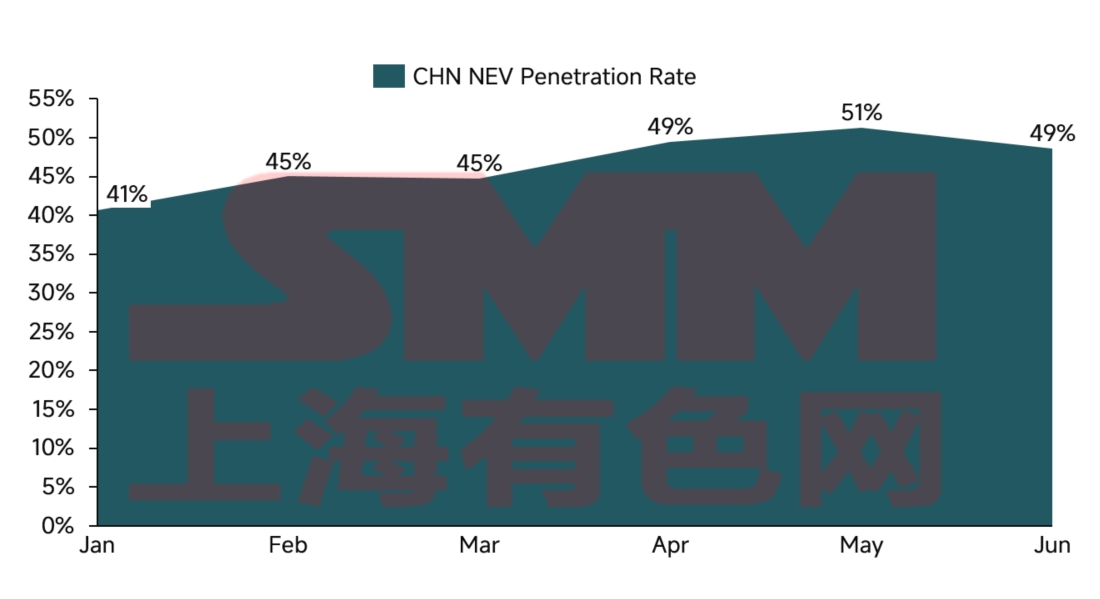
Figure 3: Monthly NEV Penetration Rate in China
From a policy perspective, H1 2025 saw the formation of a multi-tiered incentive system centered on purchase tax exemptions, supplemented by trade-in subsidies and local supporting policies. The purchase tax exemption policy, extended to the end of 2025, maintains a maximum exemption of CNY 30,000 per vehicle, directly reducing consumer purchasing costs. Market research data show that for vehicles priced between CNY 150,000 and 200,000, the tax exemption is equivalent to an 8.5% discount on the vehicle price, significantly influencing purchasing decisions.
The trade-in subsidy policy achieved a major breakthrough this year. The subsidy scope was expanded from National V emission standard vehicles to include some National IV vehicles, with the maximum subsidy per vehicle increased to CNY 15,000. This policy drove a noticeable replacement effect, with 1.2 million NEVs sold through trade-in channels in H1, accounting for 25% of total sales. However, regional disparities emerged in policy implementation. Tier-1 cities like Shanghai and Shenzhen saw high policy efficiency, with subsidy utilization rates exceeding 95%, while some Tier-3 and Tier-4 cities saw diminished effects due to incomplete supporting measures.
Policy support for charging infrastructure also achieved significant results. Data from the China Charging Alliance show that as of the end of June 2025, the total number of EV charging facilities in China reached 16.1 million, a 55.6% year-on-year increase. This includes 4.096 million public charging points and 12.004 million private charging points, up 36.7% and 63.3%, respectively. The top 10 regions, including Guangdong, Zhejiang, and Jiangsu, accounted for 67% of public charging piles. The alleviation of "range anxiety" due to increased charging network density indirectly boosted NEV adoption. Data indicate that in regions with charging pile densities exceeding 3 units per square kilometer, NEV sales growth was 40% higher than in other areas.
The impact of road privilege policies should not be overlooked. Currently, 80 cities in China have implemented unrestricted driving policies for NEVs, accounting for 65% of national NEV sales. In cities with strict driving restrictions, such as Beijing and Guangzhou, the value of NEV road privileges is equivalent to 3–5% of the vehicle price, serving as a key purchasing incentive.
Figure 4: China NEV Wholesale and Retail Sales
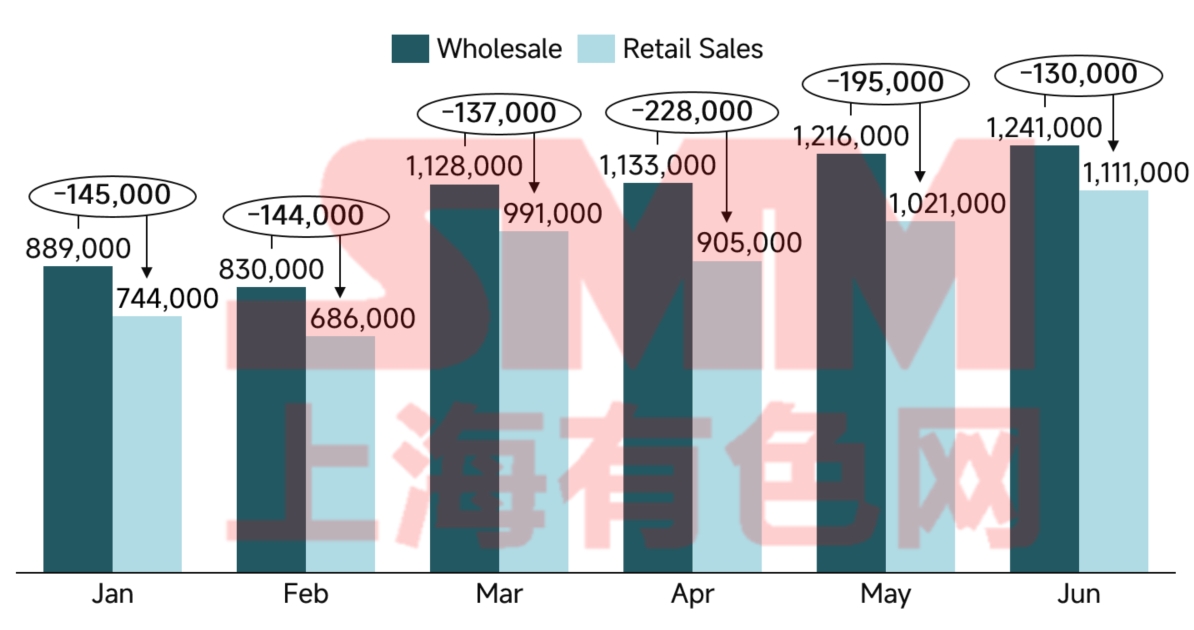
The "zero-kilometer used car" phenomenon drew significant national attention in H1 2025. These vehicles, newly registered but immediately resold as used cars, represent a form of disguised price reduction, exacerbating the already intense price competition and impacting industry profitability and healthy development. The gap between wholesale and retail sales figures partially reflects dealer inventory levels. In H1 2025, some automakers and dealers faced substantial inventory pressure, with high inventory levels motivating participation in price wars.
The price competition in China's NEV market exhibited distinct phase characteristics in 2025:
1) Q1: Feature upgrades without price hikes – Automakers maintained price structures by adding features. BYD led the industry by introducing L2+ autonomous driving in CNY 150,000-class vehicles, sparking an industry-wide feature upgrade trend. However, market feedback showed that actual usage frequency and willingness to pay for autonomous driving features fell short of expectations.
2) Q2: Feature reductions and price cuts – Automakers began launching simplified, lower-priced models. For example, BYD’s Yuan UP introduced a base model priced at CNY 74,800, CNY 25,000 cheaper than the original version but with some autonomous driving features removed. This shift reflected changing consumer psychology: against a backdrop of slowing economic growth, buyers prioritized affordability over advanced features.
The competitive landscape is undergoing profound restructuring. BYD maintained its lead with H1 sales of 2.146 million units, though its 33% growth rate slowed compared to 2024. Among emerging automakers, Xiaomi Auto achieved a breakthrough with its SU7 and YU7 models, amassing 500,000 cumulative orders. Li Auto saw its first-ever year-on-year decline (24%), highlighting challenges for its extended-range technology. Leapmotor and Xpeng posted strong growth by focusing on the CNY 100,000–150,000 mainstream market.
Joint-venture brands struggled in the NEV transition. Their NEV penetration rate was only 5.3%, far below the industry average. Aside from Volkswagen’s ID series, most joint-venture NEV products suffered from unclear positioning and poor cost-performance ratios. If this trend continues, joint-venture brands risk fundamental challenges to their market position.
Figure 5: China BEV Sales and Growth Rate
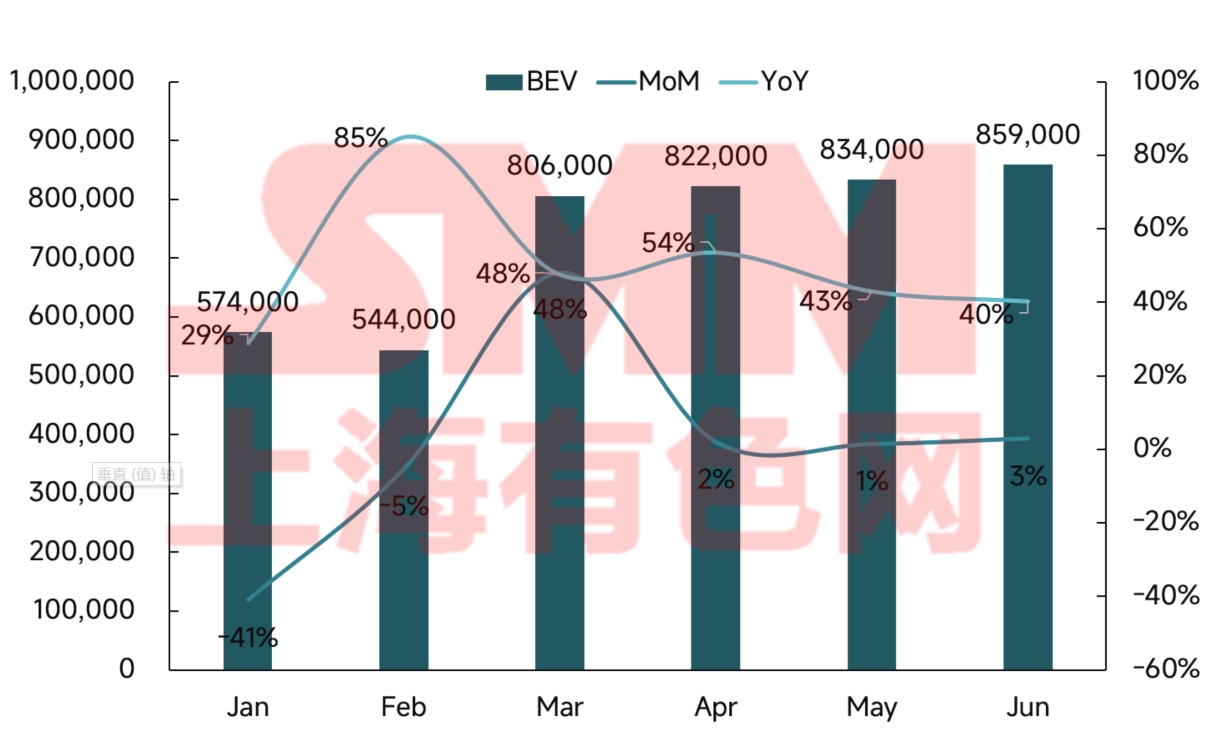
Figure 6: China PHEV Sales and Growth Rate
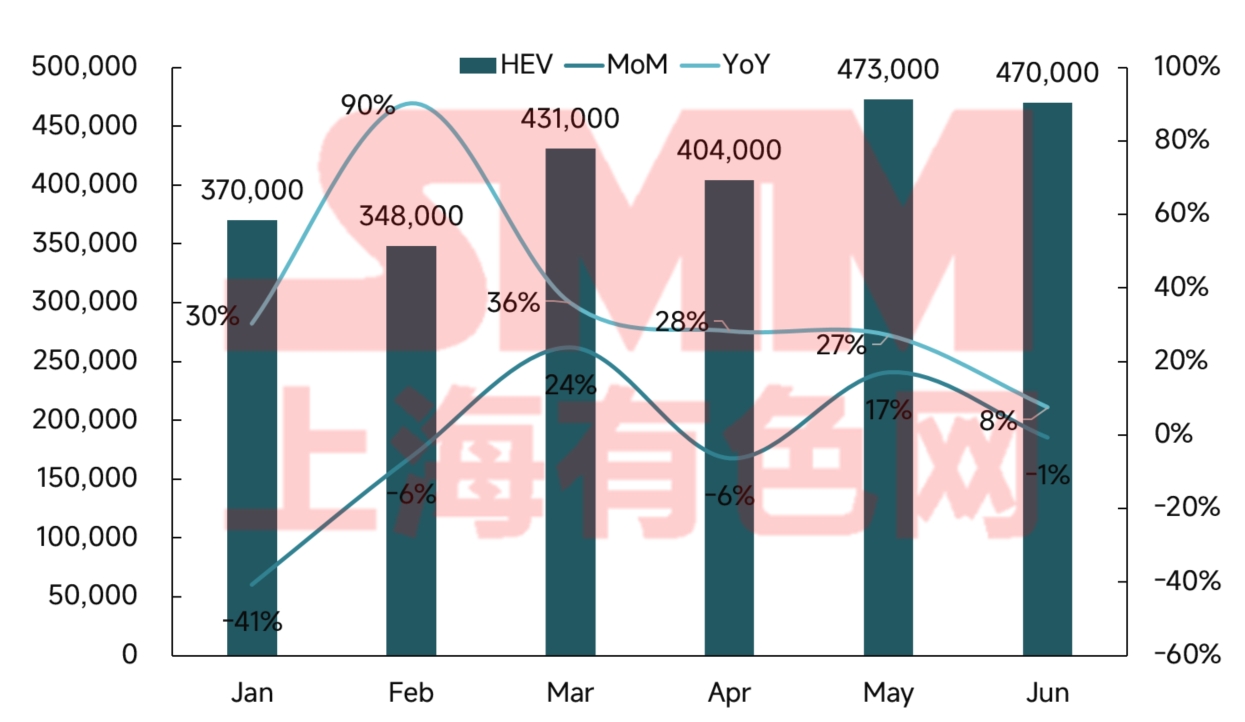
In H1 2025, China’s NEV market exhibited distinct development patterns for BEVs and PHEVs. While BEVs remained dominant, their slowing growth signaled market maturation, whereas PHEVs maintained strong momentum, becoming a key growth driver. This divergence reflects the different value propositions of the two technologies in meeting consumer needs.
Technologically, BEVs hold inherent advantages in intelligence and driving experience, appealing to younger, tech-savvy consumers. Although range anxiety is easing with battery advancements and charging infrastructure, BEVs still face limitations in long-distance travel. In contrast, PHEVs, with their dual-fuel capability, better meet family users’ demand for flexibility, particularly in Tier-3/4 cities and rural areas with underdeveloped charging networks. Notably, PHEV technology is evolving rapidly, with extended electric-only ranges now approaching BEV-like performance for daily commutes.
Consumer demographics also differ markedly. BEV buyers are concentrated in license-restricted cities, primarily as additional vehicles for tech-savvy households. PHEV buyers, more common in non-restricted regions, are often first-time buyers seeking versatile vehicles. These differences shape divergent sales strategies: BEV brands favor direct sales for brand experience, while PHEV brands rely more on traditional dealer networks for broader market penetration.
Competitively, the BEV market has stabilized around a Tesla-BYD duopoly, leaving little room for emerging brands. In contrast, while BYD dominates PHEVs, Li Auto, AITO, and others have carved out niches, and traditional automakers are rapidly catching up with hybrid offerings. This contrast underscores how BEV competition emphasizes scale and technology, whereas PHEVs allow more differentiation.
Long-term, both technologies will evolve along distinct paths. BEVs will focus on ultra-fast charging and energy density to enhance usability, while PHEVs will prioritize larger batteries and higher efficiency to maximize electric-only operation. Market-wise, BEVs must move beyond price wars through innovation, whereas PHEVs should capitalize on untapped lower-tier cities. Notably, technological convergence may blur the lines between the two, giving rise to hybrid product forms.
Looking ahead to H2 2025, we anticipate the following trends:
1) Policy effects may diminish – As NEV penetration exceeds 50%, policy-driven growth will gradually give way to organic demand. The 2026 reduction of purchase tax exemptions to 50% may trigger year-end rush purchases but will mark the beginning of fading policy benefits.
2) Technology shifts will accelerate consolidation – Breakthroughs in solid-state batteries, 800V platforms, and urban NOA will reach critical mass in H2. Companies with relevant technologies will gain an edge, while laggards risk obsolescence.
3) Industry consolidation will intensify – More M&A activity is expected as weaker brands exit. Leading players with scale and capital will expand through acquisitions.
4) Direct price cuts will decrease, but low-price competition will persist – Amid industry efforts to curb cutthroat competition, further NEV price declines may stall. However, with no signs of price hikes and new models launching below expectations, automakers will likely maintain volume-over-margin strategies.
![[SMM Analysis] Ternary Cathode Payables May See Modest Increase in Q2](https://imgqn.smm.cn/usercenter/nVnLo20251217171728.jpg)