On September 30, 2026, the Service Industry Survey Center of the National Bureau of Statistics (NBS) and the China Federation of Logistics and Purchasing released China's Purchasing Managers' Index (PMI). Huo Lihui, chief statistician at the NBS Service Industry Survey Center, provided an interpretation. In September, the manufacturing PMI, the non-manufacturing business activity index, and the composite PMI output index stood at 50.1%, 50.2%, and 50.7%, respectively, up 0.3, 1.2, and 1.2 percentage points from the previous month, indicating a rebound in economic prosperity.By enterprise size, the PMI for large enterprises was 50.6%, unchanged from the previous month and above the threshold. The PMIs for medium-sized and small enterprises were 49.7% and 48.9%, respectively, up 0.3 and 1.0 percentage points from the previous month, both below the threshold. Among the sub-indices that constitute the manufacturing PMI, the production index, new orders index, and supplier delivery time index were all above the threshold, while the raw material inventory index and employment index were below the threshold.
China's Purchasing Managers' Index Performance in September 2026
I. Manufacturing PMI Performance in China
In September, the manufacturing PMI was 50.1%, up 0.3 percentage points from the previous month, moving into expansion territory.
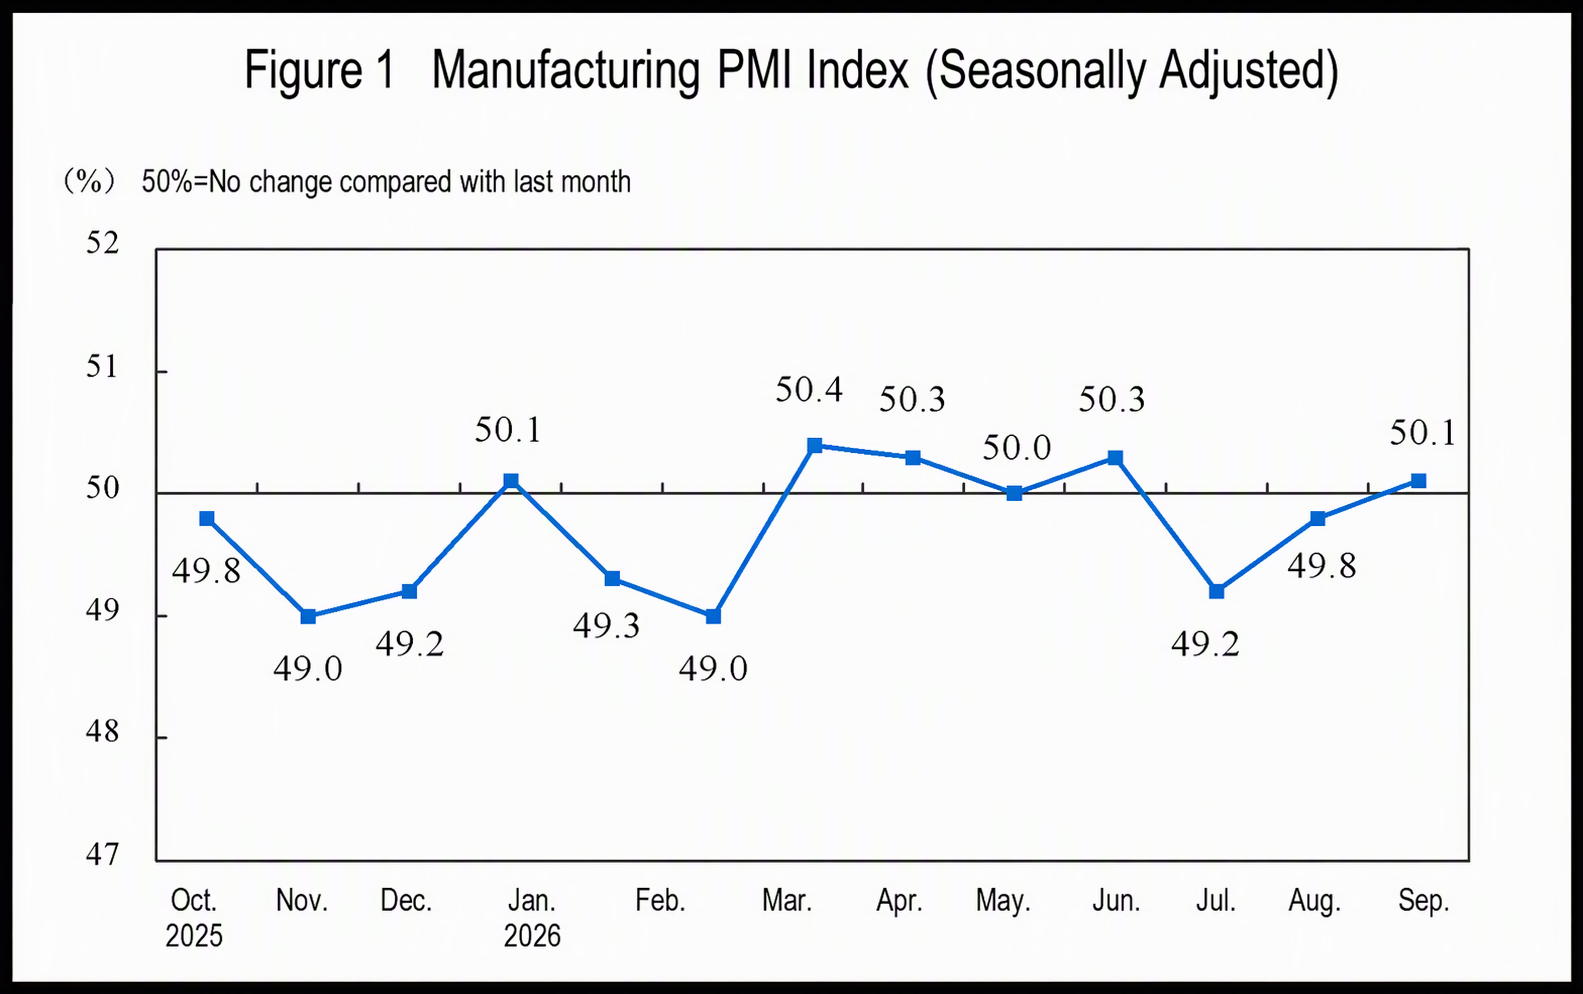
By enterprise size, the PMI for large enterprises was 50.6%, unchanged from the previous month and above the threshold. The PMIs for medium-sized and small enterprises were 49.7% and 48.9%, respectively, up 0.3 and 1.0 percentage points from the previous month, both below the threshold.
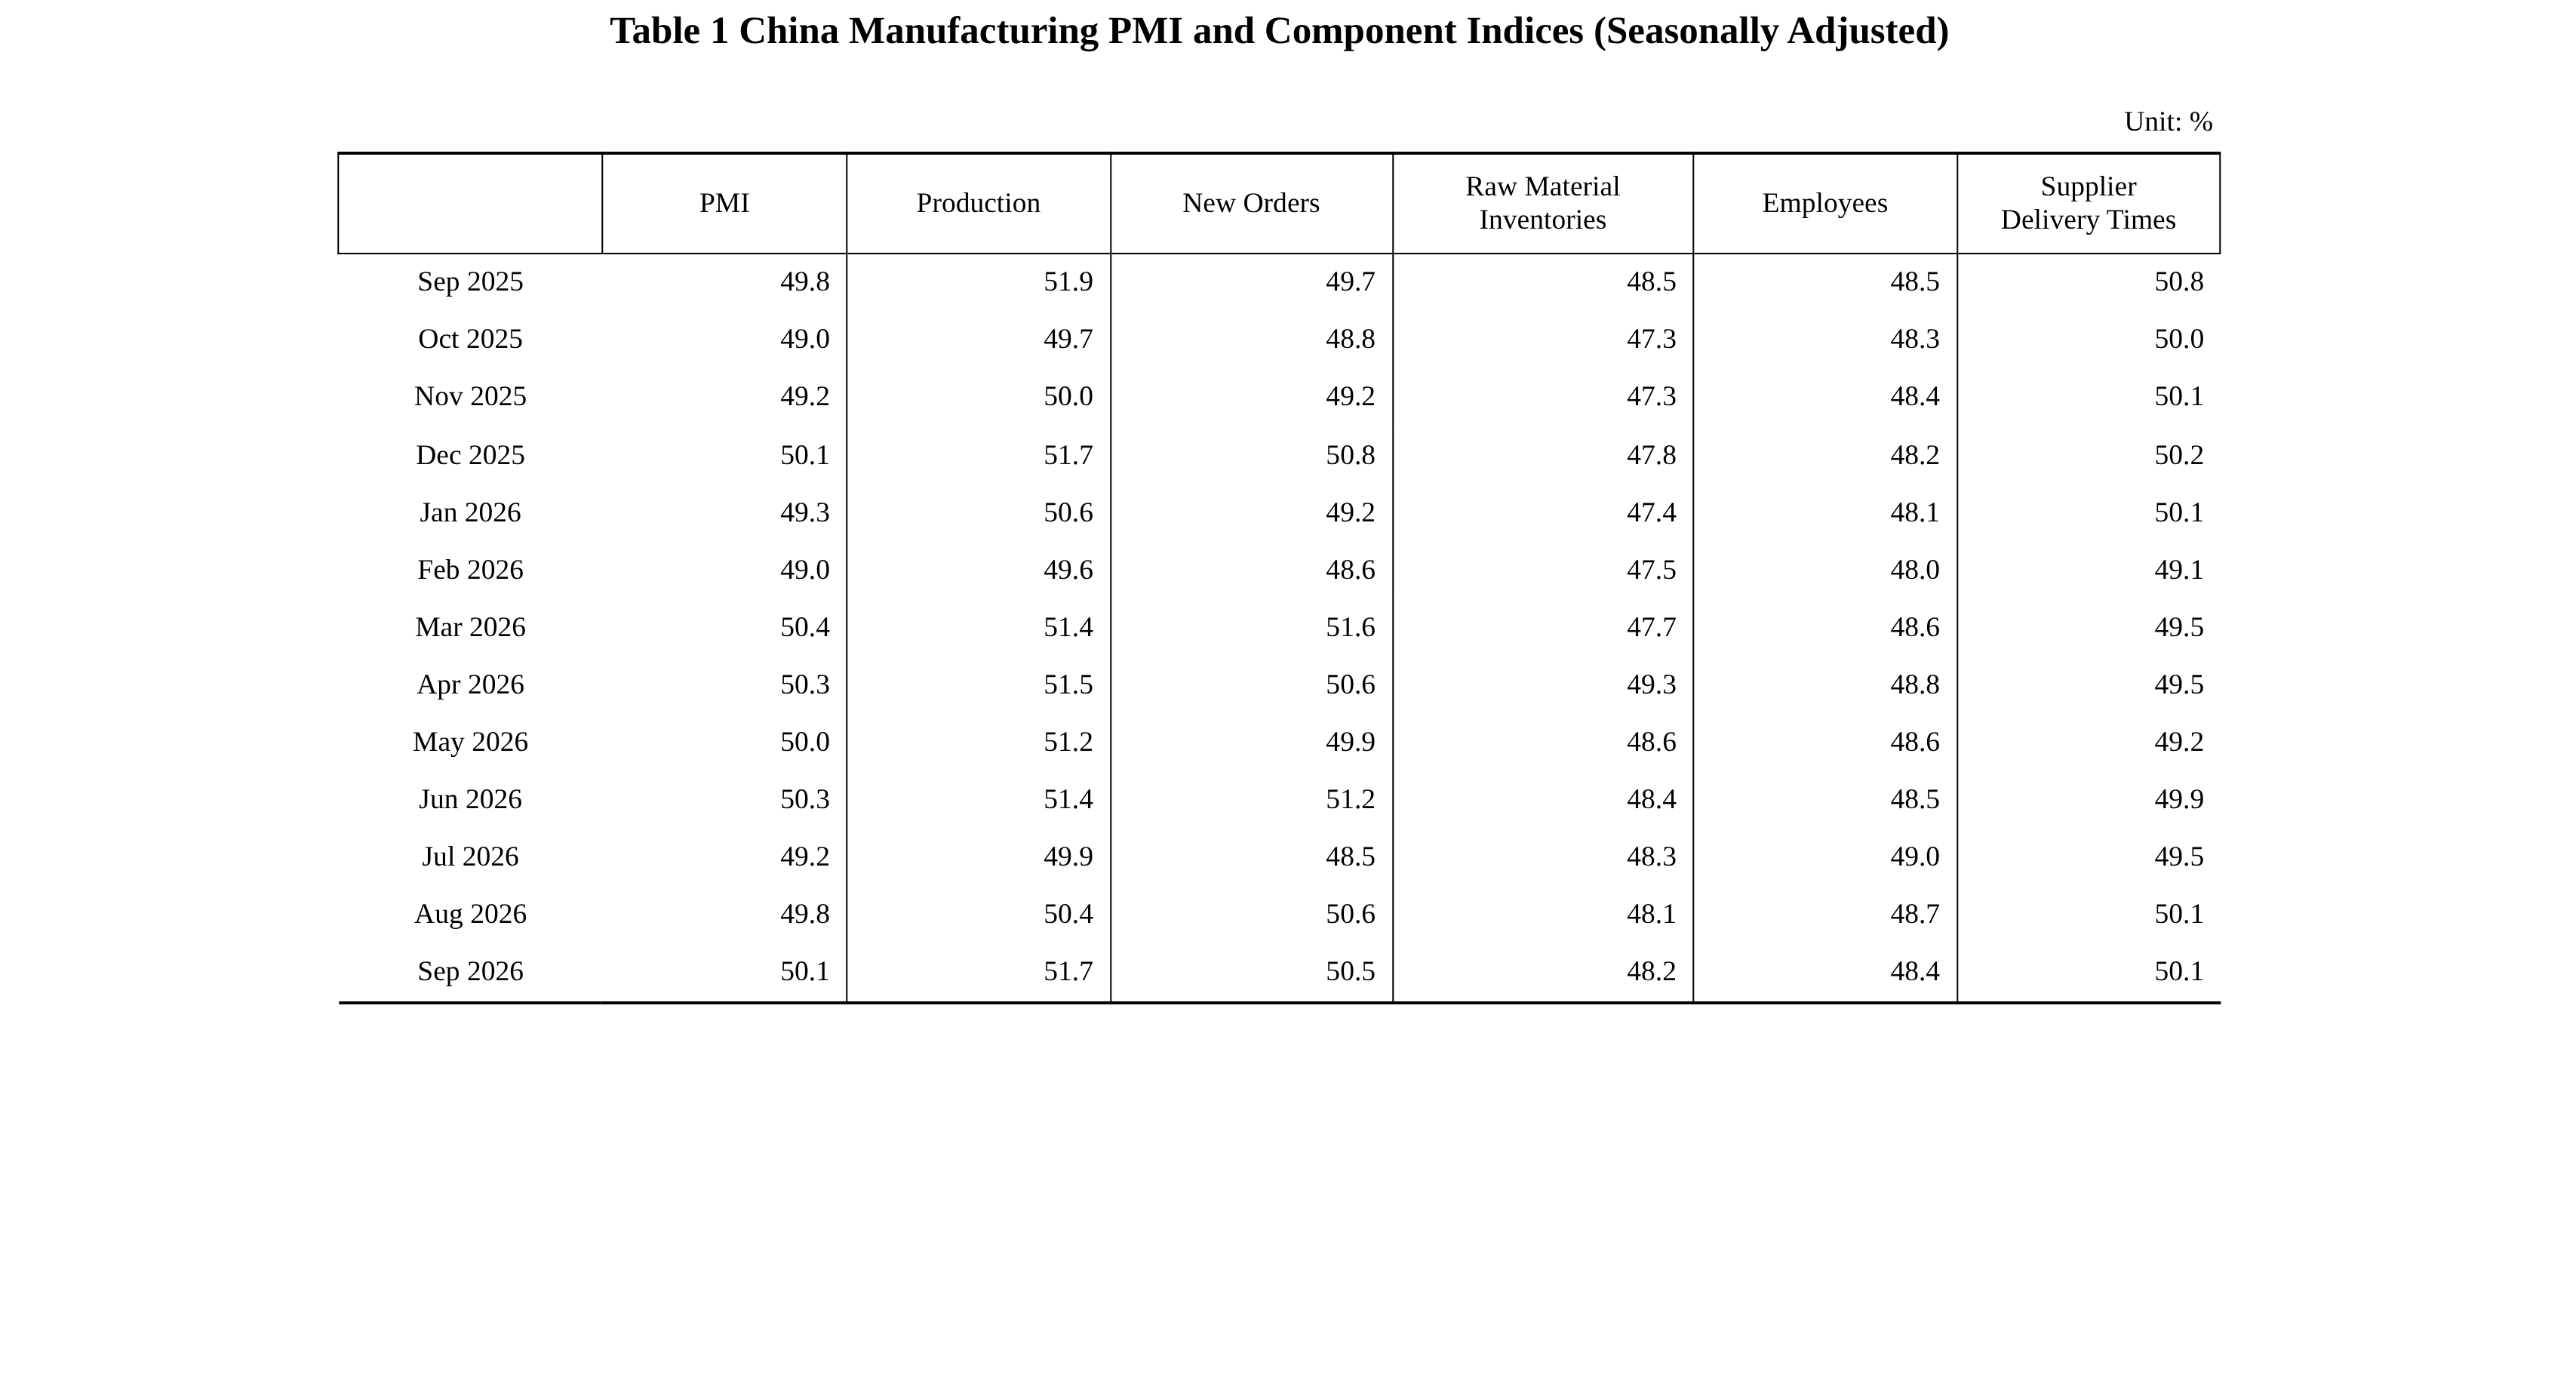
Among the sub-indices that constitute the manufacturing PMI, the production index, new orders index, and supplier delivery time index were all above the threshold, while the raw material inventory index and employment index were below the threshold.
The production index was 51.7%, up 1.3 percentage points from the previous month, indicating that manufacturing production activity expanded at a faster pace.
The new orders index was 50.5%, down 0.1 percentage points from the previous month but still above the threshold, indicating that manufacturing market demand continued to improve.
The raw material inventory index was 48.2%, up 0.1 percentage points from the previous month, indicating that the decline in manufacturing raw material inventory levels narrowed slightly.
The employment index was 48.4%, down 0.3 percentage points from the previous month, indicating a pullback in manufacturing employment sentiment.
The supplier delivery time index was 50.1%, unchanged from the previous month and above the threshold, indicating that delivery times by manufacturing raw material suppliers continued to accelerate.
II. Non-Manufacturing PMI Performance in China
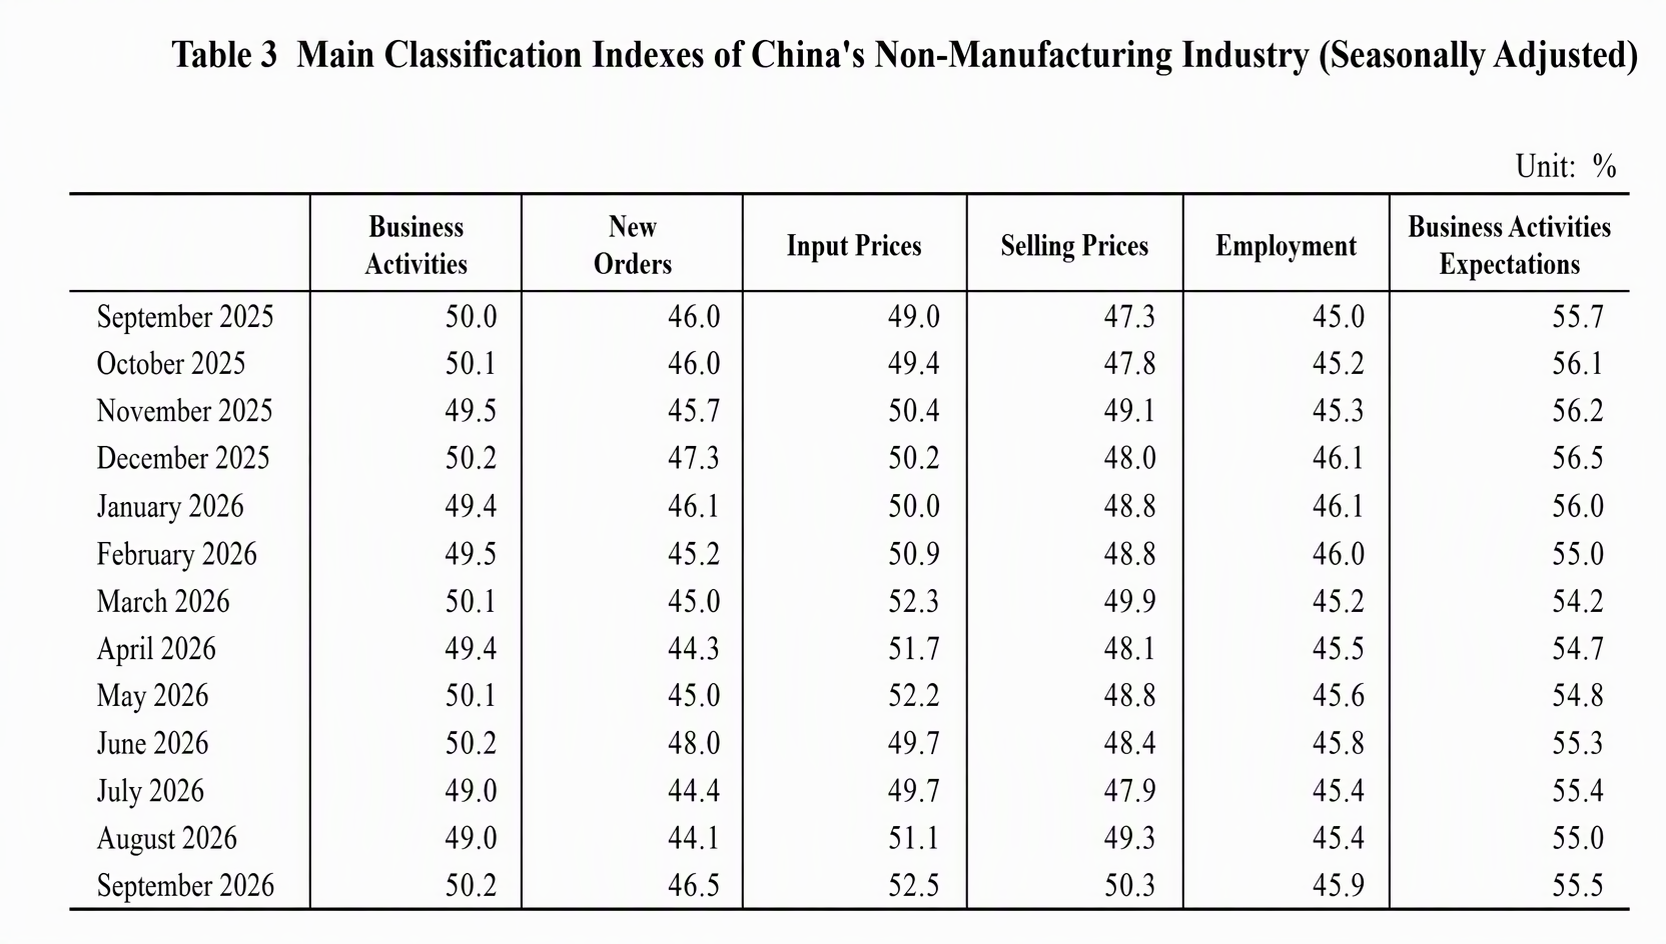
In September, the non-manufacturing business activity index was 50.2%, up 1.2 percentage points from the previous month, indicating a notable rebound in non-manufacturing prosperity.
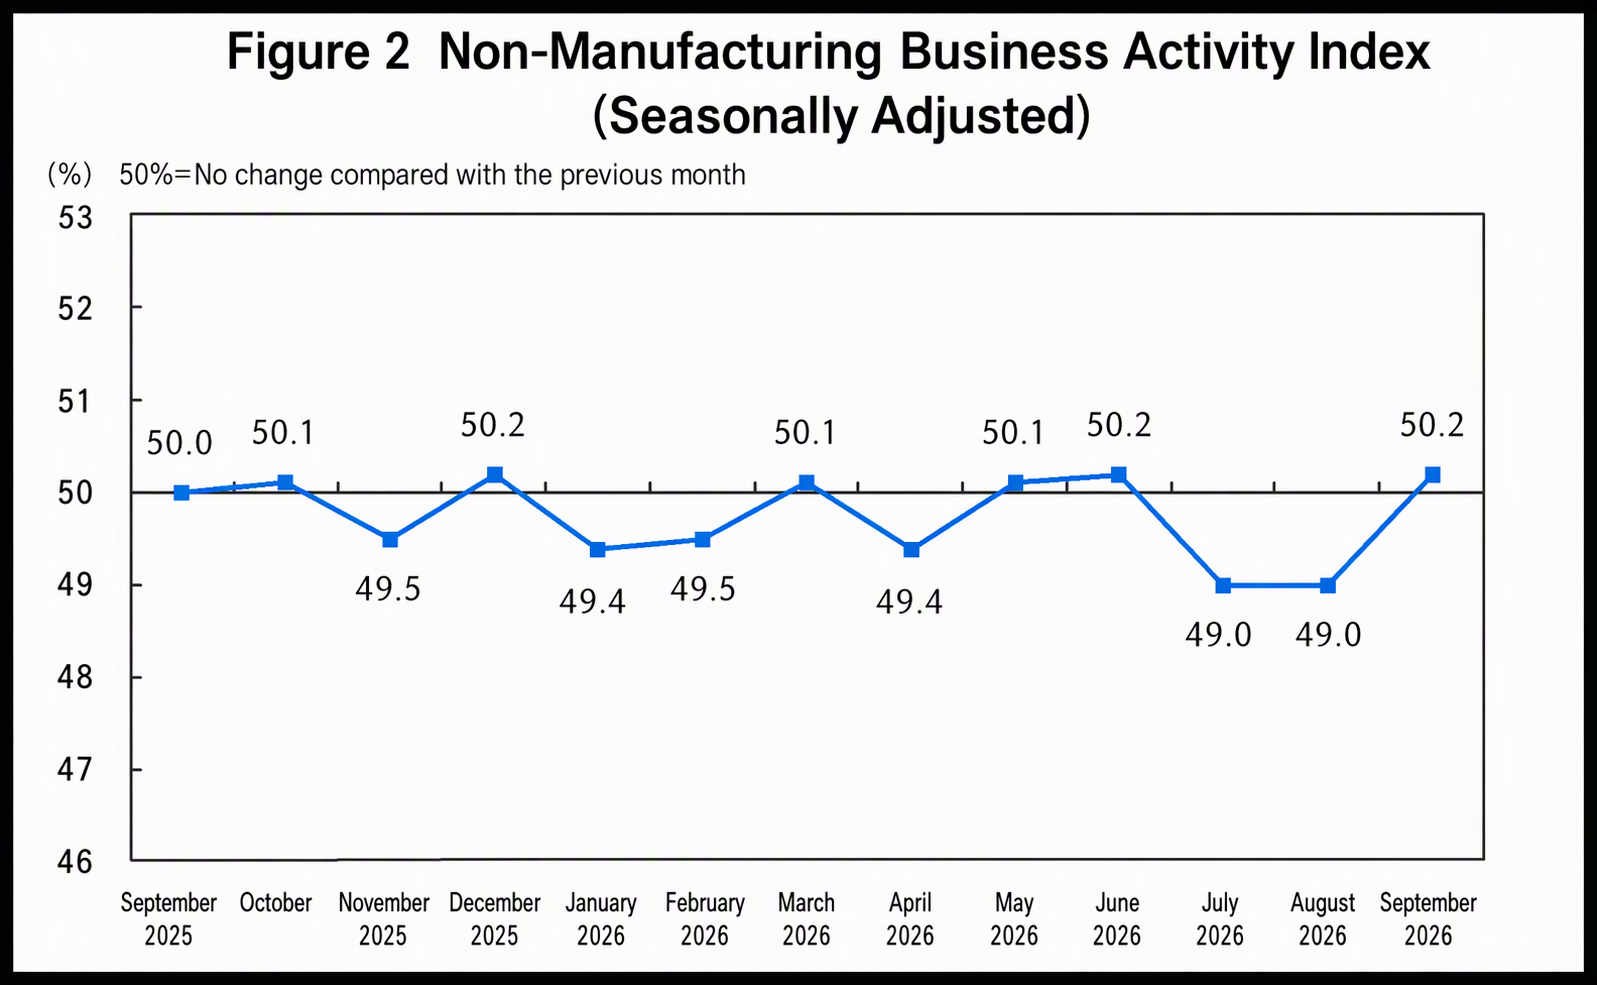
By industry, the Business Activity Index for construction was 50.3%, up 3.4 percentage points from the previous month; the Business Activity Index for services was 50.2%, up 0.9 percentage points from the previous month. Within services, the Business Activity Indices for telecommunications, broadcasting, television and satellite transmission services, monetary and financial services, and insurance were all in the relatively high expansion territory above 55.0%, while those for capital market services and real estate were below the threshold.
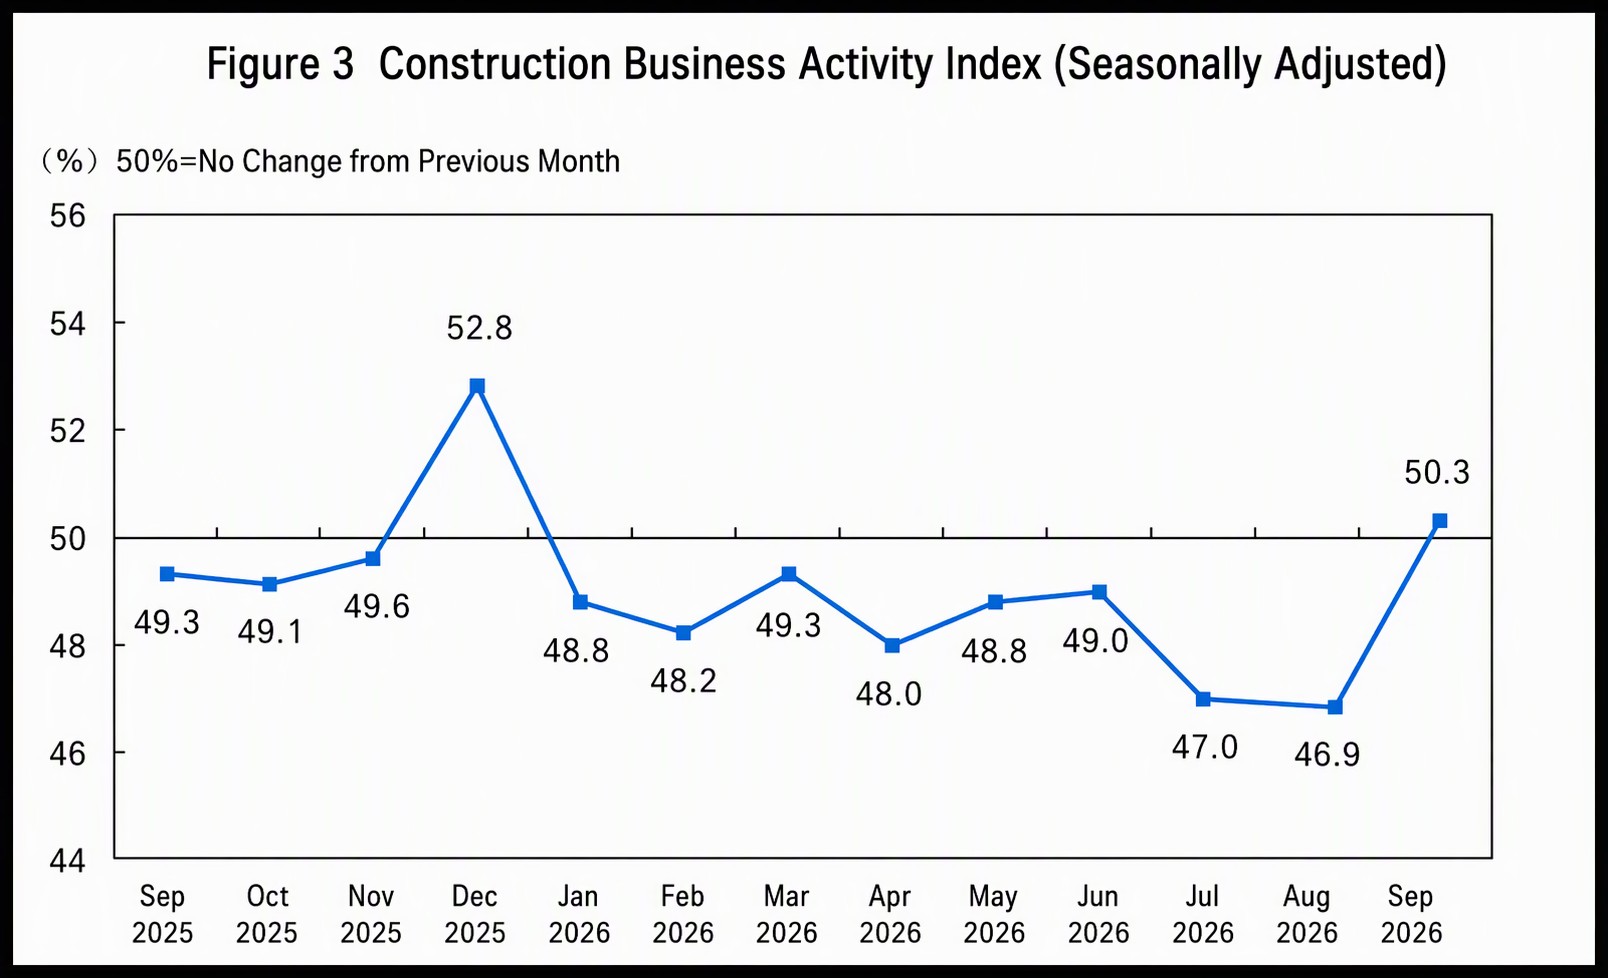
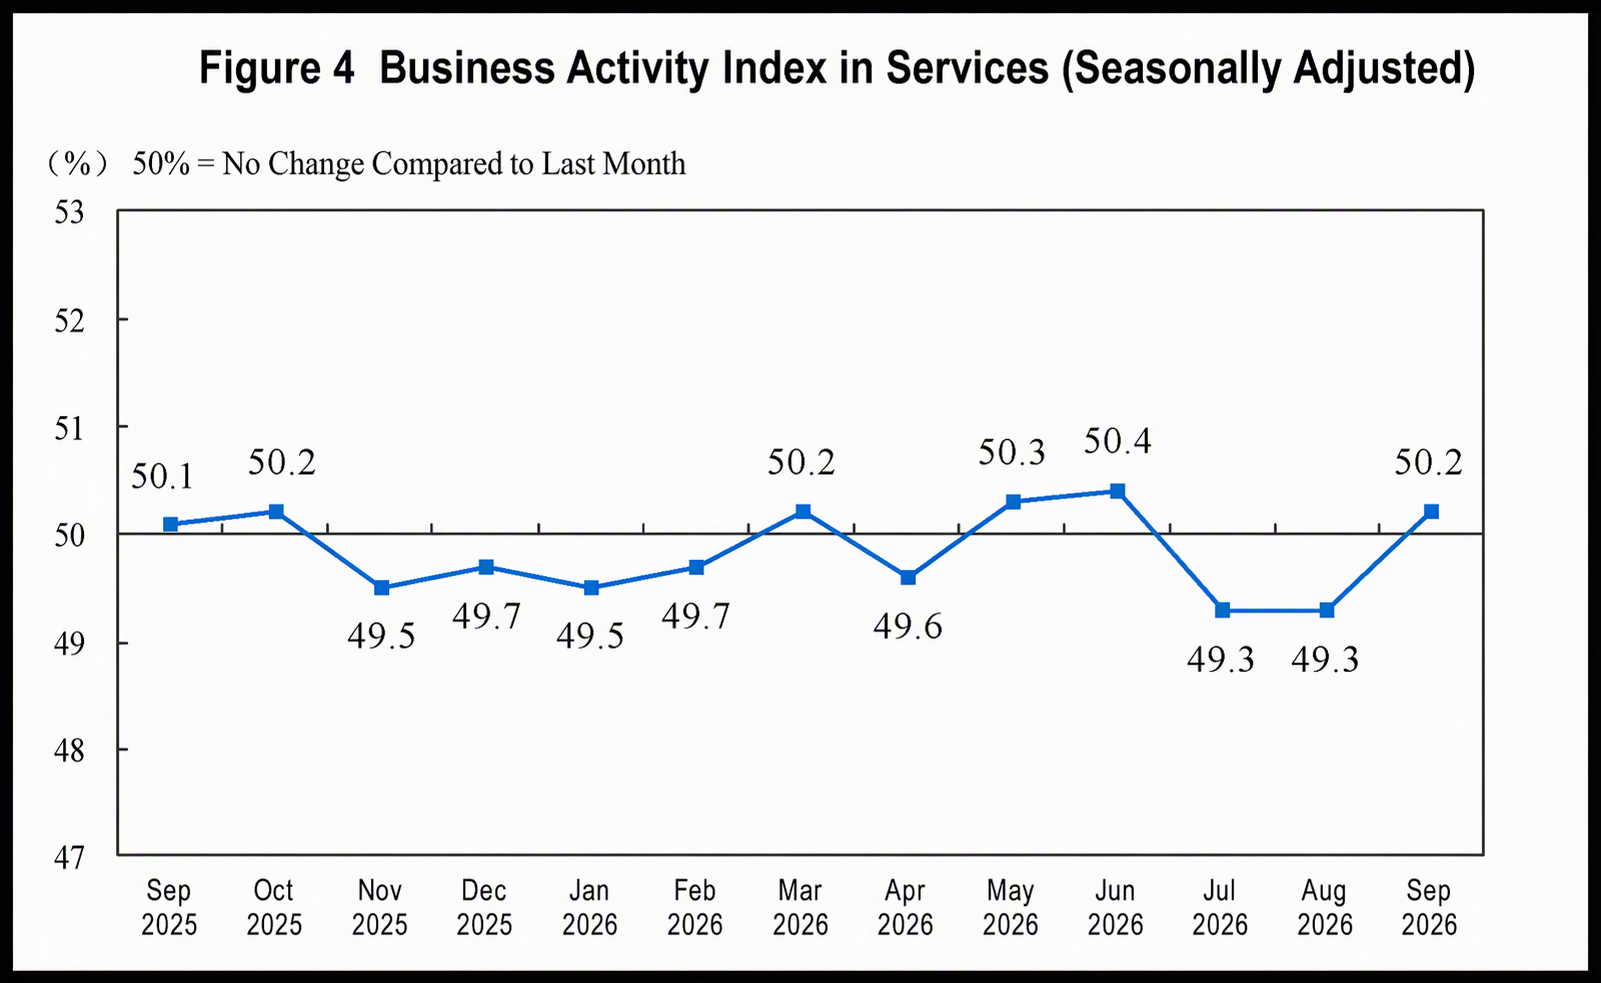
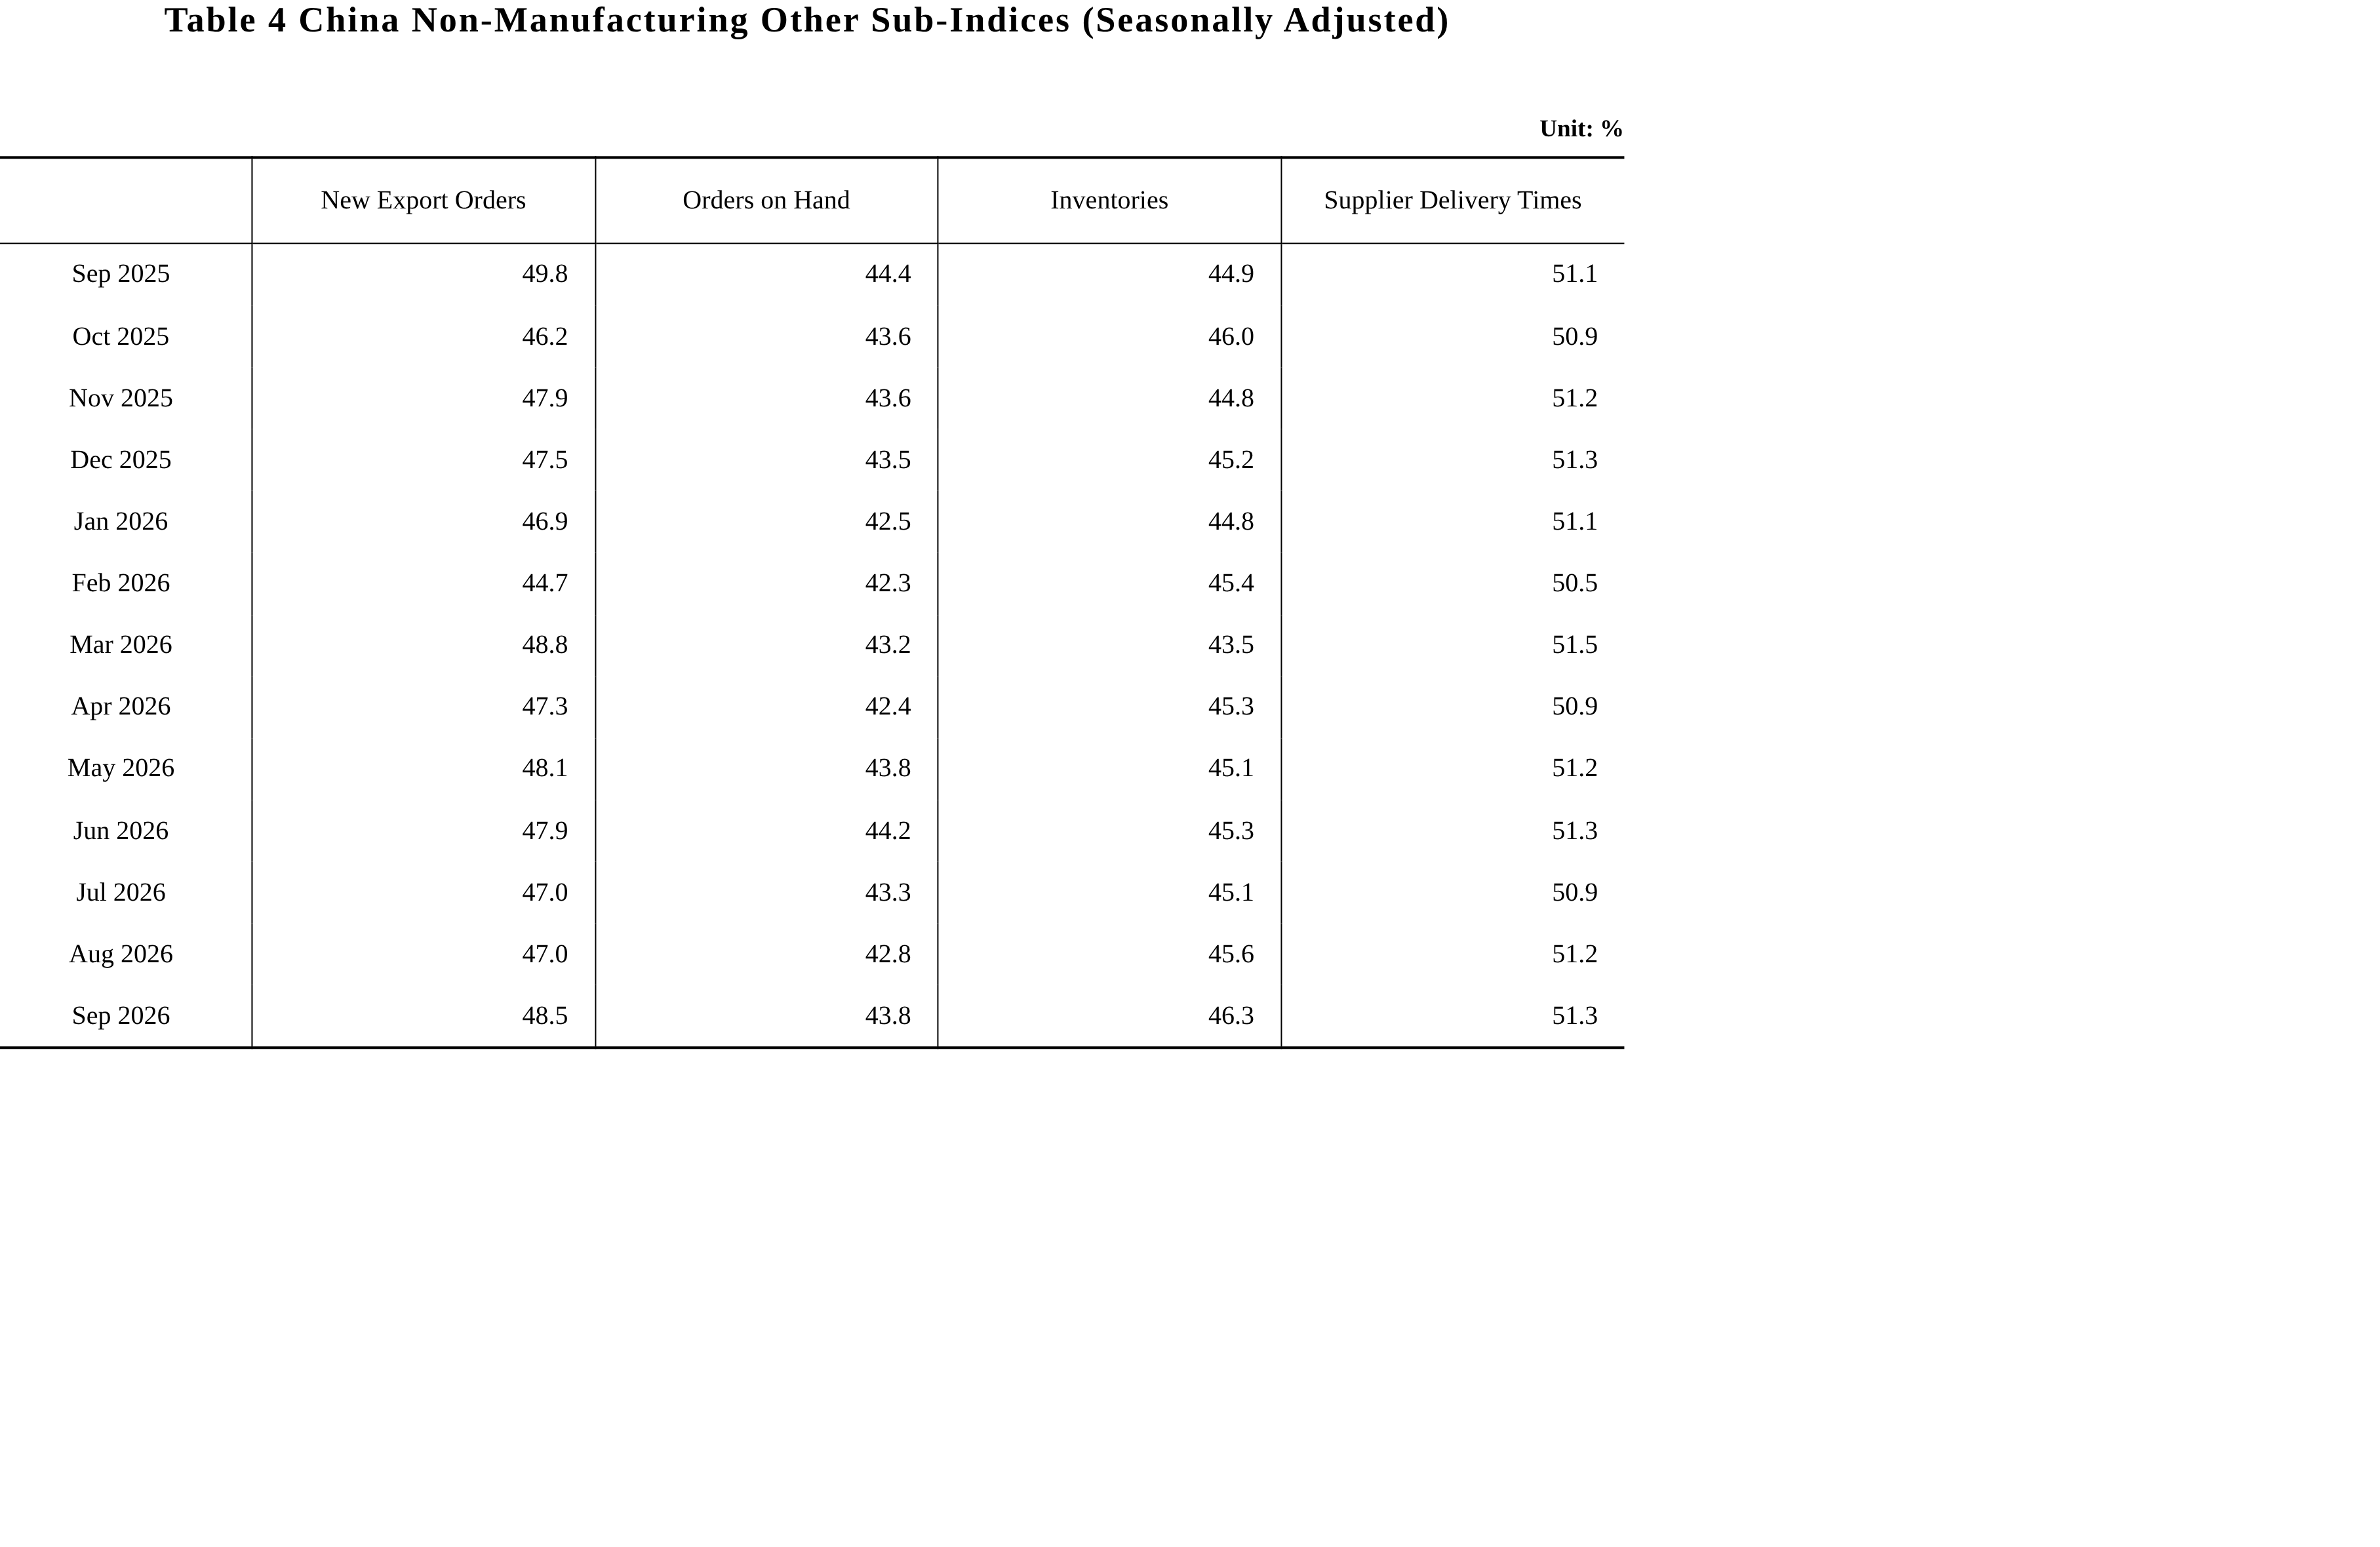
The New Orders Index was 46.5%, up 2.4 percentage points from the previous month, indicating a rebound in market demand in the non-manufacturing sector. By industry, the New Orders Index for construction was 45.7%, up 3.3 percentage points from the previous month; the New Orders Index for services was 46.7%, up 2.2 percentage points from the previous month.
The Input Prices Index was 52.5%, up 1.4 percentage points from the previous month, indicating that the overall level of input prices used by non-manufacturing enterprises for business activities continued to rise. By industry, the Input Prices Index for construction was 54.0%, up 2.8 percentage points from the previous month; the Input Prices Index for services was 52.2%, up 1.1 percentage points from the previous month.
The Selling Prices Index was 50.3%, up 1.0 percentage points from the previous month, indicating that the overall level of selling prices of non-manufacturing enterprises rebounded somewhat. By industry, the Selling Prices Index for construction was 48.5%, down 1.3 percentage points from the previous month; the Selling Prices Index for services was 50.6%, up 1.4 percentage points from the previous month.
The Employment Index was 45.9%, up 0.5 percentage points from the previous month, indicating an improvement in employment sentiment in the non-manufacturing sector. By industry, the Employment Index for construction was 44.3%, up 1.3 percentage points from the previous month; the Employment Index for services was 46.2%, up 0.4 percentage points from the previous month.
The Business Activity Expectations Index was 55.5%, up 0.5 percentage points from the previous month, indicating that non-manufacturing enterprises' confidence in market development strengthened somewhat. By industry, the Business Activity Expectations Index for construction was 55.4%, up 3.6 percentage points from the previous month; the Business Activity Expectations Index for services was 55.5%, unchanged from the previous month.
III. China's Composite PMI Output Index
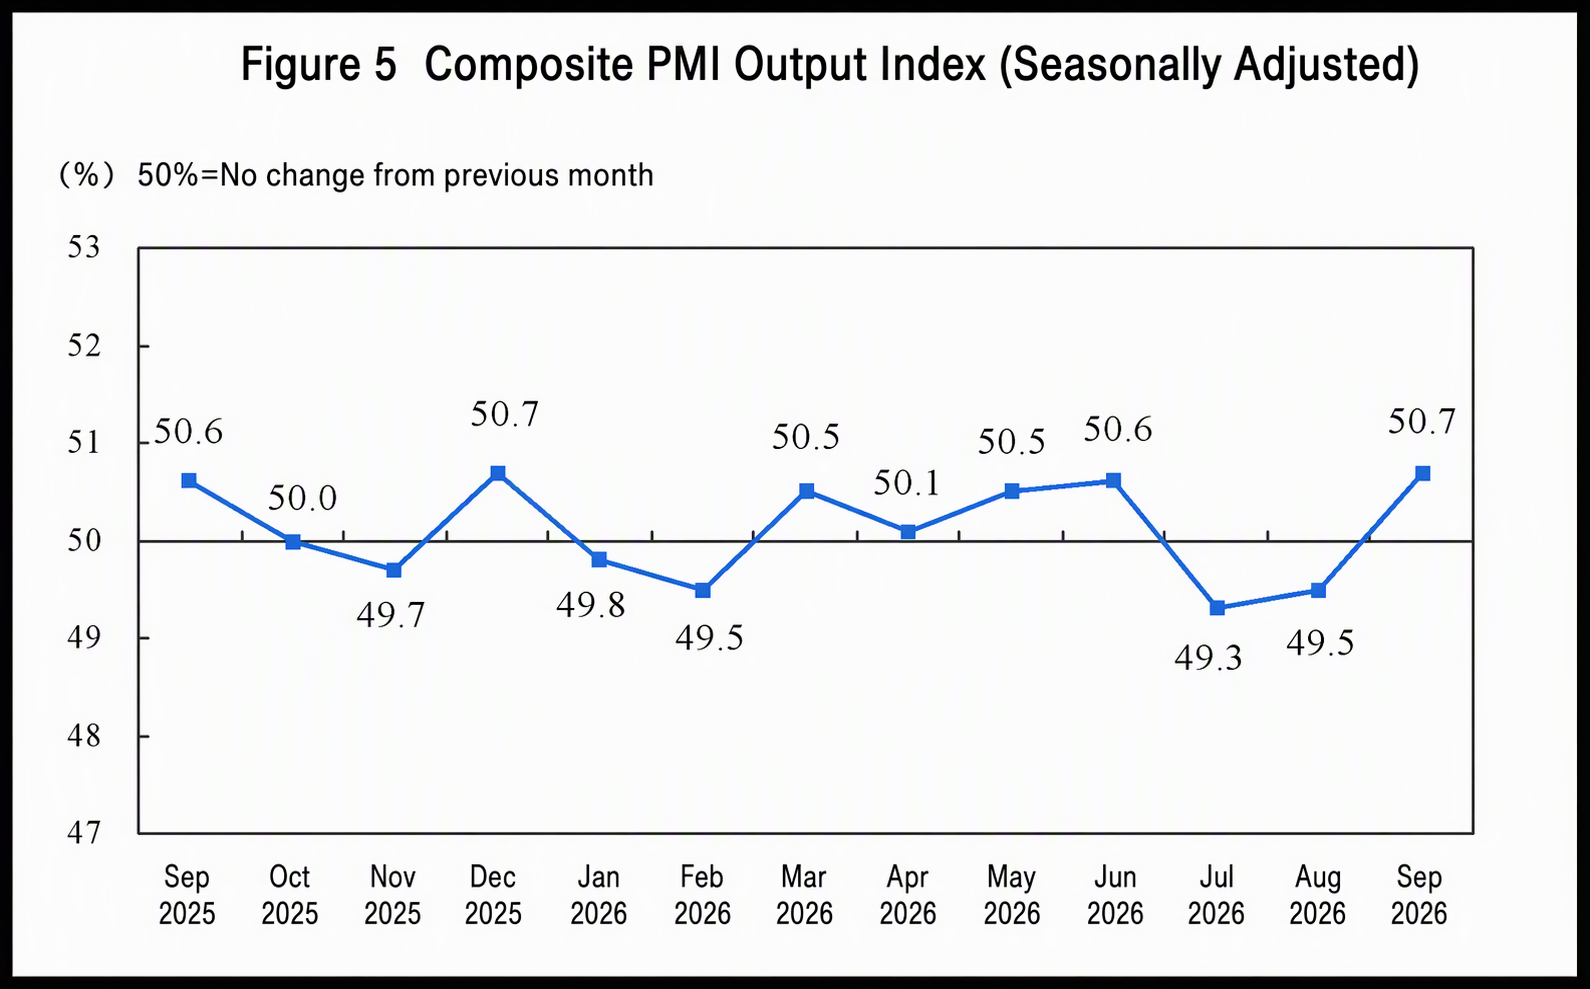
In September, the Composite PMI Output Index was 50.7%, up 1.2 percentage points from the previous month, rising above the threshold, indicating that the production and business activities of Chinese enterprises expanded overall compared with the previous month.
PMI rose into expansion territory in September
—Senior Statistician Huo Lihui of the Service Survey Center of the National Bureau of Statistics interprets China's PMI for September 2026
On September 30, 2026, the Service Survey Center of the National Bureau of Statistics and the China Federation of Logistics and Purchasing released China's PMI. In response, Huo Lihui, chief statistician of the Service Industry Survey Center of the National Bureau of Statistics (NBS), provided an interpretation.
In September, the manufacturing PMI, the non-manufacturing business activity index, and the composite PMI output index stood at 50.1%, 50.2%, and 50.7%, respectively, up by 0.3, 1.2, and 1.2 percentage points from the previous month, indicating a rebound in economic prosperity.
I. The manufacturing PMI rebounded for two consecutive months
In September, the manufacturing PMI rose to 50.1%, returning to expansion territory. Among the 21 surveyed industries, 12 reported PMI readings above the threshold, an increase of 4 from the previous month, indicating a broader expansion across the manufacturing sector.
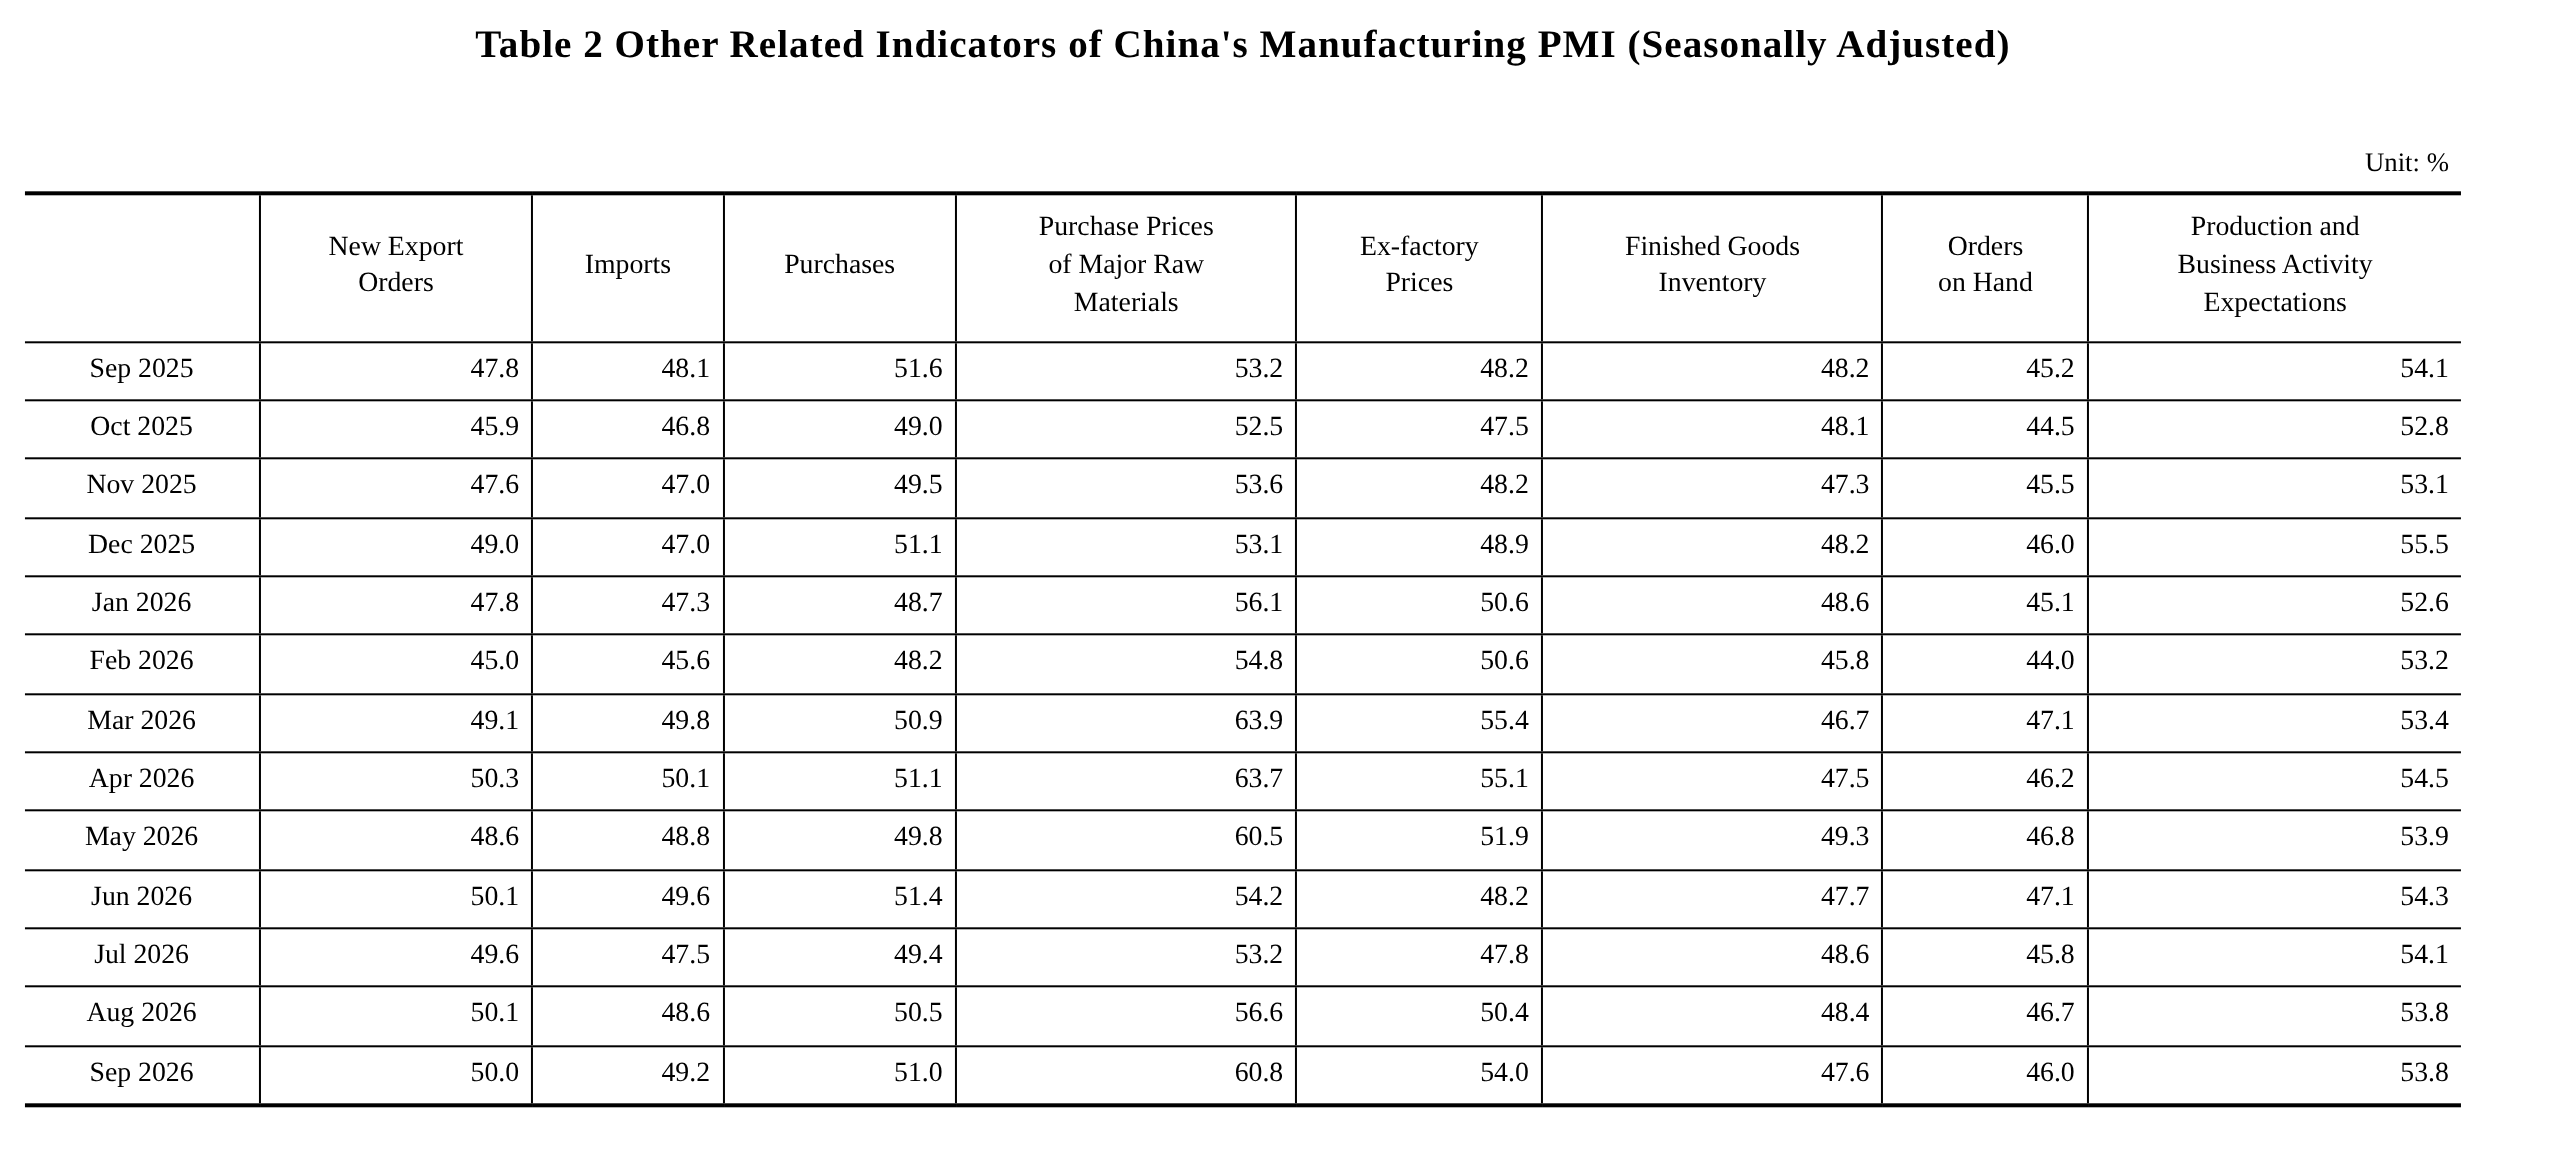
(1) Both production and demand remained in expansion. The manufacturing production index was 51.7%, up 1.3 percentage points from the previous month, while the new orders index was 50.5%, down slightly by 0.1 percentage point from the previous month. Both indices remained above the threshold, reflecting continued improvement in production and market demand among manufacturing enterprises. By industry, the production and new orders indices for agricultural and sideline food processing and pharmaceuticals both exceeded 55.0%, with relatively rapid release of production and demand at related enterprises. In contrast, the production and new orders indices for chemical raw materials and chemical products, as well as ferrous metal smelting and rolling processing, remained below the threshold. To meet production needs, enterprises further accelerated raw material procurement, with the purchasing volume index at 51.0%, up 0.5 percentage point from the previous month.
(2) Price indices continued to rise. Affected by recent increases in international commodity prices and rising demand in some industries, both the main raw material purchase price index and the ex-works price index rebounded for two consecutive months, with overall market prices in manufacturing rising notably. The main raw material purchase price index and the ex-works price index for manufacturing stood at 60.8% and 54.0%, respectively, up 4.2 and 3.6 percentage points from the previous month. By industry, as international crude oil prices rose sharply, both price indices for petroleum, coal, and other fuel processing, as well as chemical raw materials and chemical products, climbed to high levels above 60.0%.
(3) Three key industries expanded relatively quickly. The PMI for equipment manufacturing, high-tech manufacturing, and consumer goods stood at 51.0%, 52.5%, and 50.7%, respectively, all above the threshold, indicating generally active production and operation at related enterprises. The PMI for high-energy-consuming industries was 48.0%, up 0.1 percentage point from the previous month, showing some improvement in prosperity.
(4) Business conditions improved for small and medium-sized enterprises. The PMI for large manufacturing enterprises was 50.6%, unchanged from the previous month, as large enterprises maintained expansion. The PMI for medium-sized and small enterprises stood at 49.7% and 48.9%, respectively, up 0.3 and 1.0 percentage points from the previous month, with both showing a rebound in prosperity.
2. Non-Manufacturing Business Activity Index Rebounds Significantly
In September, the Non-Manufacturing Business Activity Index stood at 50.2%, up 1.2 percentage points from the previous month, returning to expansion territory and indicating a marked improvement in non-manufacturing business conditions.
(1) Services Business Activity Index rises into expansion territory. The Services Business Activity Index came in at 50.2%, up 0.9 percentage points from the previous month, moving above the threshold and signaling a rebound in services market activity. By sector, business activity indices for telecommunications, broadcasting and satellite transmission services, monetary and financial services, and insurance all stood above 55.0%, placing them in a relatively high expansion territory, with business volumes at related enterprises continuing to grow at a relatively fast pace; business activity indices for capital market services and real estate remained at low levels. The Services Business Activity Expectations Index was 55.5%, with expectations for services sector development continuing to improve in the near term.
(2) Construction Business Activity Index rises to its highest level of the year. The Construction Business Activity Index stood at 50.3%, up 3.4 percentage points from the previous month, returning to expansion territory and indicating an acceleration in construction progress. The Construction Business Activity Expectations Index was 55.4%, with construction enterprises showing increased confidence in future market development.
3. Composite PMI Output Index Above the Threshold
In September, the Composite PMI Output Index stood at 50.7%, up 1.2 percentage points from the previous month, moving above the threshold and indicating that overall production and business activities of Chinese enterprises expanded compared with the previous month. The Manufacturing Production Index and the Non-Manufacturing Business Activity Index, which together constitute the Composite PMI Output Index, stood at 51.7% and 50.2%, respectively.
![Inventory Changes of Aluminum Ingots and Billets Around the 2026 National Day [SMM Data]](https://imgqn.smm.cn/usercenter/YPMhF20251217171654.jpg)
![Pre-holiday Market Trading Weakens, Lead Prices to Move Sideways [SMM Lead Morning Meeting Summary]](https://imgqn.smm.cn/usercenter/rDPju20251217171722.jpg)
![The most-traded SHFE tin SN2610 contract closed at 409,590 yuan in the night session, up 0.37%, while LME tin 3M fell 1.03% to $53,786 [SMM Tin Morning News]](https://imgqn.smm.cn/usercenter/WPbpj20251217171753.jpg)