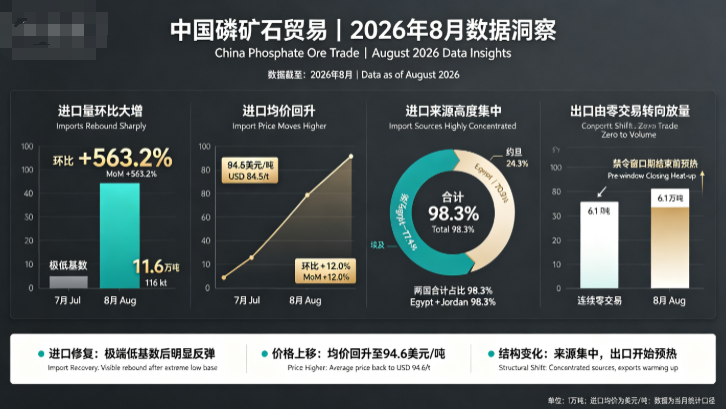
Key points: In August, China’s phosphate ore imports surged month-on-month (MoM), and the price center shifted upward. Total imports for the month were 116,000 mt, up 563.2% MoM, largely recovering from the extremely low base in July caused by the export ban. The average import price rebounded to US$94.6/mt, up 12.0% MoM. Egypt and Jordan together accounted for 98.3%, further intensifying source concentration. Meanwhile, after consecutive zero transactions, exports suddenly rose to 61,000 mt in August, marking a market warm-up before the end of the phosphate fertilizer export ban window.
I. Import volume: surge MoM, but absolute volume still low
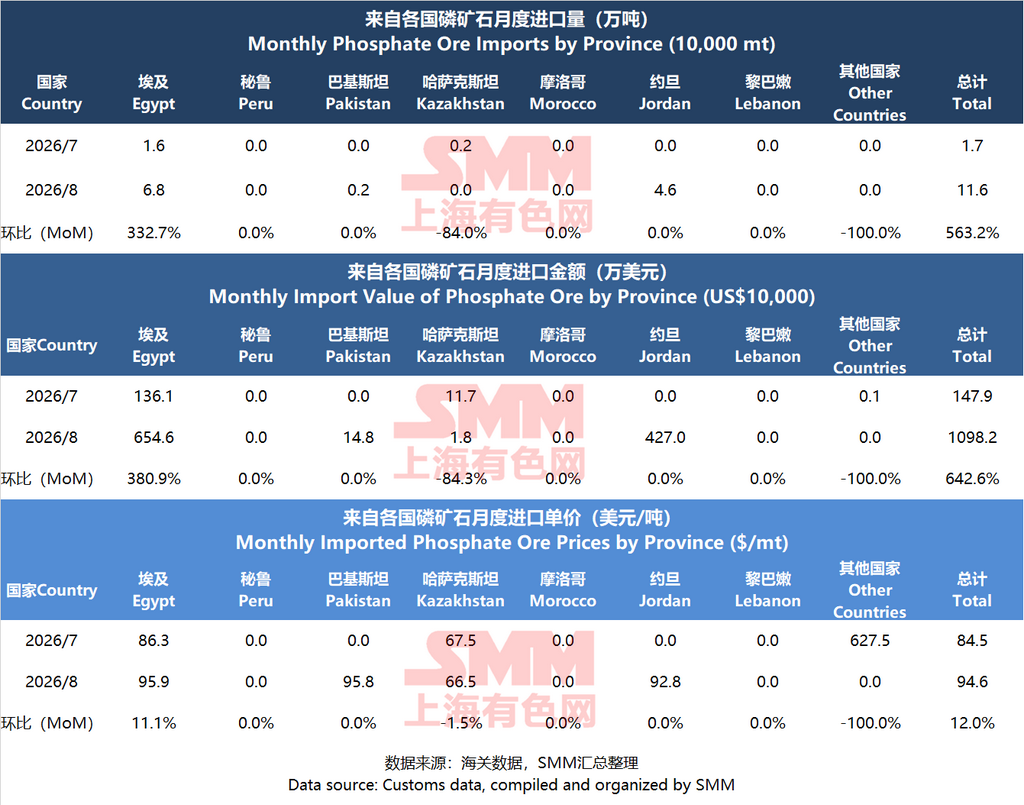
August imports totaled 116,000 mt, up 563.2% from 17,000 mt in July. Total import value soared from US$1.479 million to US$10.982 million, up 642.6% MoM.
Structural divergence was obvious:
Guangxi: imports fell from 14,000 mt to 10,000 mt (-33.2% MoM); value dropped from US$1.232 million to US$845,000 (-31.4%). It was the only major importing province to decline MoM.
Hubei: imports jumped from zero to 46,000 mt (value: US$4.27 million), becoming the largest source of increment.
Other provinces (including Jiangsu, Guizhou, Tianjin, etc.): imports surged from 3,000 mt to 59,000 mt (+1802.1% MoM); value soared from US$245,000 to US$5.719 million (+2234.1%). Based on earlier detailed data, Jiangsu received large volumes of Egyptian ground phosphate ore, the core driver behind the surge in “other” provinces.
II. Import price: rebound to US$94.6/mt, buyer bargaining sentiment weakened
The overall average import price in August was US$94.6/mt, up 12.0% MoM. In July, demand suddenly cooled, buyers pressed prices hard, and the average price was only US$84.5/mt.
By region:
Other provinces (including Jiangsu): highest average price, at US$97.1/mt (+22.7% MoM), mainly corresponding to high-grade Egyptian ground ore.
Hubei: US$92.8/mt, mainly corresponding to Jordanian unground ore.
Guangxi: US$87.8/mt (+2.7% MoM), mainly corresponding to low-grade Egyptian unground ore, the lowest price nationwide.
Shandong: the July unit price of US$1,687.1/mt was an abnormal value from an extremely small base (only 200 mt imported in July, value US$2,000); August returned to normal, at US$95.8/mt.
III. Source country pattern: Egypt-Jordan “duopoly,” concentration at 98.3%
August import sources were extremely concentrated, with both risks and opportunities:
Egypt: imports of 68,000 mt (+332.7% MoM), accounting for about 59%; import value US$6.546 million, average price US$95.9/mt (+11.1% MoM).
Jordan: imports of 46,000 mt (zero in July), accounting for about 40%; value US$4.27 million, average price US$92.8/mt.
Pakistan: marginal supplement of 2,000 mt, average price US$95.8/mt.
Kazakhstan: fell from 2,000 mt in July to zero; the average price of US$67.5/mt (low-grade tailings) was discontinued.
Peru, Morocco, Lebanon: all had zero imports in August.
Note: Egypt and Jordan together accounted for 98.3%, making the risk of source-country concentration extremely prominent. Previously, Egypt’s suspension of new export contracts in May caused Jordanian imports to surge in June. Jordanian supply recovered in August, but Egypt’s supply outlook for 2027 remains uncertain.
IV. Export side: “ice-breaking” volume of 61,000 mt, policy window effect emerges
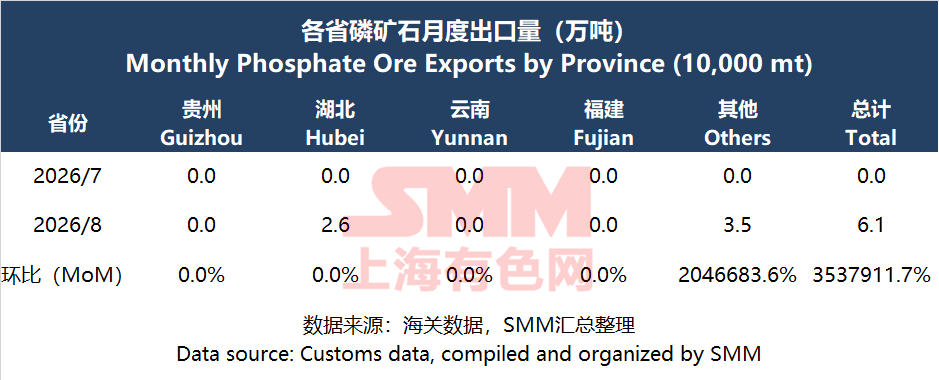
This was the most noteworthy change in the August data. July exports totaled zero, while August exports suddenly rose to 61,000 mt.
Hubei: exported 26,000 mt.
Other provinces: exported 35,000 mt (although Guizhou, Yunnan, Fujian and other provinces showed zero in the table, the “other” item covers unlisted exporting provinces).
Policy background: From March 14 to August 31, 2026, phosphate fertilizer exports were suspended. August was the last month of the ban. Exports jumping from zero to 61,000 mt may reflect advance stocking, contract warm-up before the resumption of normalized exports on September 1, or export pull from non-fertilizer phosphate chemical products such as yellow phosphorus and fine phosphate salts.
V. August core logic and outlook
August market logic summary:
Import side: a corrective rebound after the extremely low July base. Hubei (Jordanian ore) and Jiangsu (Egyptian ground ore) were the two core receiving locations. The 12% rebound in average price shows that downstream rigid demand for high-grade ore still exists, and room for buyers to press prices narrowed.
Export side: at the end of the policy ban, the export channel began to loosen. Although 61,000 mt is not large, it marks a shift in market sentiment from “full stagnation” to “tentative recovery.”
September and Q4 outlook:
Imports: after phosphate fertilizer exports resume in September, downstream operating rates are expected to pick up. However, the current period is an off-season with no spring ploughing and no winter storage. September imports are expected to be basically flat or fluctuate slightly from August, with the average price oscillating in the US$90–95/mt range.
Exports: after normalized phosphate fertilizer exports resume in September, export volumes are expected to expand further. Major phosphate chemical provinces such as Hubei and Guizhou will receive the main export orders.
Core variable: the direction of Egypt’s phosphate ore export policy in 2027. If Egypt tightens further, China will be forced to rely more on Jordan or seek new supply channels such as Morocco. Source diversification will become a long-term strategic task for ensuring phosphate resource security.
VI. Summary: Is the demand peak season arriving?
In August, phosphate ore imports were 116,000 mt, up 563.2% MoM; exports jumped from zero to 61,000 mt; the average price rebounded to US$94.6/mt. The data looks bright, but the main reasons are the repair from the extremely low base under the July export ban and advance stocking before the resumption of phosphate fertilizer exports in September. Autumn fertilizer stocking is gradually starting, and rigid demand has support, but import sources are highly concentrated in Egypt and Jordan, and absolute volumes remain low. Whether the peak season is truly arriving still depends on whether September export orders and downstream operating rates can continue to recover. A short-term rebound is likely; a trend-level peak season still needs verification.
Outlook: Imports are unlikely to recover in the short term, as low downstream operating rates continue to suppress procurement. For exports, attention should be paid to August policies on calcium superphosphate and triple superphosphate, as well as the start of winter storage demand. In the first half of the year, cumulative imports reached 998,200 tonnes, keeping the annual total at a high level; exports surged 226% in H1, but H2 recovery depends on domestic supply‑demand balance and policy direction.
Note: If you have any further details to add regarding the points mentioned in this article, or if you have any questions on the phosphorus chemical industry (phosphate ore, phosphoric acid, iron phosphate, lithium iron phosphate, etc.) and solid-state batteries, please feel free to contact:
Tel: 021-20707860 (or add WeChat: 13585549799) – Yang Chaoxing. Thank you!