Spot Premiums: Divergence among Three Regions, with South China Leading in Spread Recovery
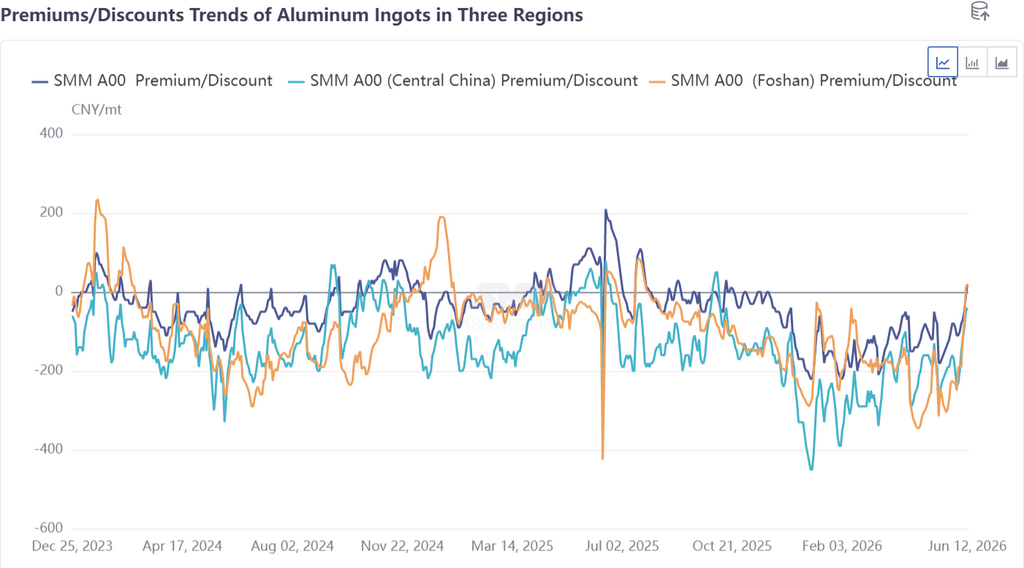
From the aluminum ingot spot premium chart across the three regions, it is clear that since 2026, the national aluminum ingot spot-futures spread has remained in a relatively weak range over the past two years. Discounts across all three regions widened to varying degrees from the start of the year through May, directly linked to the persistent suppression of spot circulation by high inventories earlier. Entering June, as the destocking inflection point gradually took hold, spot premiums in the three regions began a diverging recovery.
1. South China Market (Foshan): Dominated by a Pattern of Holding Prices Firm and Holding Back from Selling, with the Most Pronounced Spread Strengthening
The South China market acted as the front-runner in this round of spot premium recovery. Driven by a combination of supply-side disruptions in south-west China, continuously accelerating destocking, and large-scale suppliers firmly holding prices, the South China aluminum ingot spot premium shifted from a discount of over 300 yuan/mt against the front-month contract in mid-May to a sharp narrowing and first-time shift to a premium of +10 yuan/mt against the 2606 contract by June 11—a spread recovery of more than 300 yuan/mt, the strongest performance among the three regions.
Frequent high-price purchases for market-making by major suppliers were the key catalyst for the South China spread recovery this week. Looking at the internal supply-demand pattern logic of the South China market, the contraction in effective circulating volume (switch to cast bar production + suppliers holding back from selling), combined with localized restocking demand after the price pullback, was the core driver behind the stronger-than-expected spread strengthening.
2. Guangdong-Shanghai Price Spread: From Widening to Zero as South China's Spread Recovery "Caught Up" with East China
The evolution of the Guangdong-Shanghai price spread was the most noteworthy phenomenon in this round of spread recovery. As evident from the three-region spot premium chart, in mid-May the South China discount was still deeper than that in East China, placing the Guangdong-Shanghai spread in a South China discount zone. However, after that, the South China spread accelerated its recovery, discounts rapidly narrowed and turned to premiums, while East China’s spot premium recovery pace was relatively moderate; the Guangdong-Shanghai spread gradually narrowed and has now essentially returned to zero.
This means that in just three weeks, South China spot prices completed a regional price spread repair against East China—the South China spread moved from a deep discount to parity with East China, reflecting that the marginal pricing impact of tightened South China circulation has been pushed to an extreme. After the spread returned to zero, cross-regional arbitrage incentives vanished, and the logic of East China’s "premium" over South China came to an end.
Spot-Futures Price Spread Outlook: Can South China’s Strong Performance Last? How Will the Guangdong-Shanghai Price Spread Evolve?
South China spot premiums have support in the short term, but their sustainability will depend on the extent of circulation tightening. The core drivers of the current strength in South China’s spot-futures spread are the triple resonance of “supply contraction + market making by major players + invoice control.” Market making by major players is a short-term catalyst, the impact of invoice control diminishes as policies ease, and the only sustainable support comes from circulation tightening driven by inventory destocking. If arrivals subsequently rebound or major players exit, the premiums landscape could face pullback pressure.
After the Guangdong-Shanghai price spread returned to zero, there is limited room for it to turn further positive, and it may fluctuate near zero in the short term. South China’s spot-futures spread recovery has already “caught up” with east China. Going forward, the momentum for South China to continue its independent recovery and strength will depend on whether the tight circulation pattern can be sustained. Given that the inter-regional goods-moving arbitrage window closed after the spread returned to zero, slower incremental supply growth in east China has instead provided some support for premiums there. However, delivery pressure persists in east China, while the likelihood of arrival recovery in South China is also increasing. Under these opposing forces, the Guangdong-Shanghai price spread is likely to move sideways near zero, making a recurrence of the one-sided narrowing seen in May–June difficult.
A downward shift in the SMM A00 discount midpoint is a medium-term trend, but the pace will be gradual. In June, the proportion of liquid aluminum in China rebounded to 76.6%, export orders continued to improve, and supply-side standardization advanced—all supportive for spot-futures spreads from the supply side. However, the reality of weak domestic demand has not improved, and operating rates for aluminum semis are still declining during the off-season, capping the spread recovery from the demand side. On balance, the SMM A00 discount will gradually narrow amid fluctuations, but the period of turning to a premium within the year will be short.
Key indicators to watch:
① Whether purchases by major players in both regions, especially in South China, will persist;
② The fluctuation direction of the Guangdong-Shanghai price spread near zero and changes in arrivals;
③ The room for further rise in the liquid aluminum proportion and marginal changes in invoice control;
④ Whether a positive price spread between futures contracts can support hedgers in maintaining their willingness to hold prices firm.
![July Aluminum Alloy Imports Rebounded MoM, while Export Growth Momentum Weakened [SMM Analysis]](https://imgqn.smm.cn/usercenter/wStpx20251217171650.jpg)
![Alumina in China drifts lower, outside China continues to strengthen, and the price spread between Chinese and overseas markets widens [SMM Alumina Weekly Review]](https://imgqn.smm.cn/usercenter/kxYyQ20251217171651.jpg)
![High Inventory Suppresses Downstream Acceptance, Upstream Offers for Imported Bauxite Pull Back Slightly [SMM Weekly Review]](https://imgqn.smm.cn/usercenter/mZFrc20251217171654.jpg)