SMM: the word "unprecedented" has been used around the world to explain 2020. Whether it is the simultaneous triple bubbles in the stock, bond and real estate markets, or the quantitative easing implemented by central banks to combat public health events, 2020 is, to say the least, an unprecedented year so far.
The safety and stability of capital have been difficult to find because many volatility indicators, such as VIX, continue to point to future uncertainty. However, gold bucked the trend in 2020 because it continued its strong historical performance and performed well in preserving wealth.
In response, BMG GROUP said that through the calculation, we can find that physical gold is the best-performing asset in the past 20 years, with both low volatility and reliable preservation of value. With the increase of market uncertainty in 2020, it is wise for the market to add physical gold to the traditional investment portfolio.
At the same time, the lower the proportion of physical gold in the portfolio over the past 20 years, the smaller the return on the portfolio, the agency said. Generally speaking, the proportion of physical gold in the market portfolio is usually between 2% and 10%, so in the current market environment, investors can appropriately increase the proportion of physical gold investment.
The average annual return on gold denominated in each major currency over the past 20 years is 12.07%.
As of July 31, 2020, gold rose 29.02% in US dollar (USD) and 33.20% in Canadian dollar (CAD). These results should not surprise investors, as gold has risen by an average of 10.6 per cent (US dollars) and 9.8 per cent (Canadian dollars) since 2000.
With the market outlook uncertain, gold has a lot of room for upside, and its historically strong performance has been confirmed.
Surprisingly, gold does not have a larger allocation in the portfolios of most investors.
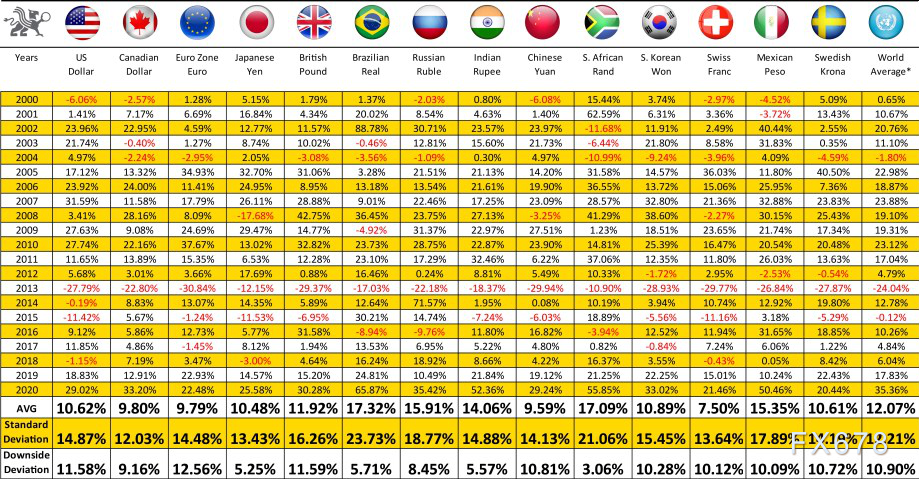
Figure 1
Figure 1 shows the outstanding performance of gold over the past 20 years, regardless of which currency is chosen. Among the major currencies, the average annual return over the entire period is 12.07%.
The world economy is responding to pandemic-related uncertainties in different ways. It is hard to determine which economy will recover first, driving the appreciation of its currency. However, it turns out that simply holding gold is a wise decision for personal wealth management, regardless of the direction of the currency.
As the US continues to implement quantitative easing and abuse the dollar as a reserve currency in the global economy, there is an excellent opportunity for gold to continue to appreciate.
Physical gold has both low volatility and reliable preservation of value.
It is relatively pointless to talk about gold's excellent performance over the past 20 years without comparing the performance of gold with that of other common assets. To better analyze the historical performance of gold, we can compare the risks and returns of different asset classes.
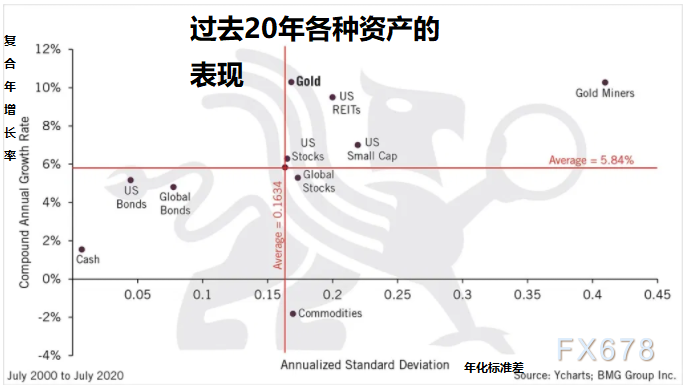
Figure 2
Figure 2 shows the volatility and returns of the major asset classes over the past 20 years. The income is calculated using the compound annual growth rate (CAGR), and the risk is calculated using the annualized standard deviation (based on monthly price changes over the entire period). The compound annual growth rate is the rate of return on the assumption that profits are reinvested at the end of each year during the investment period.
Of all the asset classes observed, the average CAGR was 5.84%, while the average standard deviation was 0.1634. As the chart shows, gold outperformed the average because it grew at a compound annual rate of 10.3% over the observation period. None of the asset classes under observation received higher returns over the entire period of time. The only asset classes that offer similar returns are gold miners (10.3 per cent) and US real estate investment trusts (9.5 per cent).
However, both options pose a greater risk because of the higher standard deviation. Gold's standard deviation of 0.1682 is only slightly higher than the average of 0.1634, while gold miners show a standard deviation of 0.4096 over the same time range. Taking into account both risks and returns suggests that gold has been the best asset class to enhance wealth preservation over the past 20 years. However, not all methods of holding gold can provide the same results. Physical gold bars provide investors with the best combination of risks and returns.
Over the years, however, one of the main misunderstandings investors have encountered when adding physical gold to their portfolios is that they say they already have a designated allocation of gold, but most of these investments are invested in commodities or gold miners.
As figure 3 shows, over the past 20 years, ignoring physical gold and using other methods has been harmful to investors. Compared with the Media Commodity Index (BCOM) and the New York Stock Exchange ARCA Gold BUGS Index (HUI), physical gold is the best way to hold gold.
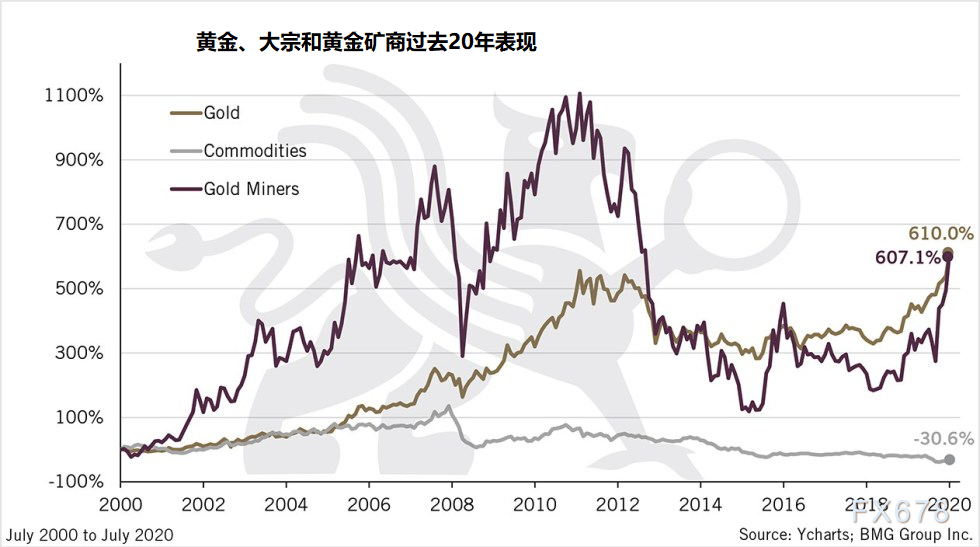
Figure 3
BCOM is the most widely used benchmark in commodity markets, tracking about $85 billion in assets. Gold is the heaviest component in the index, at 12.24 per cent. The negative return on the index is minus 30.6 per cent, making it clear that holding commodities in a portfolio should not be considered equivalent to physical gold.
In contrast, the HUI index is made up of 15 of the largest and most recognised listed gold producers. Despite the huge rise in the index between 2000 and 2010, the danger of high levels of volatility has also emerged because prices have not yet recovered from the sharp fall in 2012.
Over a 20-year period, using the standard deviation of monthly price changes shows that physical gold bars provide investors with higher returns and lower risk, thus providing greater security for investors seeking to preserve their wealth. The standard deviation of physical gold bar is 0.1670, while that of HUI index is 0.4094.
Clearly, holding commodities or gold miners in a portfolio should not be considered the same as buying physical gold bars. Physical gold bars are clearly a strong reason for investors to add them to their portfolios, not only to diversify, but also to achieve a strong historic return of 610 per cent over the past 20 years.
The lower the gold ratio in the portfolio, the lower the overall return of the whole portfolio.
Traditionally, gold advocates and investors tend to assess the performance of their portfolios by adding gold to their portfolios, usually focusing on allocating between 2% and 10% to create a truly balanced portfolio.
But what if the performance of various portfolios is measured at 100%? The first eight columns in figure 4 show the configuration size of each portfolio, while the last two columns show CAGR and standard deviation. After the specified gold allocation, each asset is given an equal weight according to the available capital balance. Cash has never been allocated more than 2 per cent and does not have the same weight as other asset classes.
As shown in figure 4, a 100% allocation of gold (portfolio 1) will provide a maximum CAGR of 10.3%. Each reduction in gold allocation results in a decrease in the compound annual growth rate of each portfolio throughout the observable period. By contrast, portfolios 6 and 7 represent the traditional 60-pound-40 portfolio, which consists of 60% of stocks and 40% of bonds.
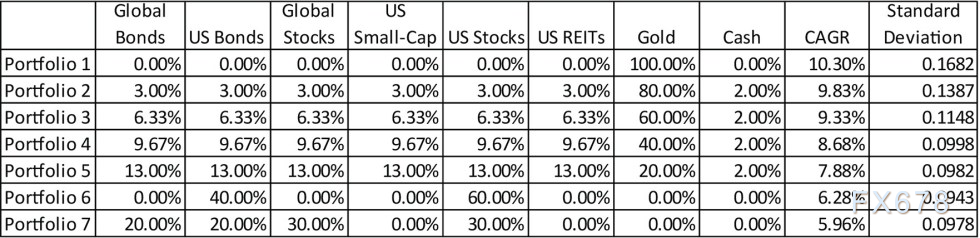
Figure 4
So holding 100% of gold within 20 years, rather than investing in the traditional 60Universe 40 portfolio, would be the most advantageous decision to protect wealth.
Figure 5 shows the performance of seven portfolios assuming an initial investment of $100000. By the end of the period, portfolio 1 will turn an investment of $100000 into $709991.
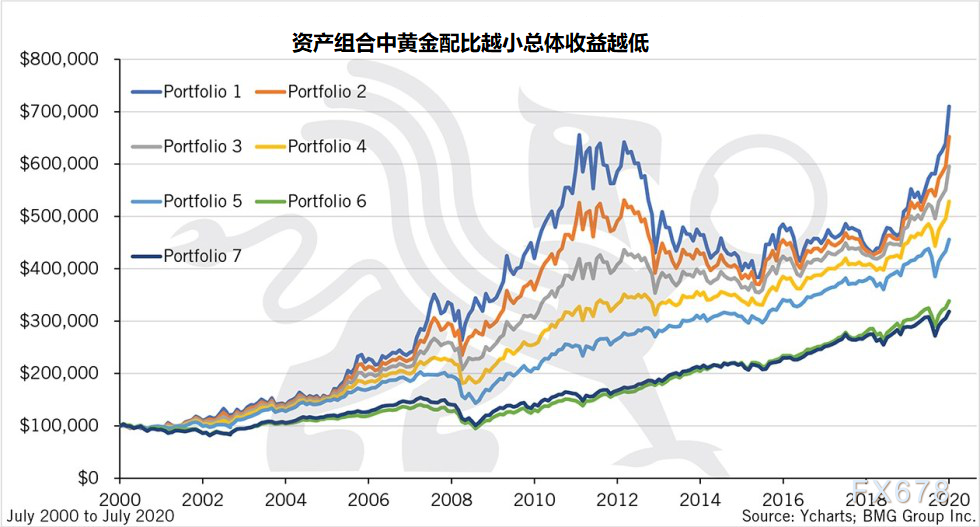
Figure 5
In contrast, portfolio 6 with a typical 60 amp 40 component has a return of $338308 over the same period, a difference of $371683, or an annual difference of more than $18500. Holding 100% of physical gold bars over a period of time shows the best hedge return, as the currency difference between portfolios is more than twice as large.
In short, it is clear that holding gold should be a priority for investors, given the looming uncertainty in the economy and the historical performance of gold over the past two decades. For investors, continuing to ignore the risk that adding physical gold bars to their portfolios could mean shrinking assets in turbulent times.

Scan the QR code and apply to join the SMM Metal Industry Exchange Group