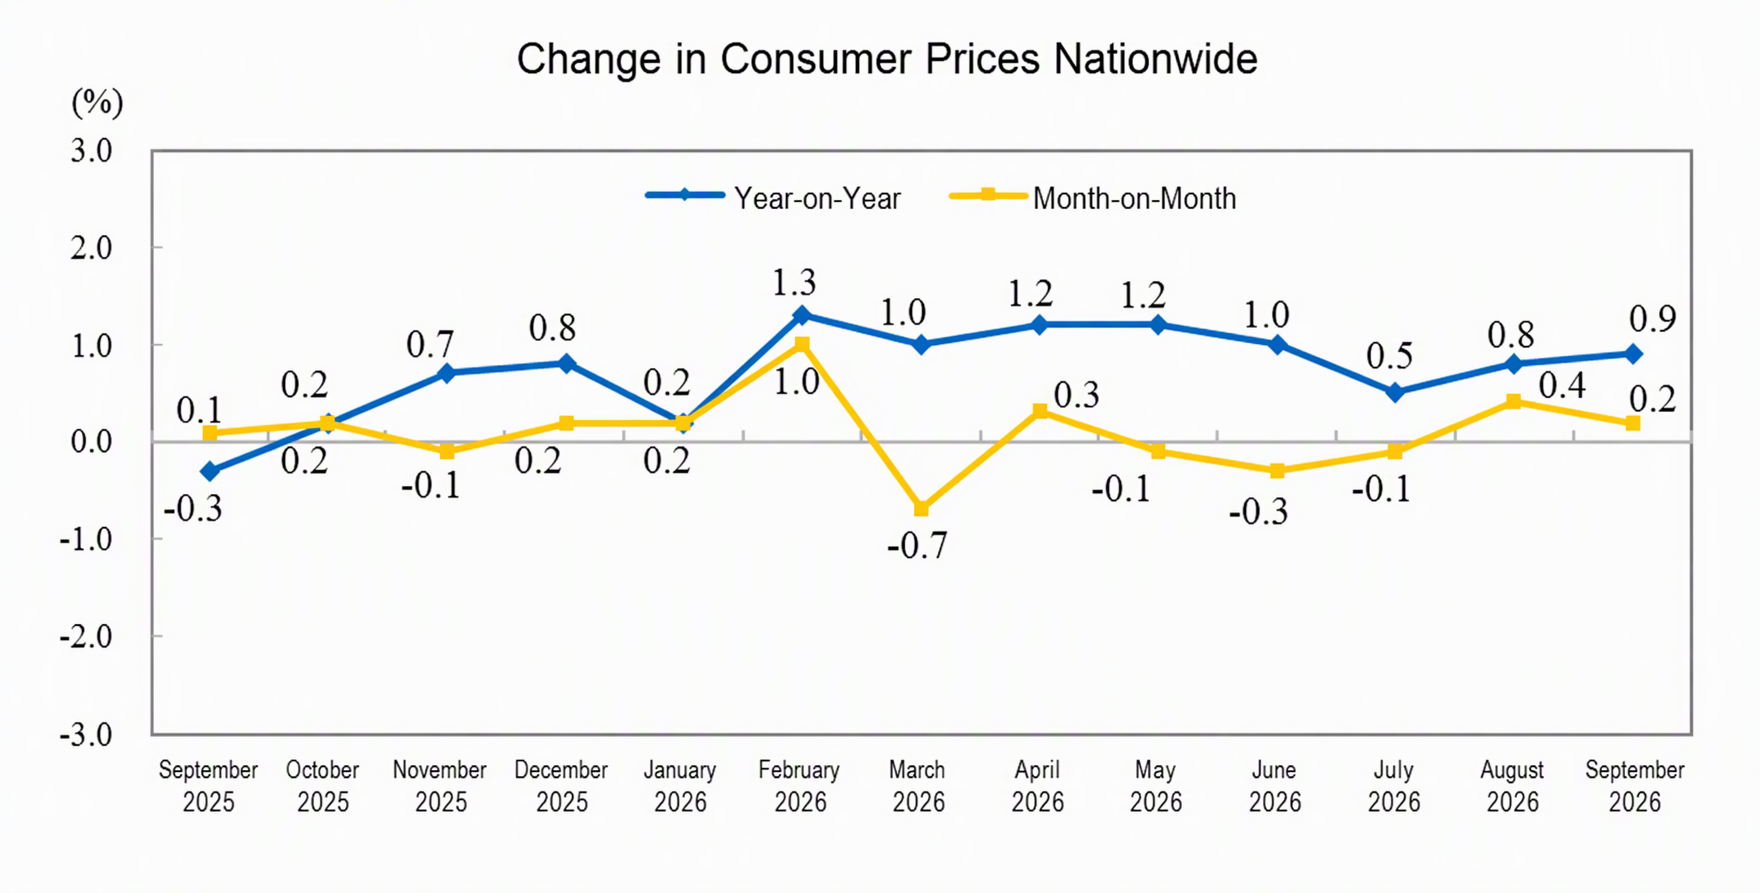
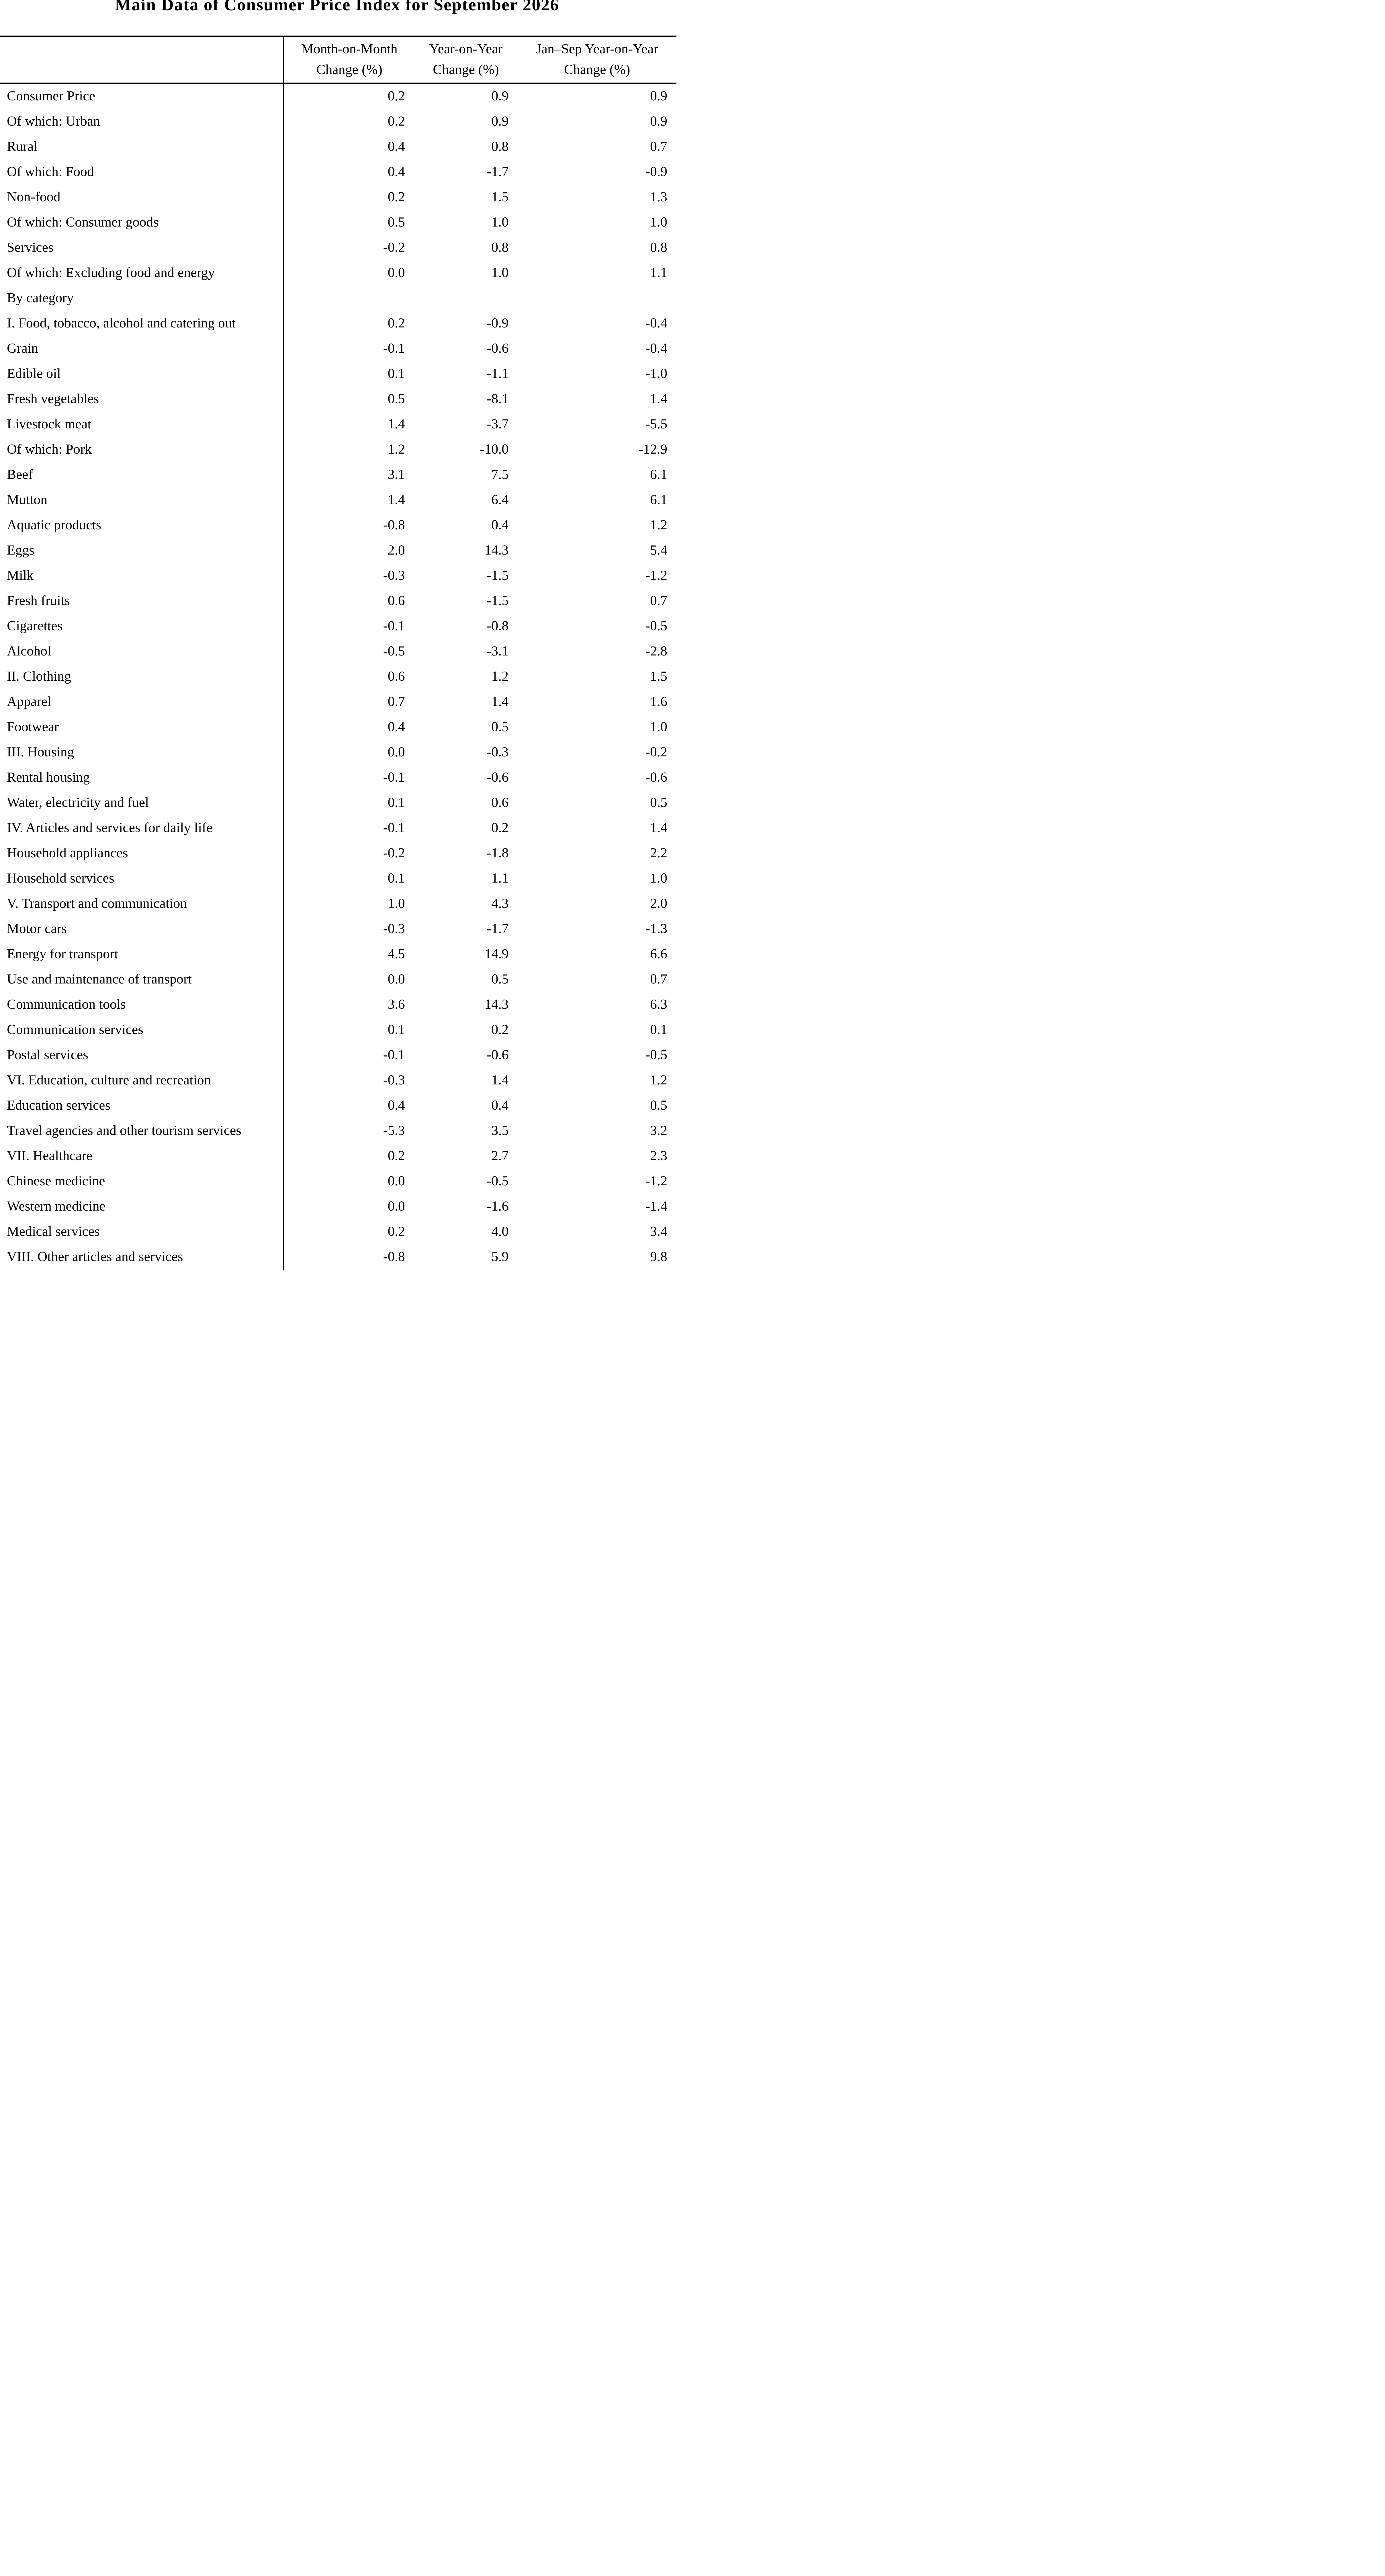
Data from the National Bureau of Statistics (NBS) show that in September 2026, China's consumer price index (CPI) rose 0.9% YoY. Urban CPI rose 0.9% and rural CPI rose 0.8%; food prices fell 1.7% while non-food prices rose 1.5%; consumer goods prices rose 1.0% and services prices rose 0.8%. For the January-September average, China's CPI rose 0.9% YoY. In September 2026, China's producer price index (PPI) rose 5.0% YoY and 1.2% MoM. The purchasing price index for industrial producers rose 6.9% YoY and 1.2% MoM. For the January-September average, the PPI rose 2.3% YoY and the purchasing price index for industrial producers rose 3.6% YoY. Dong Lijuan, chief statistician of the NBS Urban Department, interpreted the August 2026 CPI and PPI data. On a MoM basis, China's PPI rose 1.2%, with the increase widening by 0.8 percentage points from the previous month. The main features of this month's MoM PPI movement were as follows: First, rising international crude oil and non-ferrous metals prices drove up prices in related domestic industries. Prices in petroleum extraction, refined petroleum product manufacturing, and organic chemical raw material manufacturing rose 14.5%, 7.4%, and 5.4%, respectively; prices in non-ferrous metals ore mining and dressing and non-ferrous metals smelting and rolling processing rose 1.6% and 1.5%, respectively. These five industries together contributed approximately 0.63 percentage points to the MoM PPI increase. Second, changes in supply-demand conditions in some energy and raw material industries boosted prices. Affected by factors such as increased coal demand for winter heating reserves, temporarily tight supply in major mining areas, and expectations of rising international coal prices, prices in coal mining and washing and coal processing rose 9.5% and 13.6%, respectively. Demand for building materials such as steel and cement rebounded somewhat, and coupled with rising raw material costs, prices in the non-metallic mineral products industry turned to a 0.3% increase after seven consecutive months of decline, while prices in ferrous metals smelting and rolling processing rose 0.2%. These four industries together contributed approximately 0.38 percentage points to the MoM PPI increase. Third, accelerated development in areas such as artificial intelligence and computing-power-electricity coordination drove up demand and prices in some industries. Prices in the electrical machinery and equipment manufacturing industry and the computer, communications, and other electronic equipment manufacturing industry both rose 0.4%, with the two industries together contributing approximately 0.07 percentage points to the MoM PPI increase.
China's CPI rose 0.9% YoY in September 2026
In September 2026, China's CPI rose 0.9% YoY. Urban CPI rose 0.9% and rural CPI rose 0.8%; food prices fell 1.7% while non-food prices rose 1.5%; consumer goods prices rose 1.0% and services prices rose 0.8%. From January to September, the national consumer price index (CPI) rose 0.9% YoY on average.
In September, the national CPI rose 0.2% MoM. Specifically, urban CPI rose 0.2% and rural CPI rose 0.4%; food prices rose 0.4% and non-food prices rose 0.2%; consumer goods prices rose 0.5% and service prices fell 0.2%.
I. YoY Changes in Prices by Category
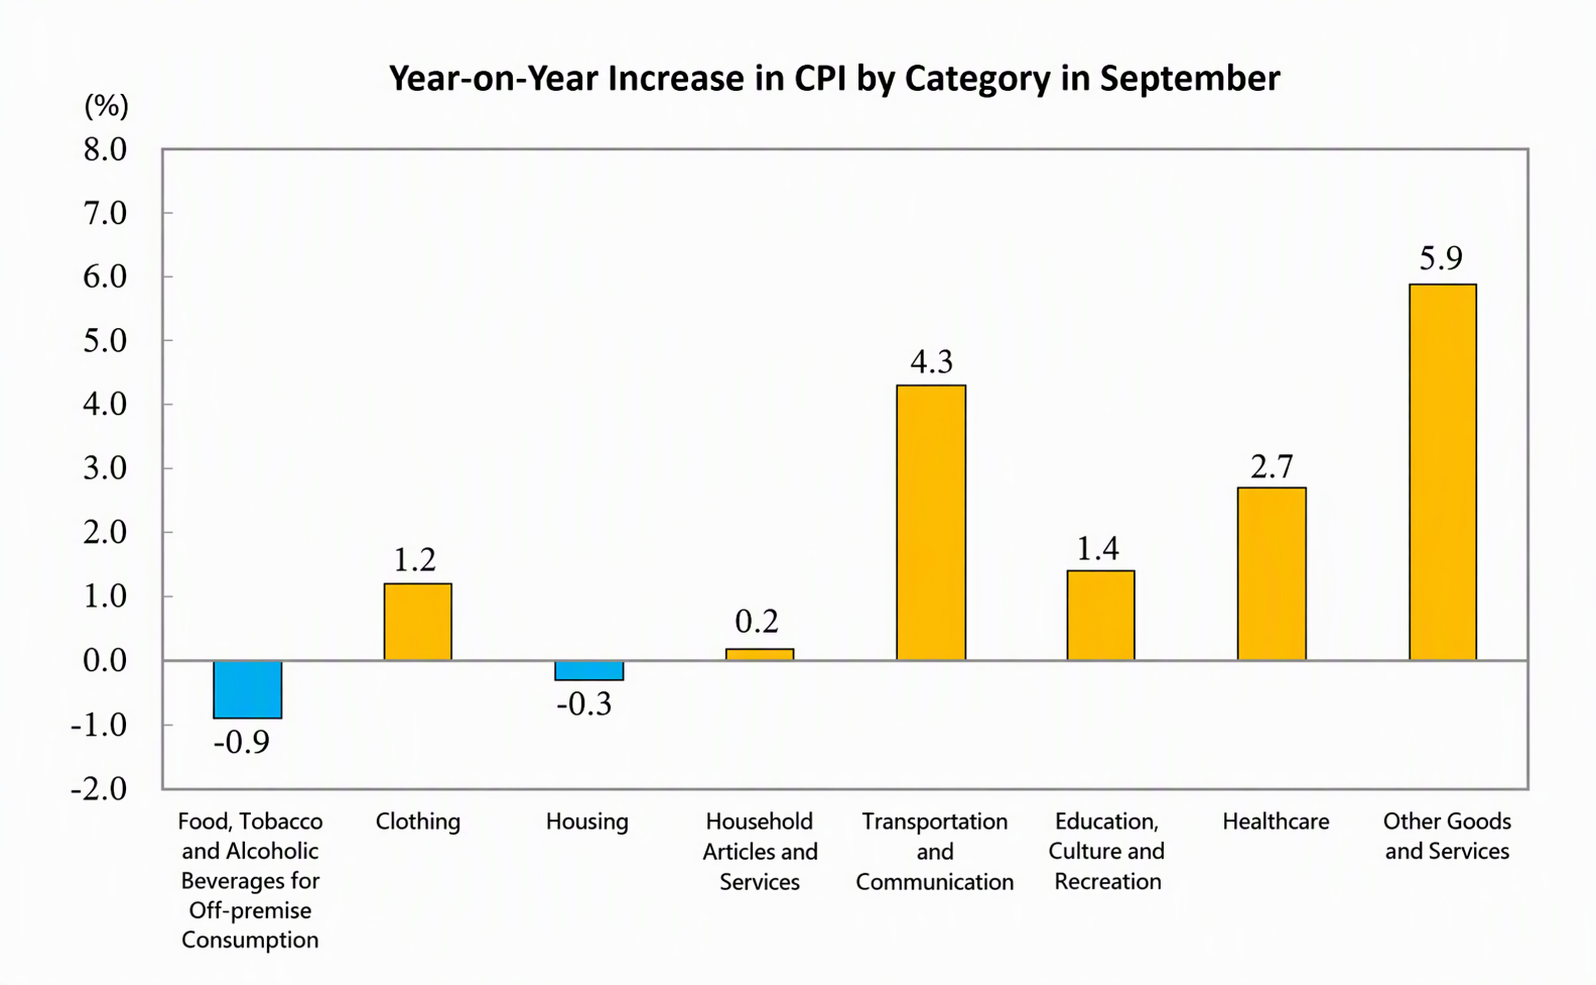
In September, prices for food, tobacco, alcohol, and dining out fell 0.9% YoY, contributing to a decline of about 0.26 percentage points in the CPI. Within food, fresh vegetable prices fell 8.1%, contributing to a decline of about 0.14 percentage points in the CPI; livestock and poultry meat prices fell 3.7%, contributing to a decline of about 0.15 percentage points in the CPI, with pork prices falling 10.0%; fresh fruit prices fell 1.5%, contributing to a decline of about 0.03 percentage points in the CPI; egg prices rose 14.3%, contributing to an increase of about 0.07 percentage points in the CPI.
Among the other seven categories, six rose and one fell YoY. Prices for other goods and services, transportation and communication, and healthcare rose 5.9%, 4.3%, and 2.7%, respectively; prices for education, culture, and entertainment, clothing, and household goods and services rose 1.4%, 1.2%, and 0.2%, respectively; housing prices fell 0.3%.
II. MoM Changes in Prices by Category
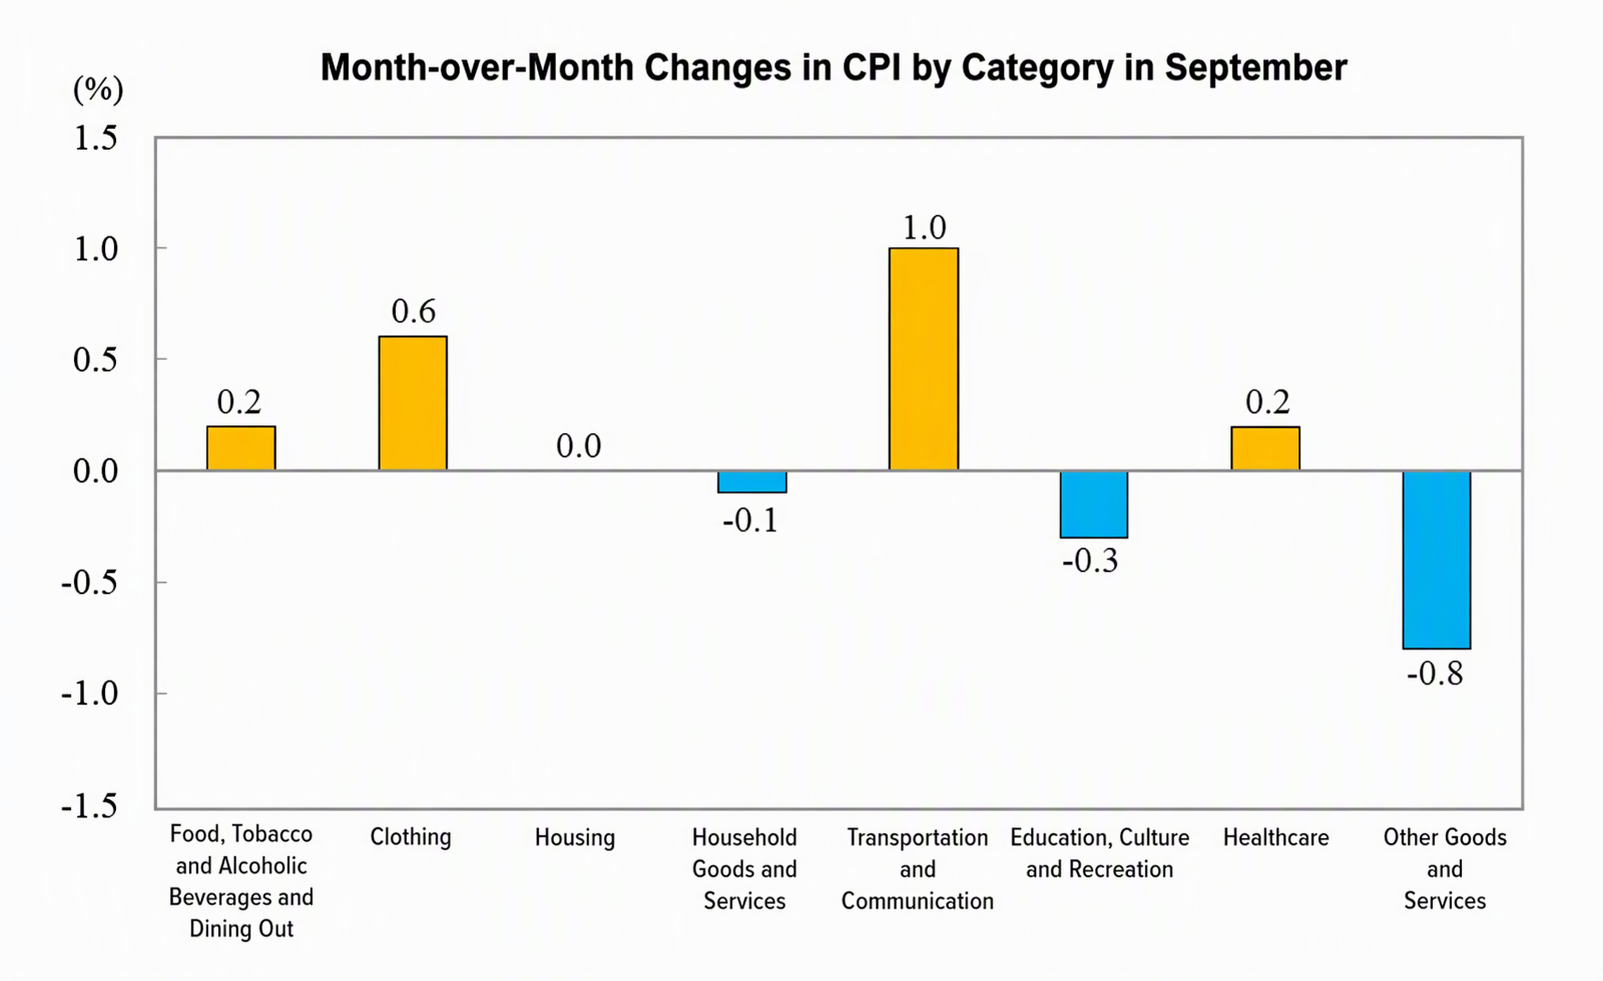
In September, prices for food, tobacco, alcohol, and dining out rose 0.2% MoM, contributing to an increase of about 0.06 percentage points in the CPI. Within food, egg prices rose 2.0%, contributing to an increase of about 0.01 percentage points in the CPI; livestock and poultry meat prices rose 1.4%, contributing to an increase of about 0.05 percentage points in the CPI, with pork prices rising 1.2%; fresh fruit prices rose 0.6%, contributing to an increase of about 0.01 percentage points in the CPI; fresh vegetable prices rose 0.5%, contributing to an increase of about 0.01 percentage points in the CPI; aquatic product prices fell 0.8%, contributing to a decline of about 0.02 percentage points in the CPI.
Among the other seven categories, three rose, one remained flat, and three fell MoM. Prices for transportation and communication, clothing, and healthcare rose 1.0%, 0.6%, and 0.2%, respectively; housing prices remained flat; prices for other goods and services, education, culture, and entertainment, and household goods and services fell 0.8%, 0.3%, and 0.1%, respectively.
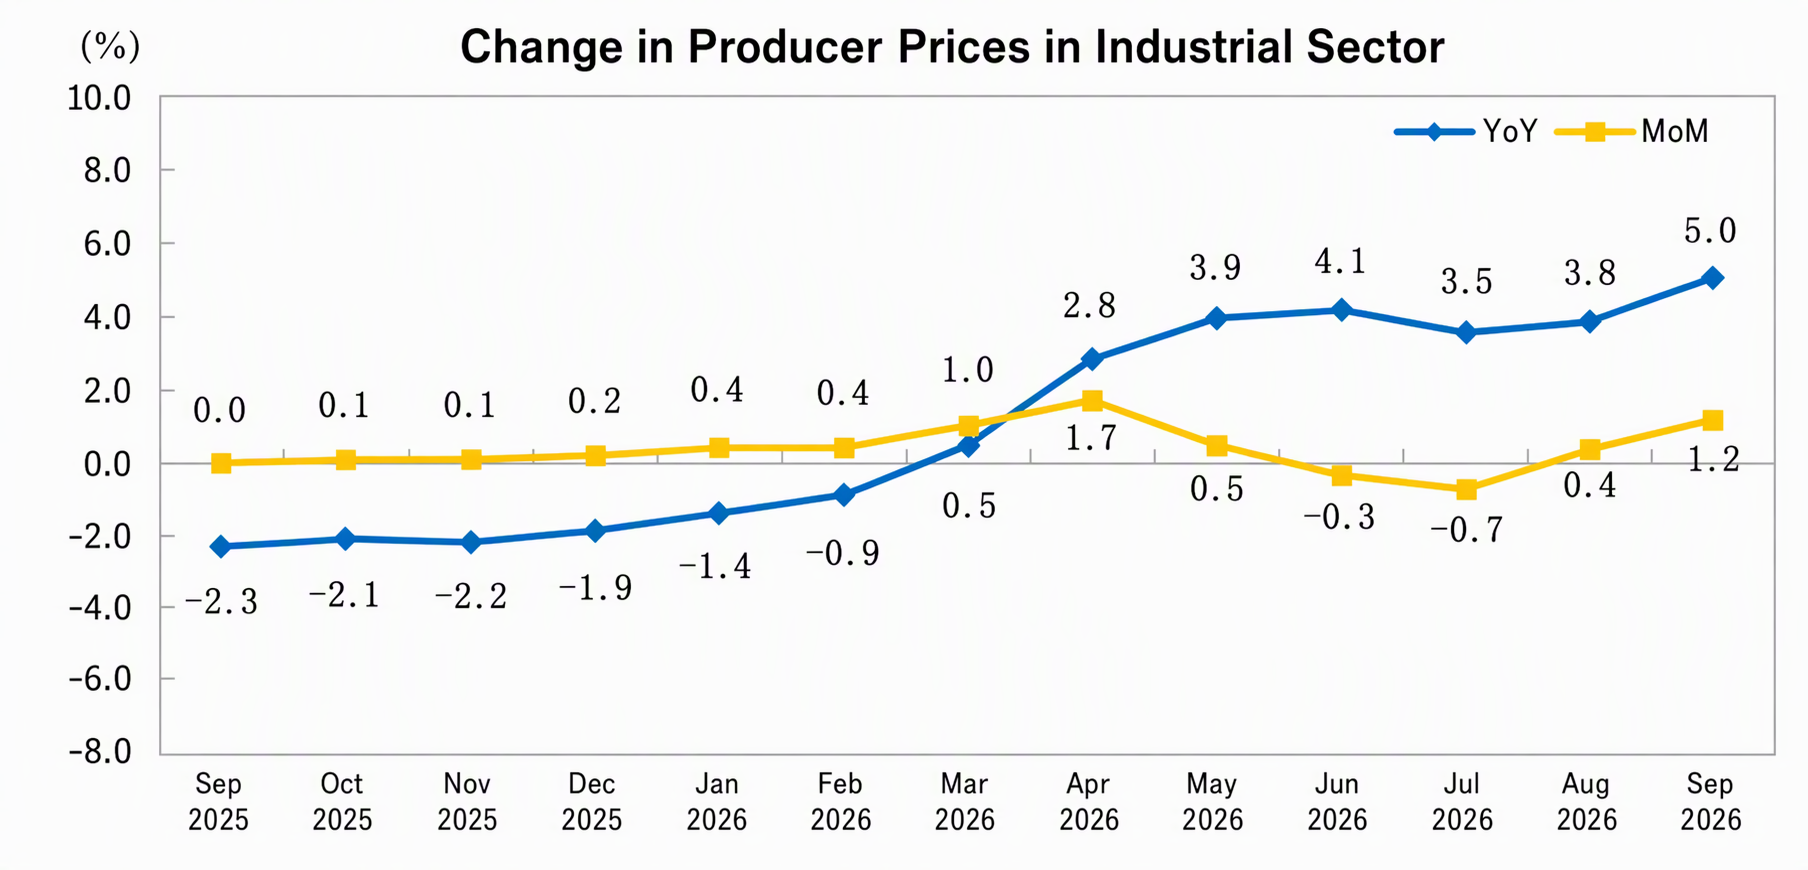
In September 2026, the national industrial producer ex-works price rose 5.0% YoY and 1.2% MoM
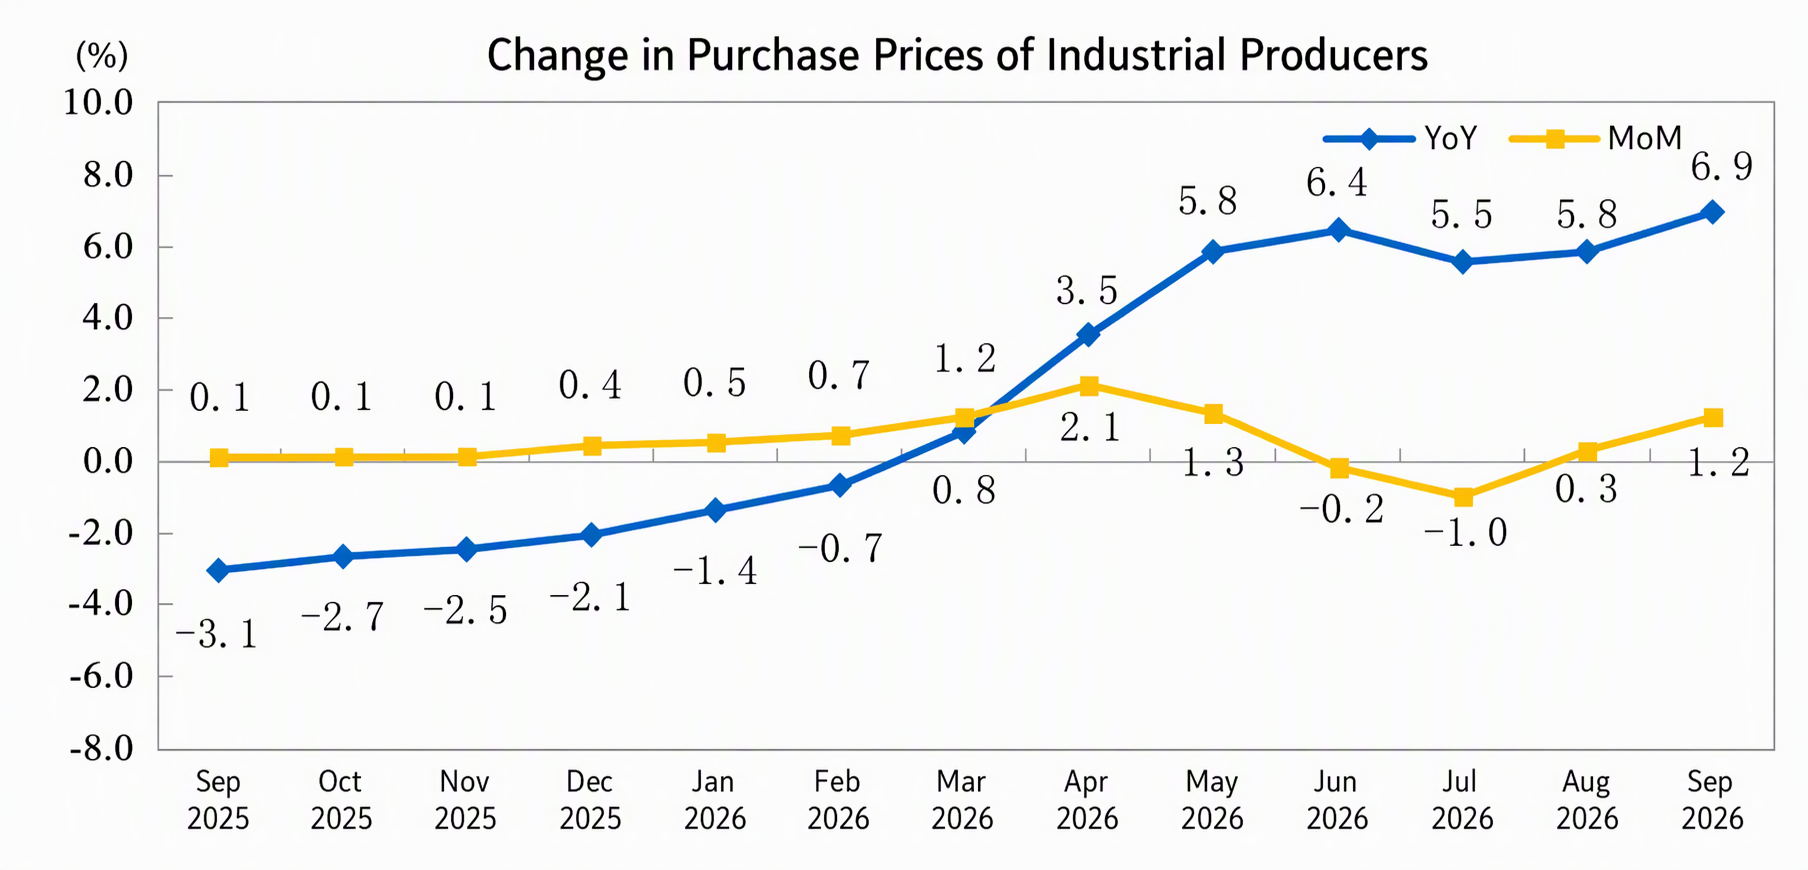
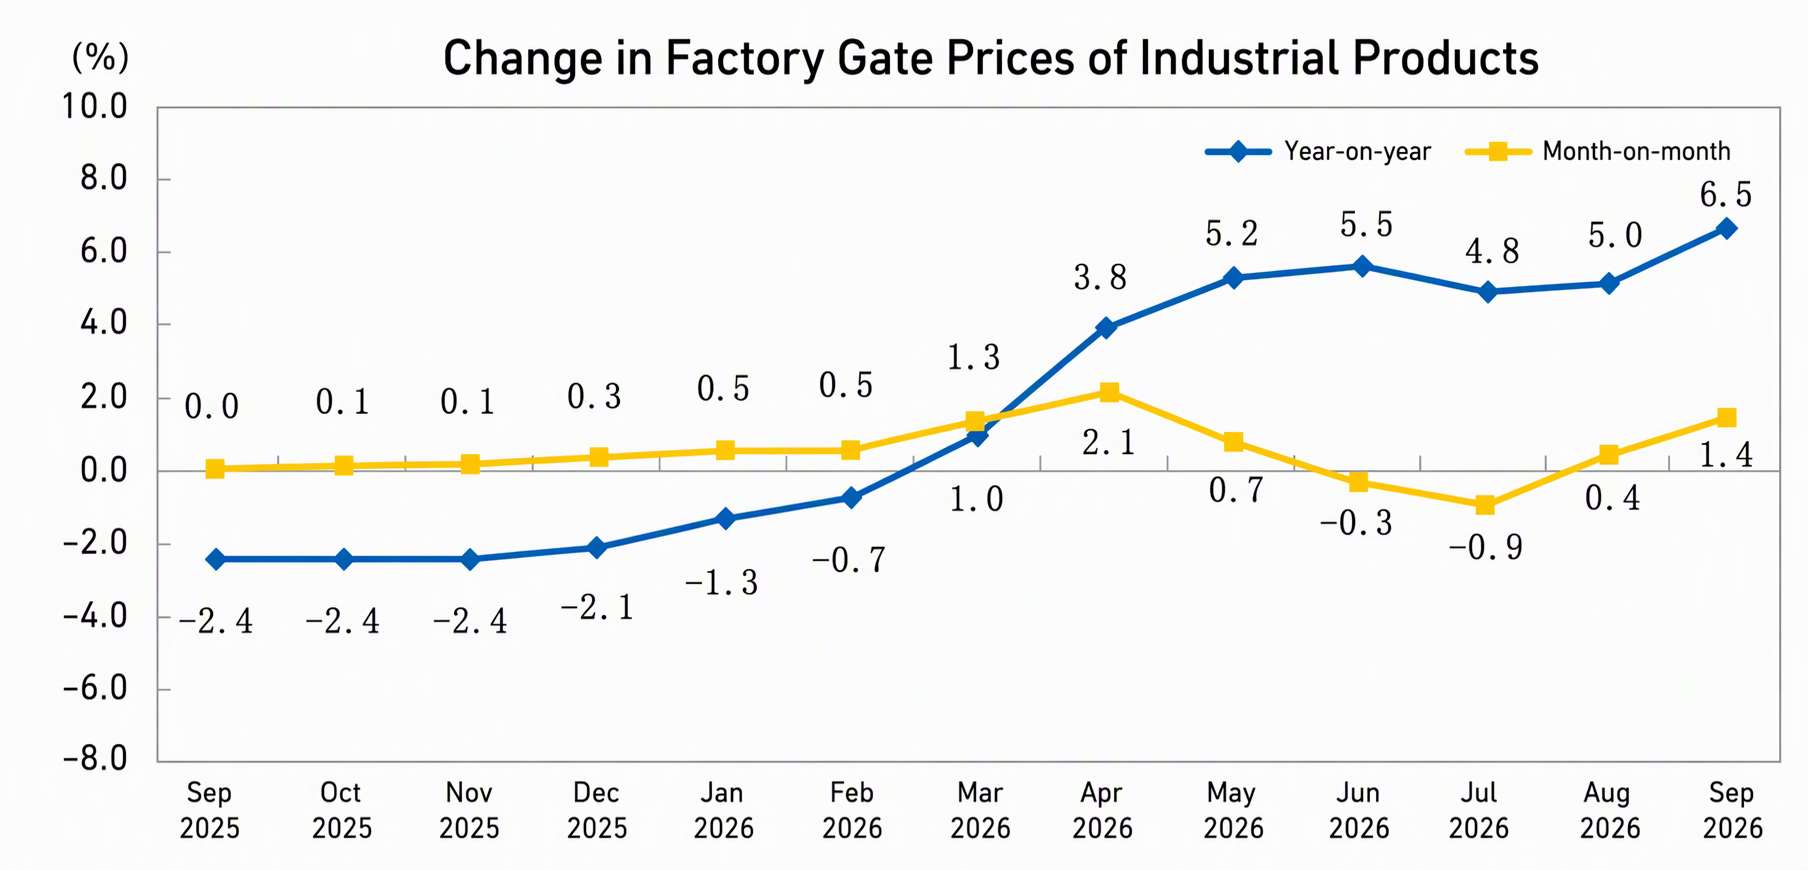
In September 2026, the national industrial producer ex-works price rose 5.0% YoY and 1.2% MoM. The purchase prices for industrial producers rose 6.9% YoY and 1.2% MoM. For the January–September average, the ex-works prices for industrial producers rose 2.3% from the same period last year, while the purchase prices for industrial producers rose 3.6%.
I. YoY Changes in Industrial Producer Prices
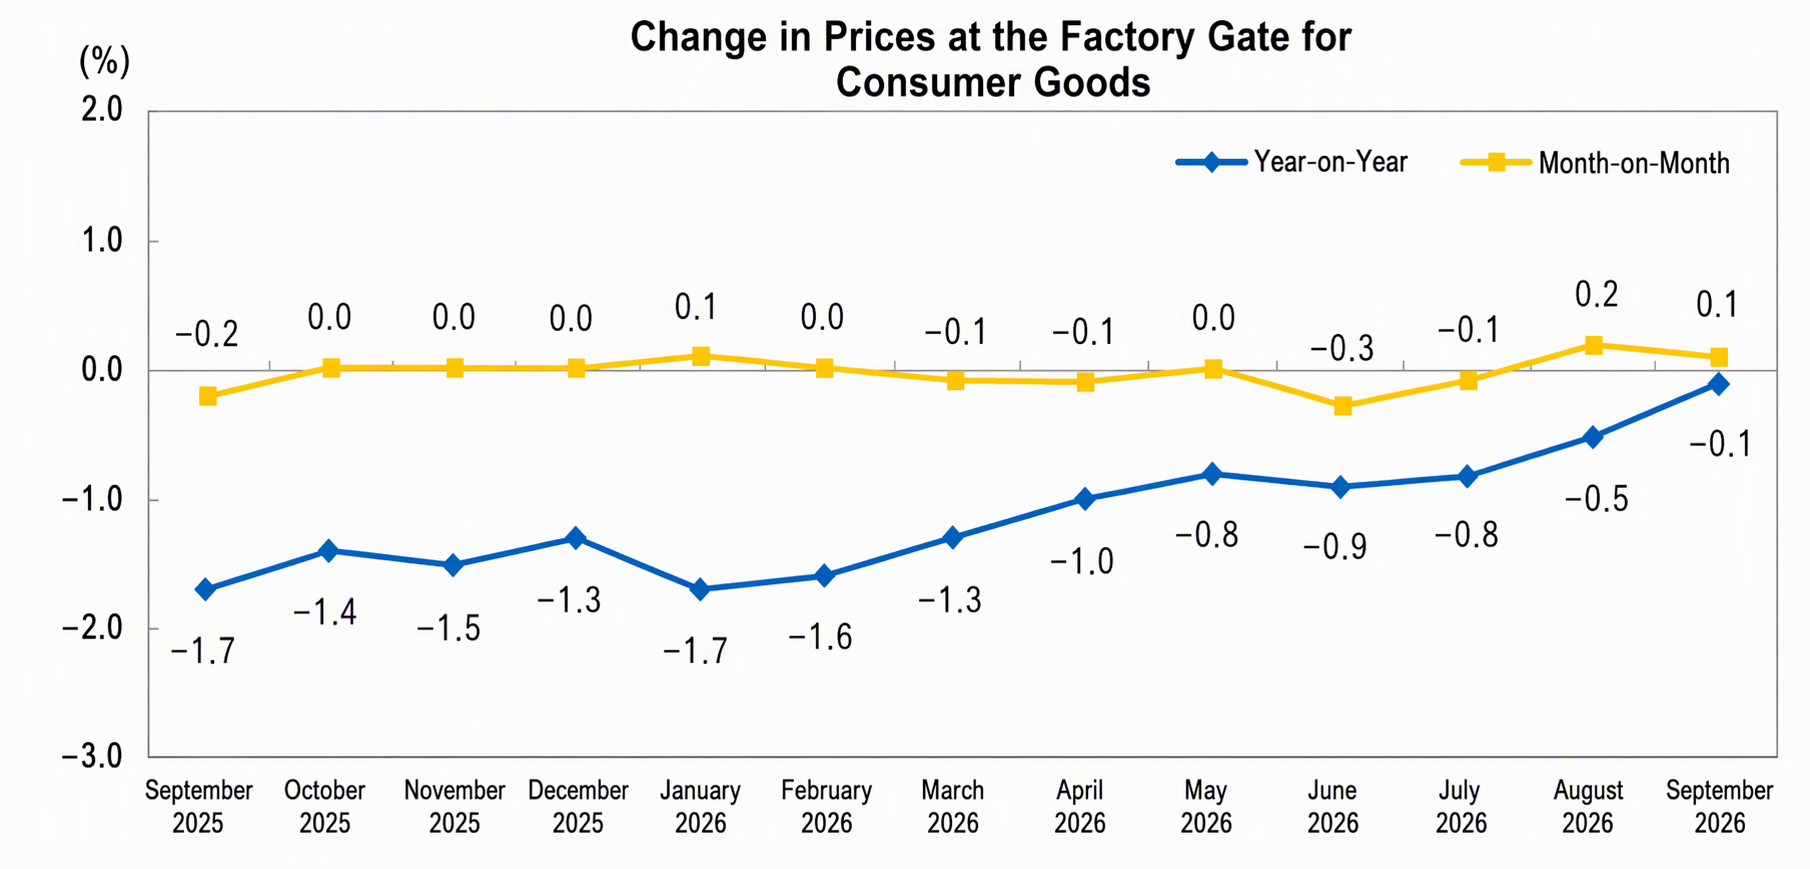
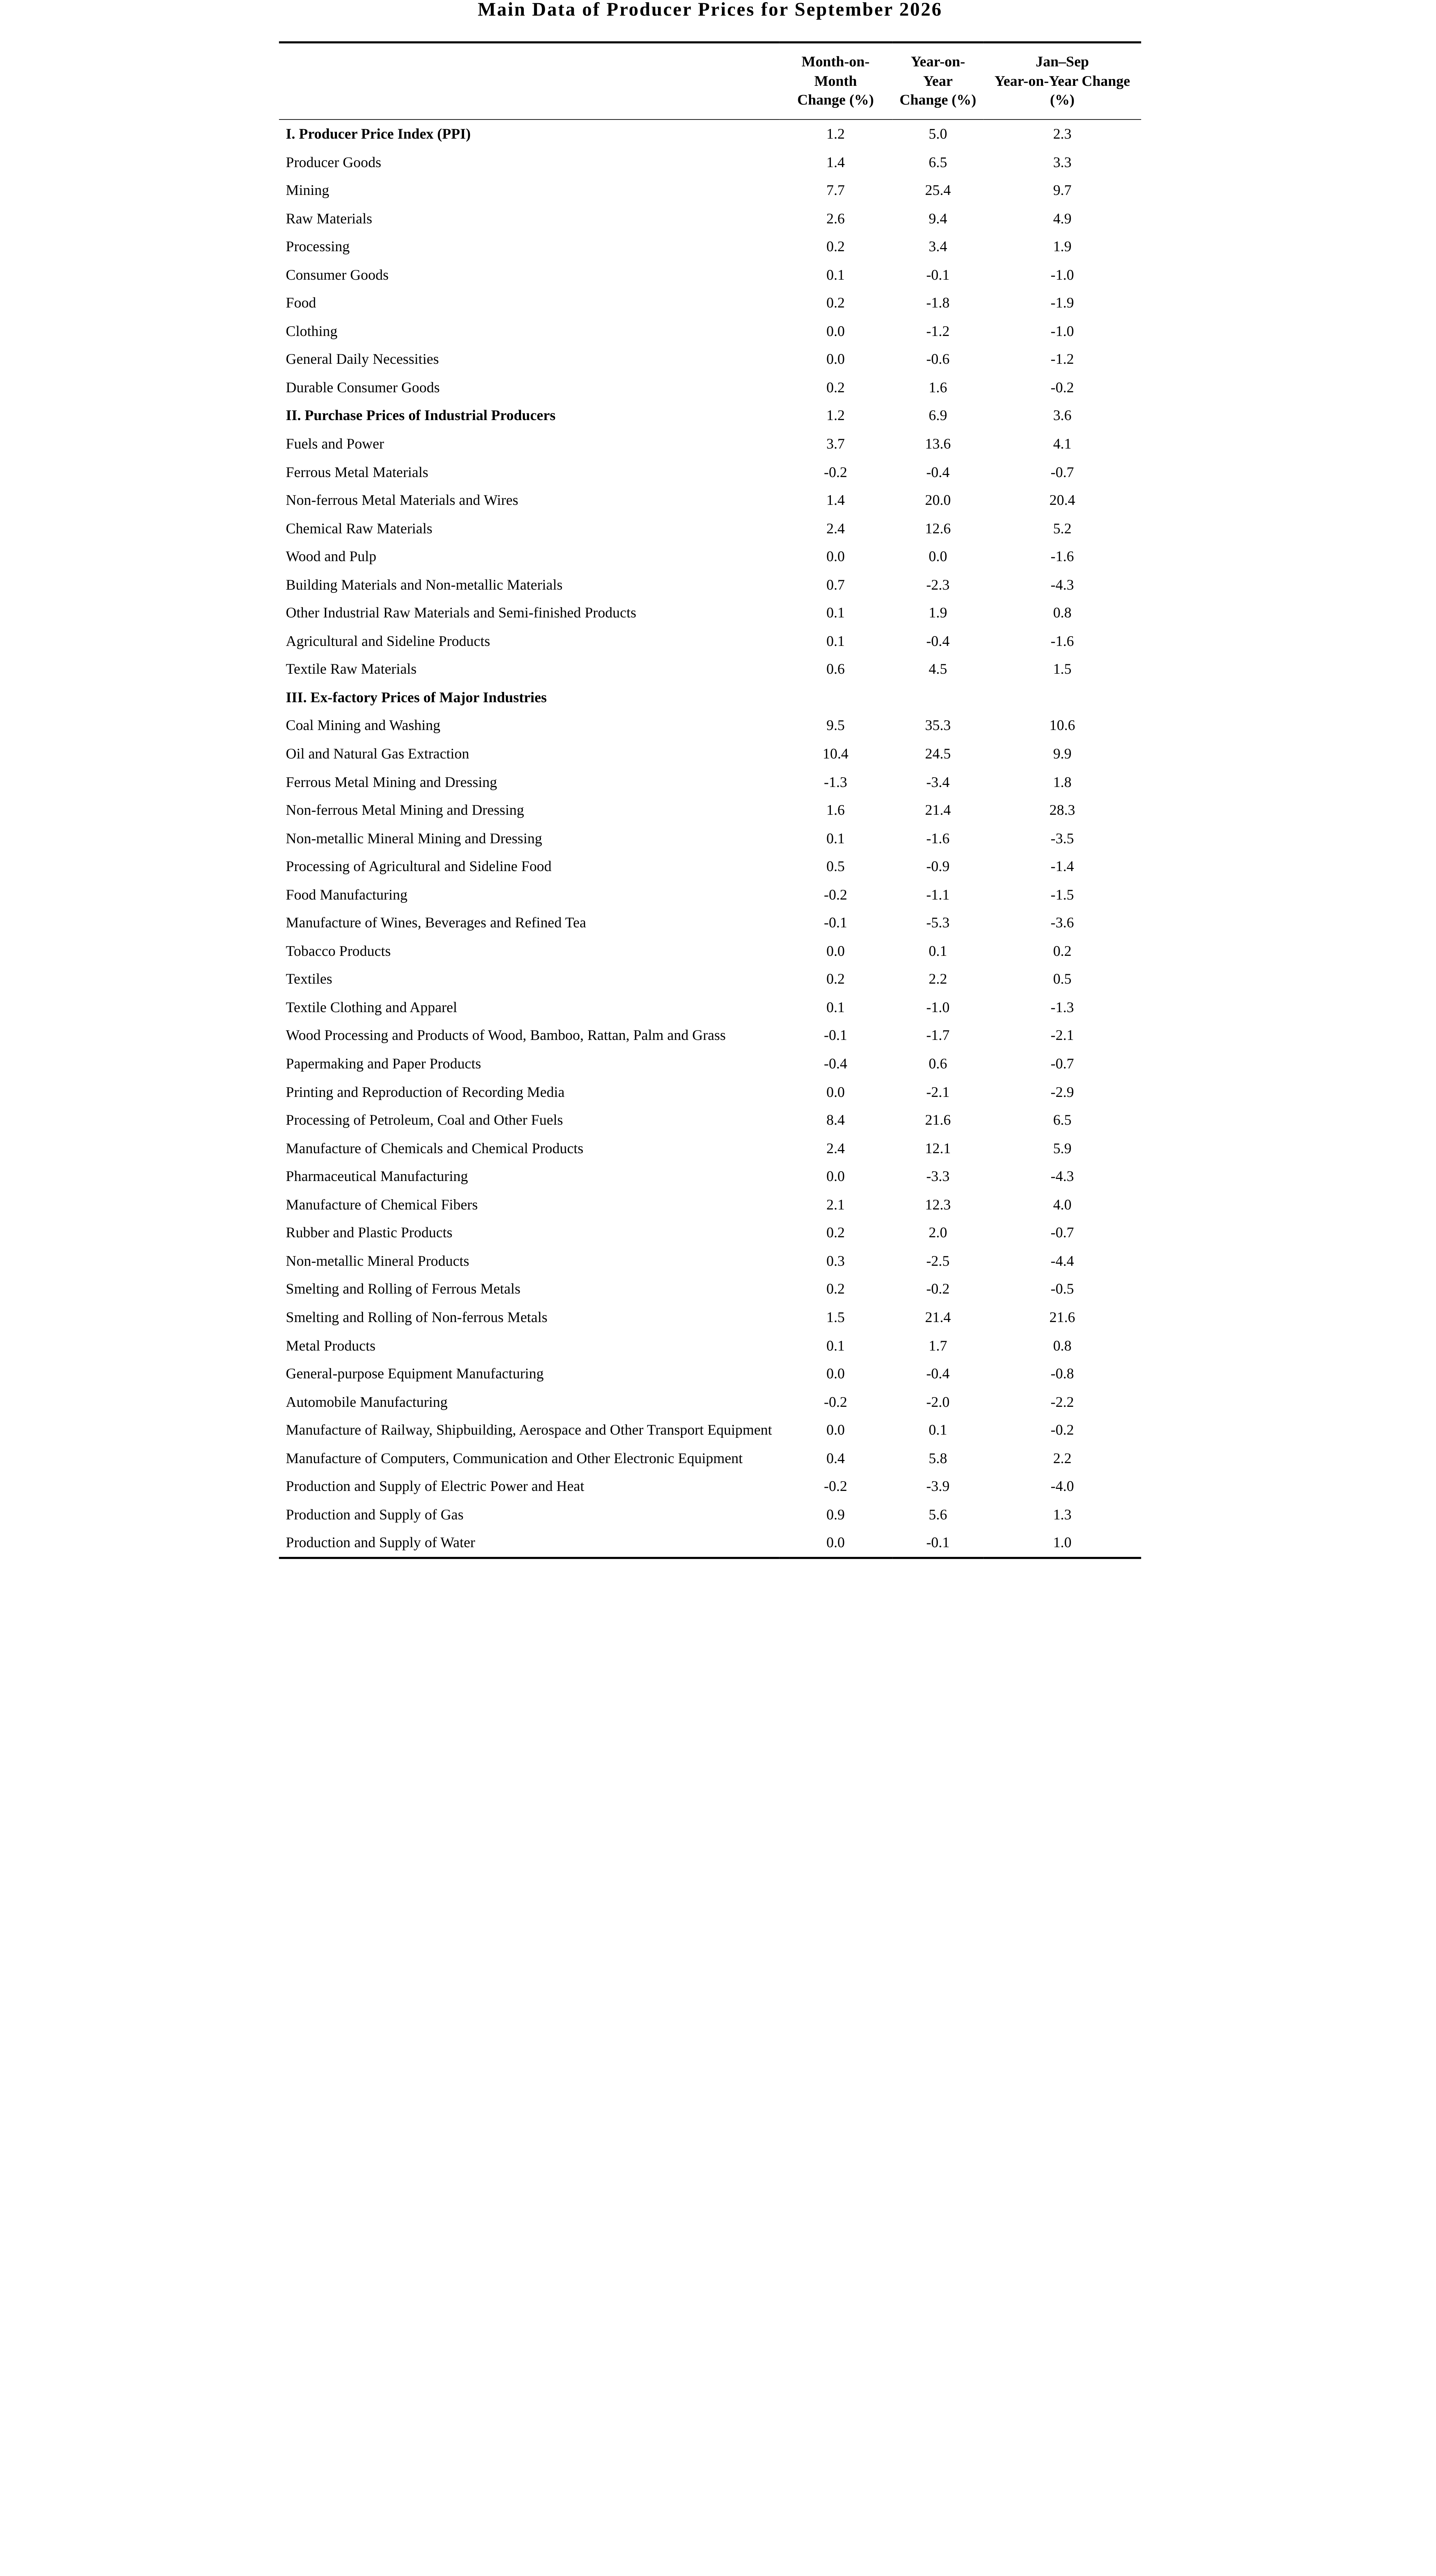
In September, within ex-works prices for industrial producers, the prices of means of production rose 6.5% YoY, contributing approximately 5.07 percentage points to the overall increase in ex-works prices for industrial producers. Among these, prices in the mining industry rose 25.4%, prices in the raw material industry rose 9.4%, and prices in the processing industry rose 3.4%. The prices of consumer goods fell 0.1%, contributing approximately 0.03 percentage points to the overall decline in ex-works prices for industrial producers. Among these, food prices fell 1.8%, clothing prices fell 1.2%, prices of general daily goods fell 0.6%, and prices of durable consumer goods rose 1.6%.
Within purchase prices for industrial producers, prices of non-ferrous metal materials and wires rose 20.0%, prices of fuels and power rose 13.6%, prices of chemical raw materials rose 12.6%, and prices of textile raw materials rose 4.5%; prices of building materials and non-metallic products fell 2.3%, while prices of ferrous metal materials and agricultural by-products both fell 0.4%.
II. MoM Changes in Industrial Producer Prices
In September, within ex-works prices for industrial producers, the prices of means of production rose 1.4% MoM, contributing approximately 1.14 percentage points to the overall increase in ex-works prices for industrial producers. Among these, prices in the mining industry rose 7.7%, prices in the raw material industry rose 2.6%, and prices in the processing industry rose 0.2%. The prices of consumer goods rose 0.1%, contributing approximately 0.03 percentage points to the overall increase in ex-works prices for industrial producers. Among these, food prices and prices of durable consumer goods both rose 0.2%, while clothing prices and prices of general daily goods both remained flat.
Within purchase prices for industrial producers, prices of fuels and power rose 3.7%, prices of chemical raw materials rose 2.4%, prices of non-ferrous metal materials and wires rose 1.4%, prices of building materials and non-metallic products rose 0.7%, prices of textile raw materials rose 0.6%, and prices of agricultural by-products rose 0.1%; prices of ferrous metal materials fell 0.2%.
YoY Growth in CPI and PPI Both Widened in September 2026
—Dong Lijuan, Chief Statistician of the Urban Department of the National Bureau of Statistics, Interprets the September 2026 CPI and PPI Data
—Dong Lijuan, Chief Statistician of the Urban Department of the National Bureau of Statistics, Interprets the August 2026 CPI and PPI Data
In September, the Consumer Price Index (CPI) rose 0.2% MoM, with the growth rate narrowing 0.2 percentage points from the previous month; it rose 0.9% YoY, with the growth rate widening 0.1 percentage points from the previous month; the core CPI, excluding food and energy prices, rose 1.0% YoY, with the growth rate unchanged from the previous month. The Producer Price Index (PPI) for industrial products rose 1.2% MoM, with the increase widening by 0.8 percentage points from the previous month; it rose 5.0% YoY, with the increase widening by 1.2 percentage points from the previous month.
1. CPI MoM growth pulled back, while YoY growth widened
On a MoM basis, the national CPI rose 0.2%, with the increase narrowing by 0.2 percentage points from the previous month. Service prices shifted from a 0.1% increase last month to a 0.2% decline, with the impact on the MoM CPI shifting from an upward push of about 0.04 percentage points last month to a downward drag of about 0.08 percentage points. Within services, as the summer vacation ended, airfare, hotel accommodation, and travel agency fees fell 8.7%, 7.0%, and 6.0%, respectively, together contributing about 0.12 percentage points to the MoM CPI decline; with the start of the autumn school term, education service prices rose 0.4%, contributing about 0.03 percentage points to the MoM CPI increase. Prices of industrial consumer goods rose 0.7%, with the increase narrowing by 0.1 percentage points from the previous month, contributing about 0.22 percentage points to the MoM CPI increase. Within industrial consumer goods, affected by changes in international market prices, domestic gasoline prices rose 4.9%, with the increase narrowing by 2.3 percentage points from the previous month, while gold jewelry prices shifted from a 7.6% increase last month to a 2.1% decline, with the two items together contributing about 0.14 percentage points to the MoM CPI increase; driven by higher costs, prices of mobile phones, computers, data storage devices, and tablet computers rose 3.7%, 2.0%, 1.7%, and 1.5%, respectively, together contributing about 0.04 percentage points to the MoM CPI increase; the launch of autumn apparel drove clothing prices up 0.7%, contributing about 0.03 percentage points to the MoM CPI increase. Food prices rose 0.4%, the same increase as last month, 0.8 percentage points below the seasonal average, contributing about 0.06 percentage points to the MoM CPI increase. Within food, prices of fresh vegetables, pork, eggs, and fresh fruit rose between 0.5% and 2.3%, together contributing about 0.05 percentage points to the MoM CPI increase; beef and mutton prices continued to rise, up 3.1% and 1.4% this month, respectively, with both increases widening, together contributing about 0.04 percentage points to the MoM CPI increase; with the end of the summer fishing moratorium, aquatic product supply was ample and prices fell 0.8%, contributing about 0.02 percentage points to the MoM CPI decline.
On a YoY basis, the national CPI rose 0.9%, with the increase widening by 0.1 percentage points from the previous month. Gasoline prices rose 16.6%, with the increase widening by 7.3 percentage points, contributing about 0.47 percentage points to the YoY CPI increase and driving energy price growth to widen from 4.1% last month to 7.3% this month. Prices for industrial consumer goods excluding energy rose 1.6%, with the growth rate narrowing by 0.2 percentage points, contributing approximately 0.39 percentage points to the YoY CPI increase. Among these, gold jewelry prices rose 22.5%, with the growth rate narrowing by 11.1 percentage points, contributing approximately 0.11 percentage points to the YoY CPI increase. Prices for data storage devices, tablet computers, computers, and mobile phones rose 46.7%, 23.6%, 21.8%, and 14.9%, respectively, with growth rates all expanding, together contributing approximately 0.23 percentage points to the YoY CPI increase. Service prices rose 0.8%, the same growth rate as the previous month, contributing approximately 0.40 percentage points to the YoY CPI increase. Within services, travel service prices rose 2.1%, with the growth rate expanding by 0.8 percentage points, while medical service prices rose 4.0%, the same growth rate as the previous month. Food prices fell 1.7%, with the decline widening by 0.3 percentage points from the previous month, contributing approximately 0.29 percentage points to the YoY CPI decline. Within food, pork and fresh vegetable prices fell 10.0% and 8.1%, respectively, together contributing approximately 0.33 percentage points to the YoY CPI decline. Prices for grain, edible oil, dairy products, and fresh fruit fell within a range of 0.6% to 1.5%, together contributing approximately 0.07 percentage points to the YoY CPI decline. Egg prices rose 17.4%, with the growth rate narrowing by 1.1 percentage points, contributing approximately 0.07 percentage points to the YoY CPI increase. Beef and mutton prices rose 7.5% and 6.4%, respectively, with growth rates continuing to expand, together contributing approximately 0.08 percentage points to the YoY CPI increase.
II. Both MoM and YoY PPI Growth Rates Expanded
On a MoM basis, China's PPI rose 1.2%, with the growth rate expanding by 0.8 percentage points from the previous month. The main features of this month's MoM PPI movement were as follows: First, rising international crude oil and nonferrous metals prices drove up prices in related domestic industries. Prices in petroleum extraction, refined petroleum product manufacturing, and organic chemical raw material manufacturing rose 14.5%, 7.4%, and 5.4%, respectively, while prices in nonferrous metals ore mining and dressing and nonferrous metals smelting and rolling processing rose 1.6% and 1.5%, respectively, with these five industries together contributing approximately 0.63 percentage points to the MoM PPI increase. Second, changes in supply and demand conditions in some energy and raw material industries boosted prices. Affected by factors such as increased coal stocking demand for winter heating, temporarily tight supply in major mining areas, and expectations of rising international coal prices, prices in coal mining and washing and coal processing rose 9.5% and 13.6%, respectively. Demand for building materials such as steel and cement rebounded somewhat, and coupled with rising raw material costs, prices in the nonmetallic mineral products industry turned to a 0.3% increase after seven consecutive months of decline, while prices in ferrous metals smelting and rolling processing rose 0.2%, with these four industries together contributing approximately 0.38 percentage points to the MoM PPI increase. Third, accelerated development in areas such as artificial intelligence and computing-power-electricity coordination drove demand growth and price increases in some industries. Prices in the electrical machinery and equipment manufacturing industry and the computer, communications, and other electronic equipment manufacturing industry both rose 0.4%, with the two industries together contributing about 0.07 percentage points to the MoM increase in PPI.
On a YoY basis, national PPI rose 5.0%, with the increase 1.2 percentage points wider than the previous month. By major industry, among industries with rising prices, coal mining and washing rose 35.3%; oil and natural gas extraction, oil, coal, and other fuel processing, and chemical raw materials and chemical products manufacturing rose 24.5%, 21.6%, and 12.1%, respectively; non-ferrous metal ore mining and dressing and non-ferrous metal smelting and rolling both rose 21.4%; electrical machinery and equipment manufacturing rose 6.2%; and computer, communications, and other electronic equipment manufacturing rose 5.8%. The increases in these eight industries all widened from the previous month, together contributing about 5.42 percentage points to the YoY increase in PPI, with the upward contribution 1.12 percentage points higher than the previous month. Among industries with falling prices, wine, beverages, and refined tea manufacturing fell 5.3%; electricity and heat production and supply fell 3.9%; pharmaceutical manufacturing fell 3.3%; non-metallic mineral products fell 2.5%; and automobile manufacturing fell 2.0%. These five industries together pulled down YoY PPI by about 0.66 percentage points.
![Copper Plate/Sheet and Strip: End-Use Demand Resilience Provides Support, Industry Operating Rates Stay High [SMM Analysis]](https://imgqn.smm.cn/usercenter/vdbfy20251217171709.jpg)
![The most-traded SHFE tin SN2611 contract fell 3.52% overnight, breaking below 380,000 yuan, while LME tin dropped 2.71% to $51,767, pressured by both macro and AI sector sentiment [SMM Tin Morning Meeting Summary]](https://imgqn.smm.cn/usercenter/SkvFp20251217171752.jpg)
![SHFE lead remains strong & spot cargo supply is tight, lead prices consolidate on a strong note [SMM Lead Morning Meeting Summary]](https://imgqn.smm.cn/usercenter/rDPju20251217171722.jpg)