I. Market Snapshot: Three Major Signals Appeared Simultaneously, and the “Traffic Light” for a Logic Shift Turned On
In the last week of July, China’s aluminum ingot market saw a set of signals that were both contradictory and mutually corroborating:
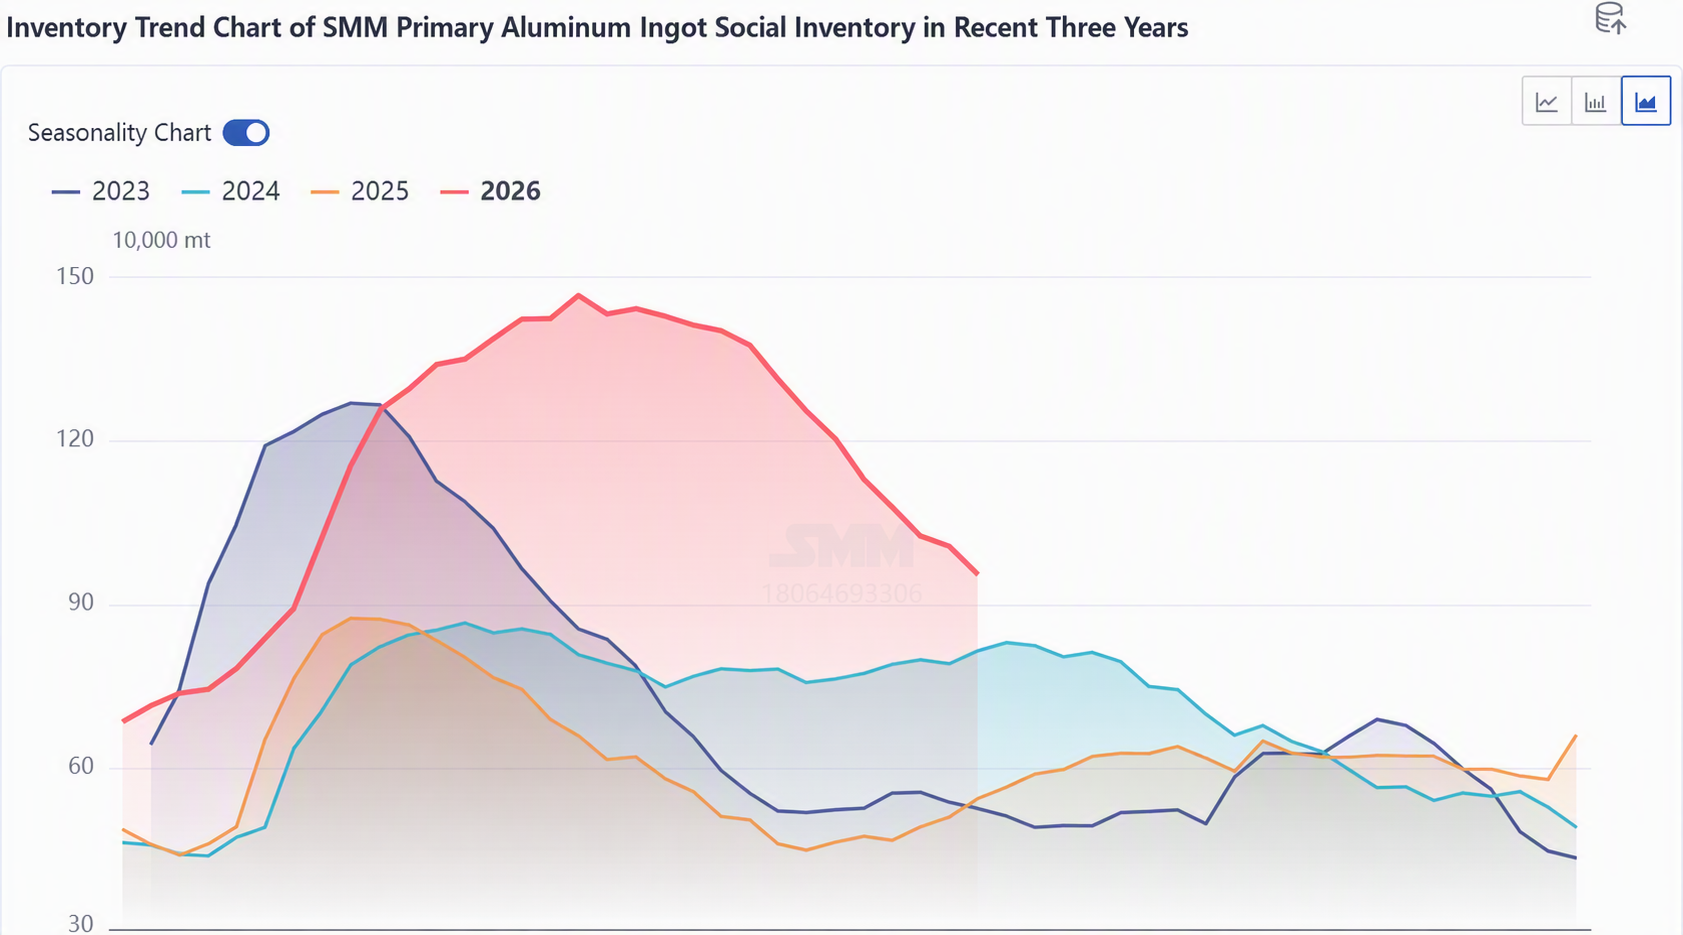
① Accelerating inventory drawdown: inventory in major consumption hubs stood at 953,000 mt, down 53,000 mt during the week, falling below the 1 million mt threshold;
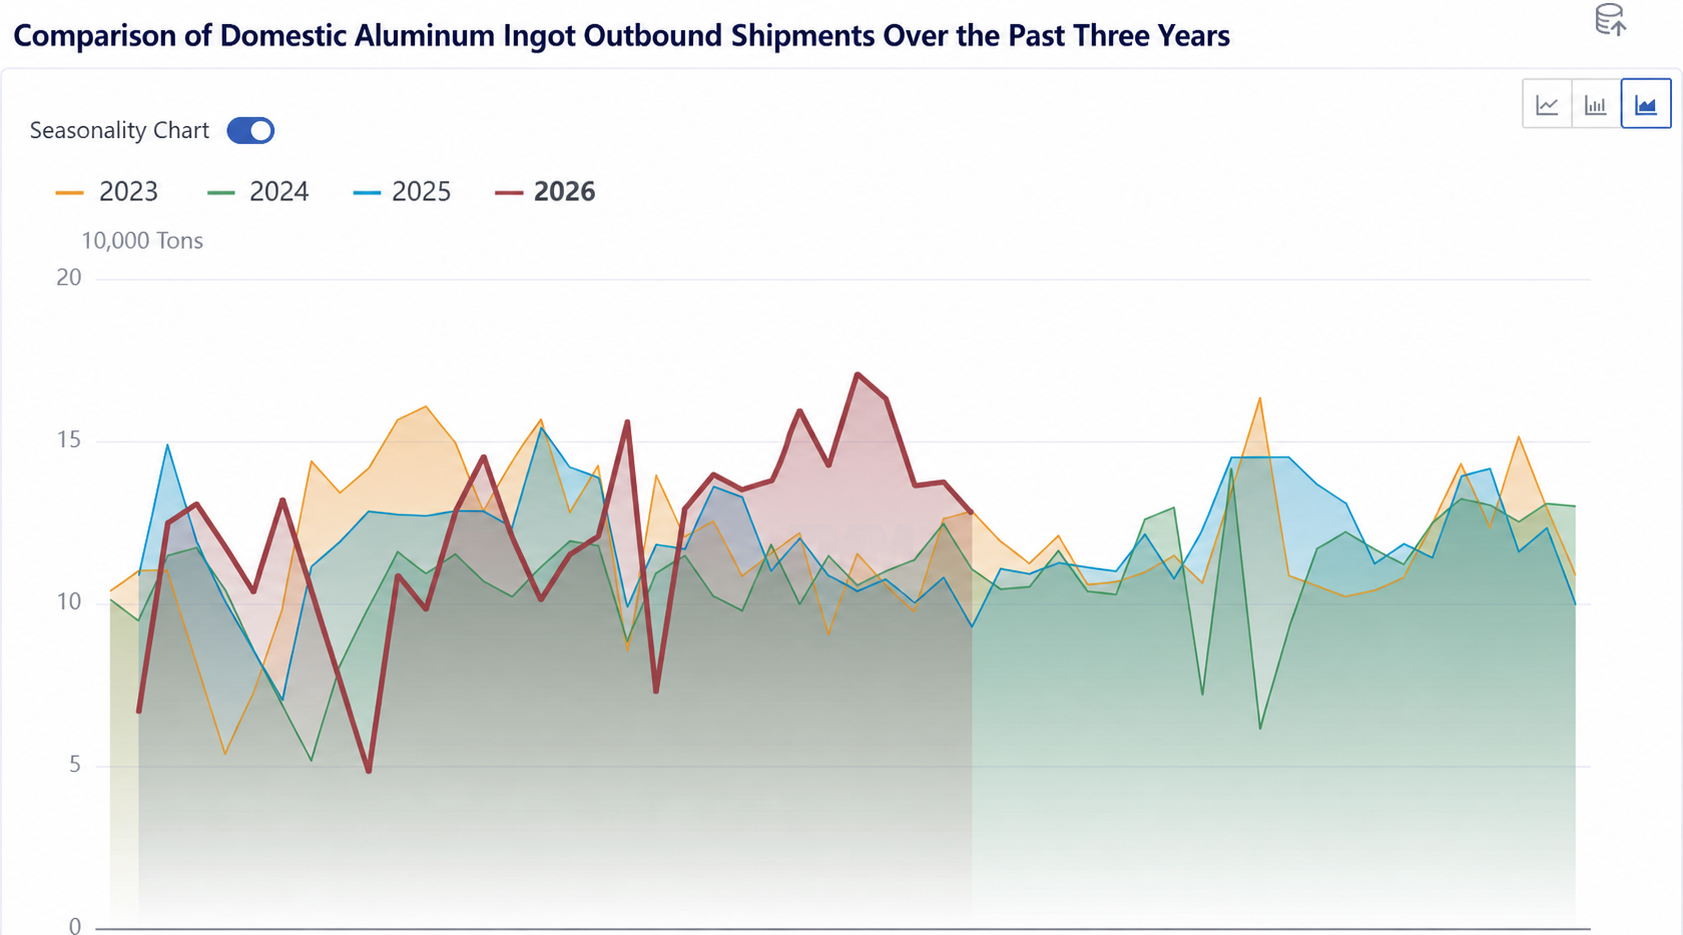
② Warehouse withdrawals pulled back notably: weekly warehouse withdrawals were 127,700 mt, down 9,700 mt from the prior week, losing its advantage versus the near four-year high for the same period;
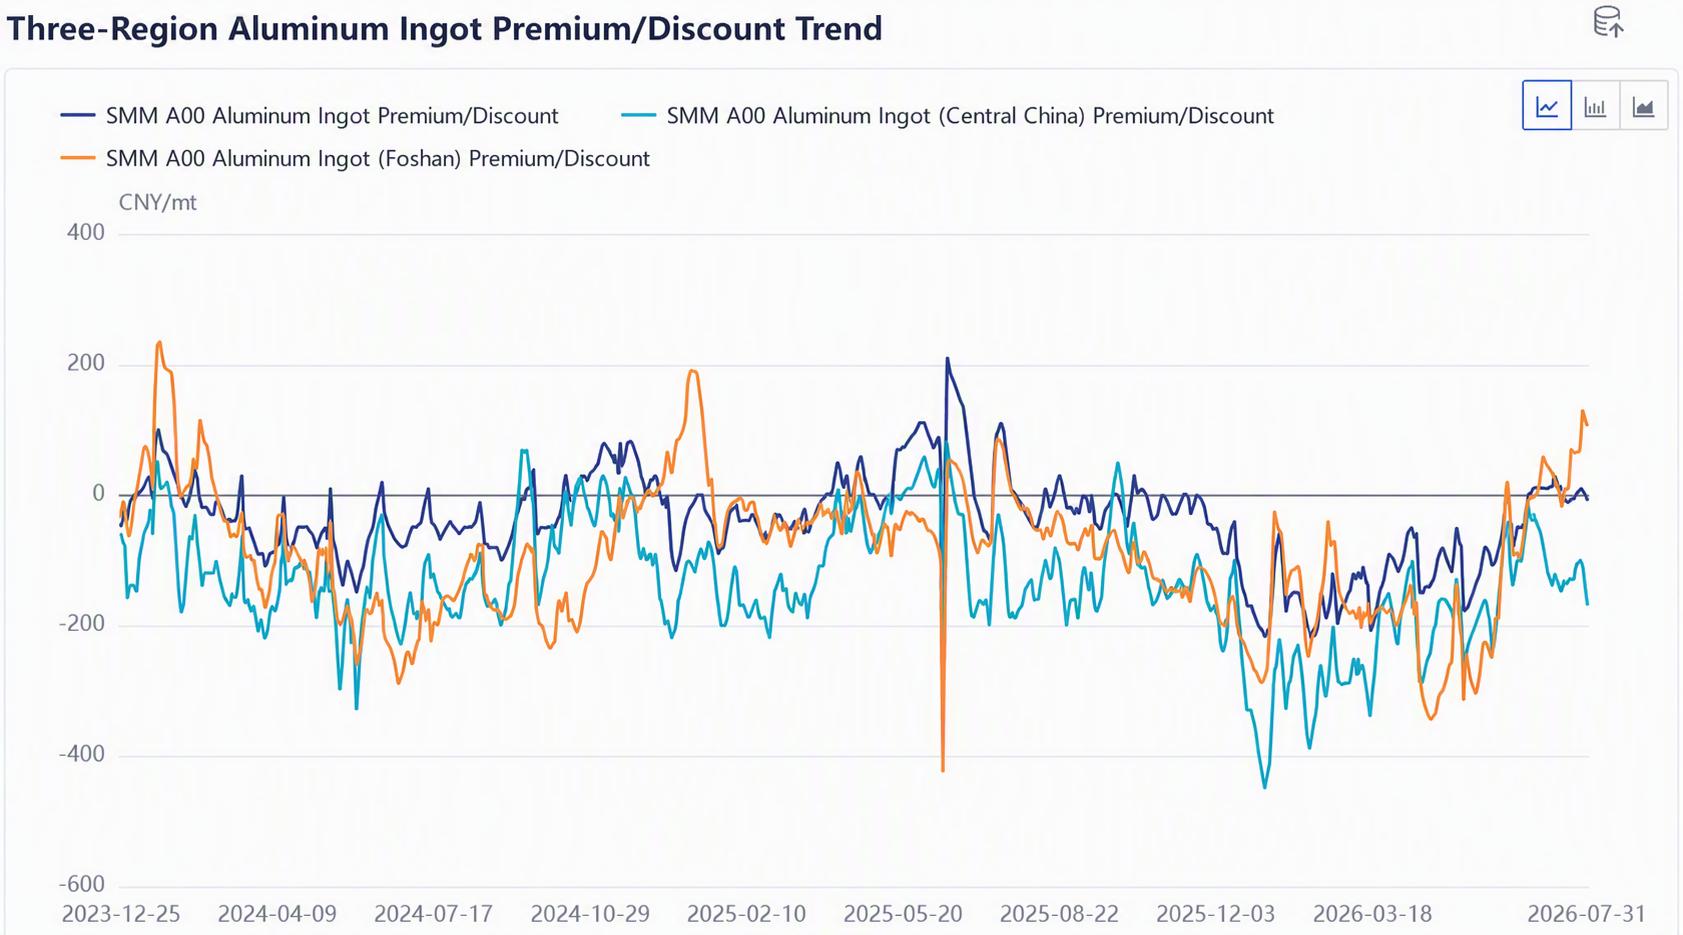
③ South China strengthened against the trend: Foshan posted a premium of 115 yuan/mt against the 2608 contract, widening by 50 yuan/mt over the week, making Foshan the region with both the largest destocking and the highest premium this week;
SMM’s assessment:Inventory fell while demand indicators weakened—warehouse withdrawals declined and transactions in east China and central China were sluggish—indicating that this round of destocking was no longer driven by the demand side. The true driver behind the faster destocking this week came from the supply side’s “shipment pace slowdown,” especially as arrivals in South China plunged MoM. This “supply-contraction-driven destocking” is fundamentally different from June’s “warehouse-withdrawals-driven destocking”: once shipments recover, the destocking slope may slow down rapidly; the latter was driven by end-user digestion and is more sustainable.
II. Full Inventory Picture: Falling Below 1 Million mt, with 512,000 mt Destocked—A Recent High
1. Absolute Level and Destocking Pace
According to SMM statistics, as of July 30, aluminum ingot inventory in China’s major consumption hubs was reported at 953,000 mt, down 26,000 mt from this Monday (July 27) and down 53,000 mt from last Thursday WoW. From the year-to-date high of 1.465 million mt in early May, cumulative destocking in this round pulled back by 512,000 mt, with a destocking magnitude of 35%. Both the absolute destocking volume and the magnitude were the highest in the past three years.
From a three-year same-period comparison, the absolute inventory level at month-end July 2026 was still about 300,000-350,000 mt higher than the same period in 2024 and 2025, but the cumulative destocking slope was markedly steeper—destocking over the same period in 2024 and 2025 was only 26% and 30%, respectively, while 2026 had reached 35%, showing a distinctive pattern of “high base, accelerating destocking.” Inventory levels in August are expected to further converge toward the historical average.
2. Warehouse-Withdrawal Trend: From a “Pulse New High” to a “Retreat From Highs”
The June peak in warehouse withdrawals once hit a near four-year high (170,000 mt in a single week), but it trended lower consecutively after entering July. China’s weekly aluminum ingot warehouse withdrawals pulled back to 127,700 mt, down 9,700 mt from the prior week, temporarily losing its advantage over the same period in recent years . The shift in withdrawals from “pulse-style surges” to “trend-driven declines” became the core benchmark for gauging the quality of this destocking cycle.
Three factors suppressing withdrawals:
- the rebound in the aluminum price center dampened downstream purchases: SHFE aluminum drifted higher from July, weakening end-users’ purchase willingness amid elevated prices, with procurement sentiment cooling;
- lower aluminum billet processing fees eroded substitution effects: the earlier substitution logic between aluminum ingot and billet significantly weakened, as “substitution” demand for ingots ebbed;
- the traditional off-season persisted for end-users: with sectors such as real estate, building materials, and autos broadly under pressure, activity was dominated by restocking for essential needs, while willingness to restock proactively was limited.
- Key benchmark: June’s “destocking driven by surging withdrawals” carried rather strong sustainability, because it was powered by downstream consumption; in contrast, the current combination of “weakening withdrawals + accelerating inventory” represents “passive destocking” caused by a phased supply-side contraction. Once upstream shipment pace recovers or a week of concentrated arrivals hits South China, the destocking trajectory may slow down in phases, or even a single week of inventory buildup could emerge.
3. South China spot: sharp drop in arrivals was the core driver behind the strengthening of premiums
In Foshan, spot premiums widened by 50 yuan/mt over the week to 115 yuan/mt, making it the strongest market among the three regions. The strengthening of premiums was supported by three layers:
① Sharp decline in arrivals – the core variable: the persistently high proportion of liquid aluminum in southwestern upstream operations significantly squeezed casting ingot volumes, setting the tone for tight arrivals; coupled with the phased release of some invisible inventory and imported aluminum nearing completion, arrivals contracted to a tight state. This was the primary reason for Foshan’s materially stronger premiums, with the remaining factors being “amplifiers”.
② Aggressive buying by large players – a short-term catalyst: mid-week, large players aggressively bid up prices to purchase and make markets, while suppliers firmly held a bullish outlook, holding back from selling, further amplifying the spot signal of tight arrivals.
③ Resilience in essential demand – withdrawals rose against the trend: Foshan’s weekly warehouse withdrawals recorded 30,400 mt , rising rather than falling. Downstream essential demand showed strong resilience, and acceptance of higher prices was better than in East China and central China, providing a demand-side floor for premiums.
SMM analysis: the essence of Foshan’s strengthening premiums was “supply-contraction-driven premiums”, not “demand-expansion-driven premiums”. The proportion of liquid aluminum in Southwest China was expected to edge up steadily in August. After Foshan’s price advantage became evident, it may attract incremental inflows of some cargoes, but replenishment from arrivals still takes time. In the short term, South China was set to maintain a pattern of destocking plus high premiums.
IV. August Outlook: The Destocking Trend Remained Unchanged, but the Efficiency of “Supply-Driven Destocking” Still Needed Verification
According to SMM statistics, China’s aluminum production in July 2026 (31 days) increased 1.6% YoY and 3.5% MoM. While production rebounded MoM, the share of liquid aluminum output in China rose further: the proportion of liquid aluminum increased by 1.1 percentage points MoM to 78.3% for the month, slightly above expectations at the beginning of the month overall. Based on SMM’s estimates of the proportion of liquid aluminum, China’s casting ingot output in July fell 15.1% YoY and 1.4% MoM. Production was still growing YoY, but physical supply on the casting ingot side contracted markedly—this was the most critical fundamental supporting the continuation of destocking and also the underlying basis for the unchanged destocking trend in August.
SMM believed that, entering August, against the backdrop of both weak supply and weak demand for aluminum ingot in China, the overall destocking logic remained unchanged. However, the core driver had shifted from “warehouse-withdrawal demand boost” to “supply contraction + shipment pace”:
- Continued contraction on the supply side: the proportion of liquid aluminum was expected to rise to 78.5% in August, further compressing casting ingot output; the standardization push for aluminum capacity in China continued, leaving limited room for growth in aluminum ingot supply;
- Tight arrivals in South China persisted: with the proportion of liquid aluminum in Southwest China staying high and the Southwest-to–South China shipment pace unlikely to improve significantly in the short term, the tight-arrival pattern in Foshan continued;
- Limited demand-side elasticity: August remained the traditional off-season, with downstream mainly stockpiling for rigid demand; coupled with aluminum prices holding up well recently, warehouse withdrawals were unlikely to expand again and break above the previous highs.
- The export window narrowed sharply: the SHFE/LME price ratio continued to recover this week; as of July 30, the SHFE/LME price ratio had rebounded to 7.4, up 13.8% from the previous low of 6.5. Import losses narrowed to around 3,300 yuan/mt, more than 45% narrower than the prior peak loss of 7,604 yuan/mt.
Key differences: June’s destocking was driven by a surge in warehouse withdrawals—warehouse withdrawals of 170,000 mt hit a nearly four-year high, supported by genuine end-user consumption, with strong sustainability; the current destocking was driven by a slowdown in shipment pace—warehouse withdrawals had pulled back to 127,700 mt, and once supply-side contraction eased, the destocking slope would slow rapidly. The essential difference between the two was: demand-driven destocking meant “downstream is buying,” while supply-driven destocking meant “upstream has no volume.”The former was proactive destocking, while the latter was passive destocking.Therefore, support on the supply side will determine the continuation of the destocking trend, but performance on the demand side will determine the pace of subsequent destocking.

![Alumina Weakness Hard to Change: Cost Support Battles Surplus, 2,600 Level Under Test [SMM Analysis]](https://imgqn.smm.cn/usercenter/wvGIW20251217171655.jpg)