[SMM Hot Topic] Estimated “Cliff-Like” Drop in China’s Steel Exports—A Ramadan Pattern or a War Shock?
As mentioned above, [Persian Gulf Shutdown? The Impact of the U.S.-Iran Conflict on Global Steel Trade]amid the US–Iran conflict, global steel trade was shaken and reshaped. Another topic that has recently been widely discussed in the market is: what impact will this war have on China’s total export volume? Before going into detail, it is important to remind everyone that the current focus has largely remained on geopolitical conflict, while often overlooking that this period coincides with Ramadan, a seasonal trough. Therefore, to quantify the war’s actual impact more accurately, SMM conducted corresponding “dehydration” adjustments based on ferrous panoramic shipping data.
- Most Direct Impact: A Deep Shortfall on the Shipping Side

Data Source:SMM Ferrous Metal Shipping
According to the table above, in the absence of war, during Ramadan 2025, China’s average weekly shipments to Gulf countries were about 327,000 mt, while the average weekly shipments in the month after Ramadan ended were 450,400 mt. Therefore, keeping average weekly shipments at around 300,000 mt during Ramadan is considered a “normal contraction” level.
By further comparing the same-period data for 2026 and 2025, we can precisely calculate the quantified impact caused by the war.
As of the latest date, in the first 20 days of Ramadan, China exported and shipped only 5,000 mt, with a weekly average of only 1,750 mt.
Estimation logic: If there were no war, based on a neutral assessment using the 2025 Ramadan benchmark, total shipments in the first 20 days should have been about 930,000 mt; therefore, the war resulted in shipment losses of about 925,000 mt.
Therefore, we can conclude that the more than 99% plunge on the shipping side was most likely caused by the war (route blockades, shipowners’ risk aversion), and the Ramadan factor is almost negligible in the face of such a massive decline.
- Delayed Effects on the Arrival Side

Data Source: SMM Ferrous Metal Shipping
In addition to the impact on the shipping side, SMM’s ferrous panoramic shipping data also showed that after operations were suspended at multiple ports, a combination of factors—such as vessels being unable to berth and unload—led to a decline in the total volume of steel arriving at ports.
As of the latest date, average weekly arrivals were about 220,200 mt, down by roughly 82,000 mt/week from 302,200 mt over the same period last year.
Estimation logic: assuming no war impact and using a neutral assessment based on the 2025 Ramadan benchmark, cumulative arrivals in the first 20 days should have been about 863,400 mt, implying a cumulative shortfall of about 234,000 mt.
Cause breakdown: it is expected that the decline on the arrivals side was not as pronounced as that on the shipments side, because among these 12 arriving vessels, most carried orders that had already been dispatched before the full outbreak of the war or in the early stage of the situation (Jan 25–Feb 25). Therefore, this 234,000 mt gap was mainly due to war-driven route detours (delays) and partial port shutdowns.

Data Source: SMM Ferrous Metal Shipping
In summary, based on the data, we can conclude that Ramadan was merely the “backdrop,” while the war was the “main cause.” If the impact were only from Ramadan, we should still have had about 300,000 mt of steel shipped to the Gulf each week. The reality, however, is that since Feb 18, our average weekly shipments have plunged to less than 2,000 mt. This means that, within the currently observed gap, shipment losses of more than 900,000 mt were entirely caused by war-related order stagnation or shipping lane disruptions. The 27% decline currently seen on the arrivals side is only the beginning; the real “vacuum period” will fully emerge in late March, during the latter part of Ramadan.
- At present, a phased contraction in China’s total steel exports to the Middle East has become a foregone conclusion. Does this mean the strong momentum of China’s full-year exports will come to a halt here?
According to SMM steel export take-order data, last week, the total orders taken by 31 exporters were about 765,000 mt, up 20.76% MoM. Among them, export orders for long products were about 437,000 mt, up 56.07% MoM; export orders for sheets & plates were about 328,000 mt, down 7.21% MoM. Against the backdrop of rising export prices, this growth did not stem from a broad-based global economic recovery, but from forced shifts in trade flows driven by geopolitical conflicts. On the one hand, instability in Iran diverted Southeast Asian orders to China, driving a boom in steel billet exports; on the other hand, conflict in the Middle East pushed up shipping costs, and the surge in fuel prices directly caused physical disruptions along the trade chain. Even if there is overseas demand, the sharp rise in freight rates also weakened the pricing advantage of Chinese steel products.
SMM Steel Export Orders Taken - 31 Companies (10kt)
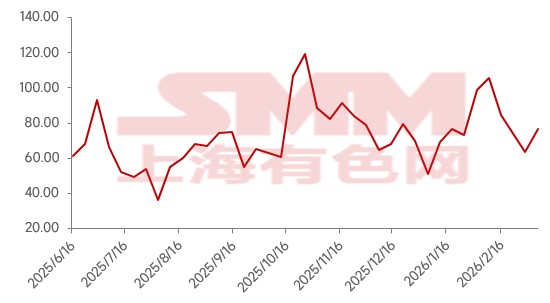
Data Source:SMM Weekly Steel Export Report
Therefore, although the reduction in exports to the Middle East has already been confirmed by the data, assessing its impact on China’s total exports for the full year still needs to be based on a “global rebalancing” perspective: is the “gap” created after demand in Gulf countries is constrained being converted into “incremental volume” in other markets? What is the actual absorption capacity of these emerging incremental markets? Can they offset the monthly shipping loss of 900,000 mt from the Middle East? Please continue to follow SMM Steel Industry Research; we will regularly update global shipping developments…
Copyright and Intellectual Property Statement:
This report is independently created or compiled by SMM Information & Technology Co., Ltd. (hereinafter referred to as "SMM"), and SMM legally enjoys complete copyright and related intellectual property rights.
The copyright, trademark rights, domain name rights, commercial data information property rights, and other related intellectual property rights of all content contained in this report (including but not limited to information, articles, data, charts, pictures, audio, video, logos, advertisements, trademarks, trade names, domain names, layout designs, etc.) are owned or held by SMM or its related right holders.
The above rights are strictly protected by relevant laws and regulations of the People's Republic of China, such as the Copyright Law of the People's Republic of China, the Trademark Law of the People's Republic of China, and the Anti-Unfair Competition Law of the People's Republic of China, as well as applicable international treaties.
Without prior written authorization from SMM, no institution or individual may:
1. Use all or part of this report in any form (including but not limited to reprinting, modifying, selling, transferring, displaying, translating, compiling, disseminating);
2. Disclose the content of this report to any third party;
3. License or authorize any third party to use the content of this report;
4. For any unauthorized use, SMM will legally pursue the legal responsibilities of the infringer, demanding that they bear legal responsibilities including but not limited to contractual breach liability, returning unjust enrichment, and compensating for direct and indirect economic losses.
Data Source Statement:
(Except for publicly available information, other data in this report are derived from publicly available information (including but not limited to industry news, seminars, exhibitions, corporate financial reports, brokerage reports, data from the National Bureau of Statistics, customs import and export data, various data published by major associations and institutions, etc.), market exchanges, and comprehensive analysis and reasonable inferences made by the research team based on SMM's internal database models. This information is for reference only and does not constitute decision-making advice.
SMM reserves the final interpretation right of the terms in this statement and the right to adjust and modify the content of the statement according to actual circumstances.
![[Domestic Iron Ore Commentary] Iron Ore Concentrates Prices in the Tangshan Area May Have Some Upside Potential](https://imgqn.smm.cn/usercenter/HbWNv20251217171718.jpg)
![Maintenance Intensified, Iron Ore Lacked Upward Momentum and Ultimately Closed Up 0.26% [SMM Brief Commentary]]](https://imgqn.smm.cn/usercenter/SEwWP20251217171716.jpg)
![[SMM Steel] JSW Steel February crude steel output slips amid Vijayanagar furnace upgrade](https://imgqn.smm.cn/usercenter/SduBz20251217171716.jpg)