Money Metals News Service April 28th, 2017
There’s this notion put forth by the majority in the precious metals community that the Fed and Central Banks control the market price of gold. I have even heard that some analysts believe the Fed could push the gold price any where they saw fit... even to zero. While I agree that the Central Banks do play a role in gold market intervention, they most certainly CANNOT push the price of gold anywhere they want. This is an absolute falsity... and I have the data to prove it.
To understand how the market determines the price of gold, we must first dismiss the economic principle of SUPPLY & DEMAND. While supply and demand forces are factors in the short-term price movement of gold, they do not really factor all that much over the longer term.
Here is a chart showing the relationship of the gold and oil price since the 1940’s:
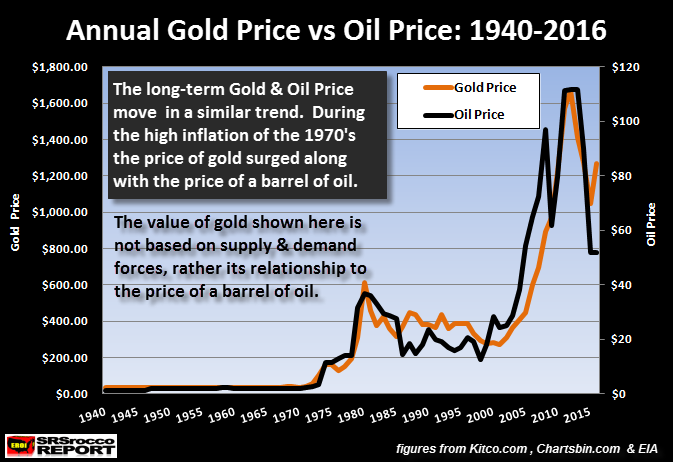
The gold price is in DARK ORANGE while the oil price is in BLACK. We can plainly see the price of gold and oil have moved in tandem, especially after Nixon dropped the Dollar-Gold peg in 1971. While the oil-gold price movements are not exact, they parallel each other quite nicely. Thus, when the oil price skyrocketed during the 1970’s, so did the gold price. The same thing took place in the 2000’s.
Interestingly, the same thing took place with the silver price below:
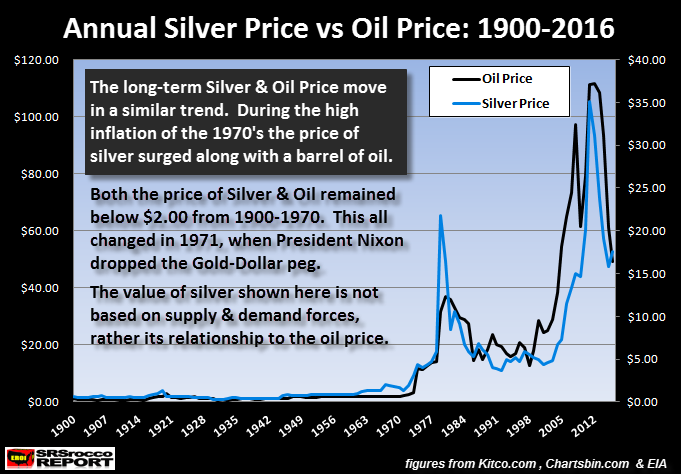
In both of these charts, the volatility in the oil, gold and silver price increased significantly after 1971. There was an underlying reason for this… and it just wasn’t the dropping of the U.S. Dollar convertibility into gold in 1971. It was also due to the fact that the United States peaked in domestic cheap oil production in 1970. This was actually the peak of the U.S. Empire, even though we have continued to dominate the world by exchanging PAPER (U.S. Treasuries) for physical OIL-GOODS.
So, if we look at these two charts above, we can plainly see the oil price was more the LEADING DRIVER in the gold and silver price than were supply and demand forces. Again, supply and demand forces add volatility to the gold and silver price over the short-term, but the energy cost (mainly oil) has been the leading driver over the longer term.
Who Really Controls The Gold Price??
If the gold price has paralleled the oil price, then who really controls the gold market price?? While I agree that the Fed & Central Banks are intervening in the gold market, they can really only control the UPWARD movement in the price of gold. Why? Well, if we look at the chart below, we find our answer:
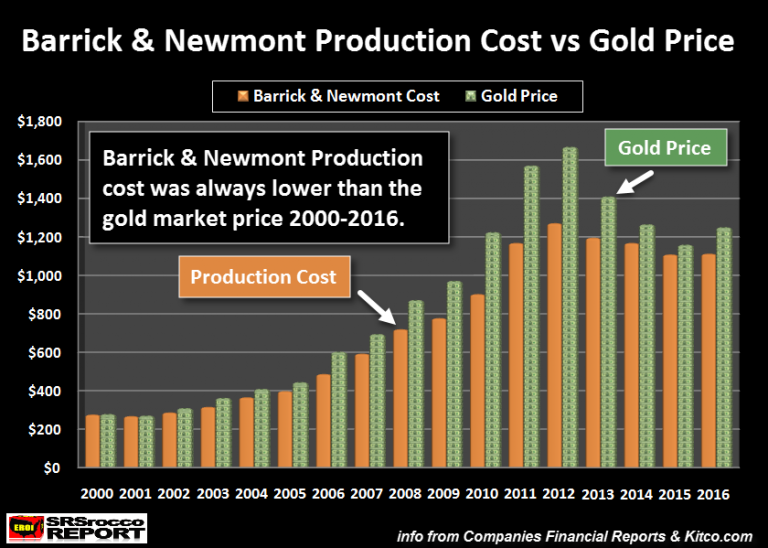
This chart shows the difference between the total production cost of the top two gold miners, Barrick and Newmont, versus the annual average gold market price. The chart clearly shows that the production cost is always less than the gold market price.
In the early 2000’s, the top two gold miners production cost was closer to the market price. However, after the U.S. Housing and Banking Market collapsed in 2008, the gold market price moved up considerably higher than the cost of production. My analysis suggests that the gold price was starting to head towards its high-quality STORE OF VALUE properties, rather than its COMMODITY PRICING mechanism.
NOTE: I determined Barrick & Newmont’s production cost by using my Net Income & Adjusted Income approach. This is much different than going by either Cash Costs or All-In-Sustaining Costs. My estimated total production cost includes more items such as taxes-interest expense and etc, that are not considered in cash costs or all-in-sustaining costs.
Also, cash costs are a totally bogus metric as they deduct the miners by-product revenue to arrive at a very low cash cost. They list them as by-product credits — other metals extracted and produced along with gold in the process. However, they are not really credits. These miners need these by-product metal sales to fortify their balance sheets. Without them, many mining companies would be suffering losses, not profits.
Thus, a credit is something that one does not need… it’s a plus. In reality, most of these mining companies need their by-product metal sales to remain profitable.
That being said, here are some examples of the Barrick and Newmont’s cost of production versus the gold market price:
2000 Production Cost = $276
2000 Market Gold Price = $279
2012 Production Cost = $1,272
2012 Market Gold Price = $1,669
2016 Production Cost = $1,113
2016 Market Gold Price = $1,251
Now, the reason the production cost at Barrick and Newmont has fallen from $1,272 in 2012 to $1,113 in 2016, is mainly due to the 50%+ decline in the price of oil. It takes a lot of energy to produce an ounce of gold. Oil was trading over $100 in 2012, but fell to $45 in 2016. Even though the energy cost has fallen significantly, labor costs have not declined all that much in the gold industry.
For instance, Barrick’s labor payroll per ounce of gold only declined from $328 in 2012 to $304 in 2015. This is only a 7% decline in labor cost even though oil price dropped considerably in 2015:
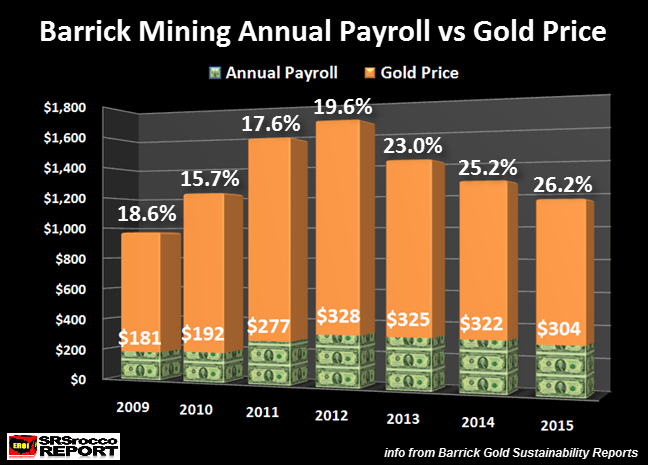
On the other hand, the lower gold price has put more stress on Barrick’s financial bottom line as their payroll accounted for 26% of each gold ounce produced in 2015 compared to only 18% in 2009. Investors need to realize it takes a massive amount of energy, labor, materials and capital to produce an ounce of gold.
If we look at the Barrick-Newmont Production Cost vs. Gold Price chart above, we see that the market price was never lower than the production cost. Which means, the market or Central Banks did not push the gold price below the cost of production. This is an important factor to understand when you listen to analysts suggesting that the Central Banks can rig the gold price down to whatever level they desire.
That is total BOLLOCKS...
As, I have mentioned, the Fed and Central Banks can intervene in the market to control HOW HIGH the gold price will go. That is the big difference. So, those who continue to believe Harry Dent’s forecast that gold will go down to $700 an ounce, aren’t considering the COST OF PRODUCTION. Harry Dent spends a lot of money advertising to get people to buy his books or newsletters. Touting a $700 gold price gets people motivated in buying what he sells.
Unfortunately, Dent, like most analysts, tend to leave out the energy in their forecasts. This is truly hilarious as energy is the leading driver of our economies… not supply-demand or finance.
The Production Cost Of Gold Is Higher When We Consider Capital Expenditures
My Net Income & Adjusted Income approach for determining the production cost of gold (and silver) provides a much more realistic metric than the industry’s “cash costs” or “all-in-sustaining costs.” However, when a mining company releases its income statements, they do not include their capital expenditures (CAPEX). Their net income (or adjusted income) does not include capital expenditures. To find out what they paid in CAPEX, we must look at the Cash Flow Statements.
If we consider what Barrick and Newmont spent on CAPEX and then deducted it from their cash from operations we would arrive at their FREE CASH FLOW:
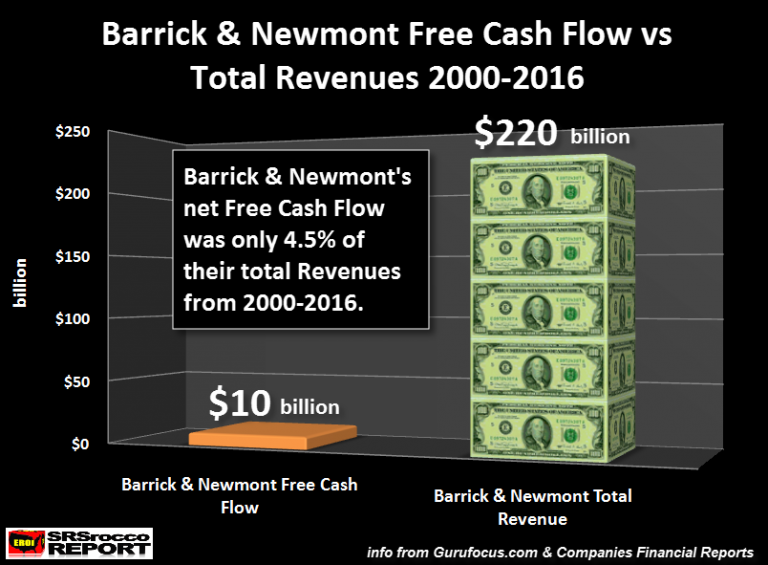
From 2000 to 2016, these top two gold miners free cash flow was a net $10 billion. If we compare their free cash flow of $10 billion to the total $220 billion in revenues, it only accounted for 4.5% of their revenues. Thus, Barrick and Newmont’s free cash flow shows that it cost more to produce gold than was shown in their Annual Income statements. Which means, these gold miners still enjoyed positive free cash flow during this time.
NOTE: In order to consider some unwise capital expenditures during the years when the gold price really surged, I subtracted from each company, their lowest negative free cash flow that year. Actually, this was about $5 billion when we add them both up. So, in all reality, the free cash flow of $5 billion (half of the $10 billion shown in the chart above) means that Barrick & Newmont only enjoyed a 2%+ free cash flow margin compared to their total revenues.
Regardless, the gold market price was still higher than Barrick and Newmont’s small free cash flow margin to total revenue. Of course, if we include stock dilution as well as dividend payouts, these two gold miners would have an even higher production cost. But, that would still not change the overall production cost all that much.
As I have stated in many interviews and articles, the Fed and Central Banks CANNOT push the gold price wherever they see fit. The algorithms are electronically calculating the gold market price based on its cost of production. The only way the Fed and Central Banks can control the gold price is on its way UP. This is by using a massive amount of paper contracts to cap the gold price from moving up too high.
The majority of Fed and Central Bank intervention is controlling where investors put their money. By funneling the massive amount of money printing into STOCKS, BONDS and REAL ESTATE, 99% of investors (in the market) remain happy, as well as the governments. We must remember, local, state and the Federal Govt receive tax revenues are based on high stock, bond and real estate values. Once their values implode, so do government tax revenues. This would be a complete disaster.
Lastly, the present COMMODITY PRICING mechanism of gold will transition to its high quality STORE OF VALUE when the U.S. and Global Oil industry really starts to disintegrate. This gold value transition will be the first in history. Why? Because gold was still valued the same after the Roman Empire collapsed... due to the fact that it was based on human and animal labor.
Unfortunately, today the gold price is being based on the energy in oil. However, when the oil industry collapses, there is nothing to replace it. Thus, the value of most paper assets will plummet. Gold and silver will become stores of economic energy because the world was brainwashed into believing PAPER ASSETS will always retain their value... not so.