Data from the National Bureau of Statistics (NBS) showed that in May, the manufacturing PMI stood at 50.0%, down 0.3 percentage points MoM. The composite PMI output index was 50.5%, up 0.4 percentage points MoM, indicating that overall business production and operations in China remained in expansion. The non-manufacturing business activity index was 50.1%, up 0.7 percentage points MoM, with the non-manufacturing prosperity level rebounding.
China's PMI Performance in May 2026
I. China's Manufacturing PMI Performance
In May, the manufacturing PMI stood at 50.0%, down 0.3 percentage points MoM, sitting at the threshold level.
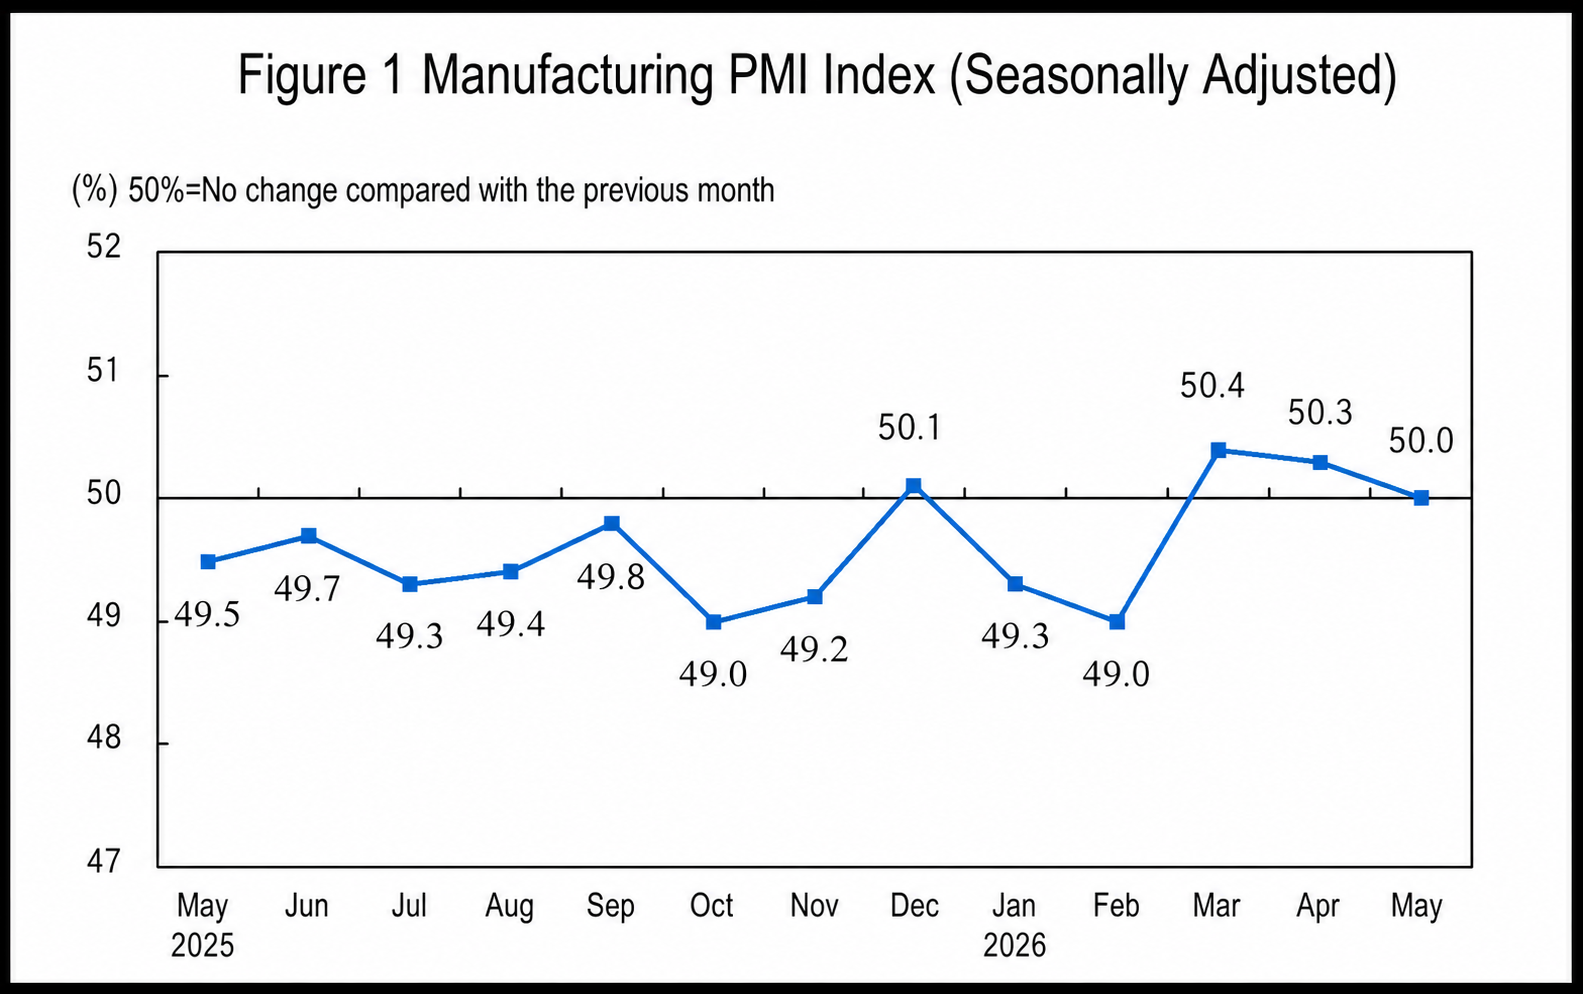
By enterprise size, the PMI for large enterprises was 51.1%, up 0.9 percentage points MoM, above the threshold; the PMIs for medium and small enterprises were 48.6% and 48.5% respectively, down 1.9 and 1.6 percentage points MoM, both below the threshold.
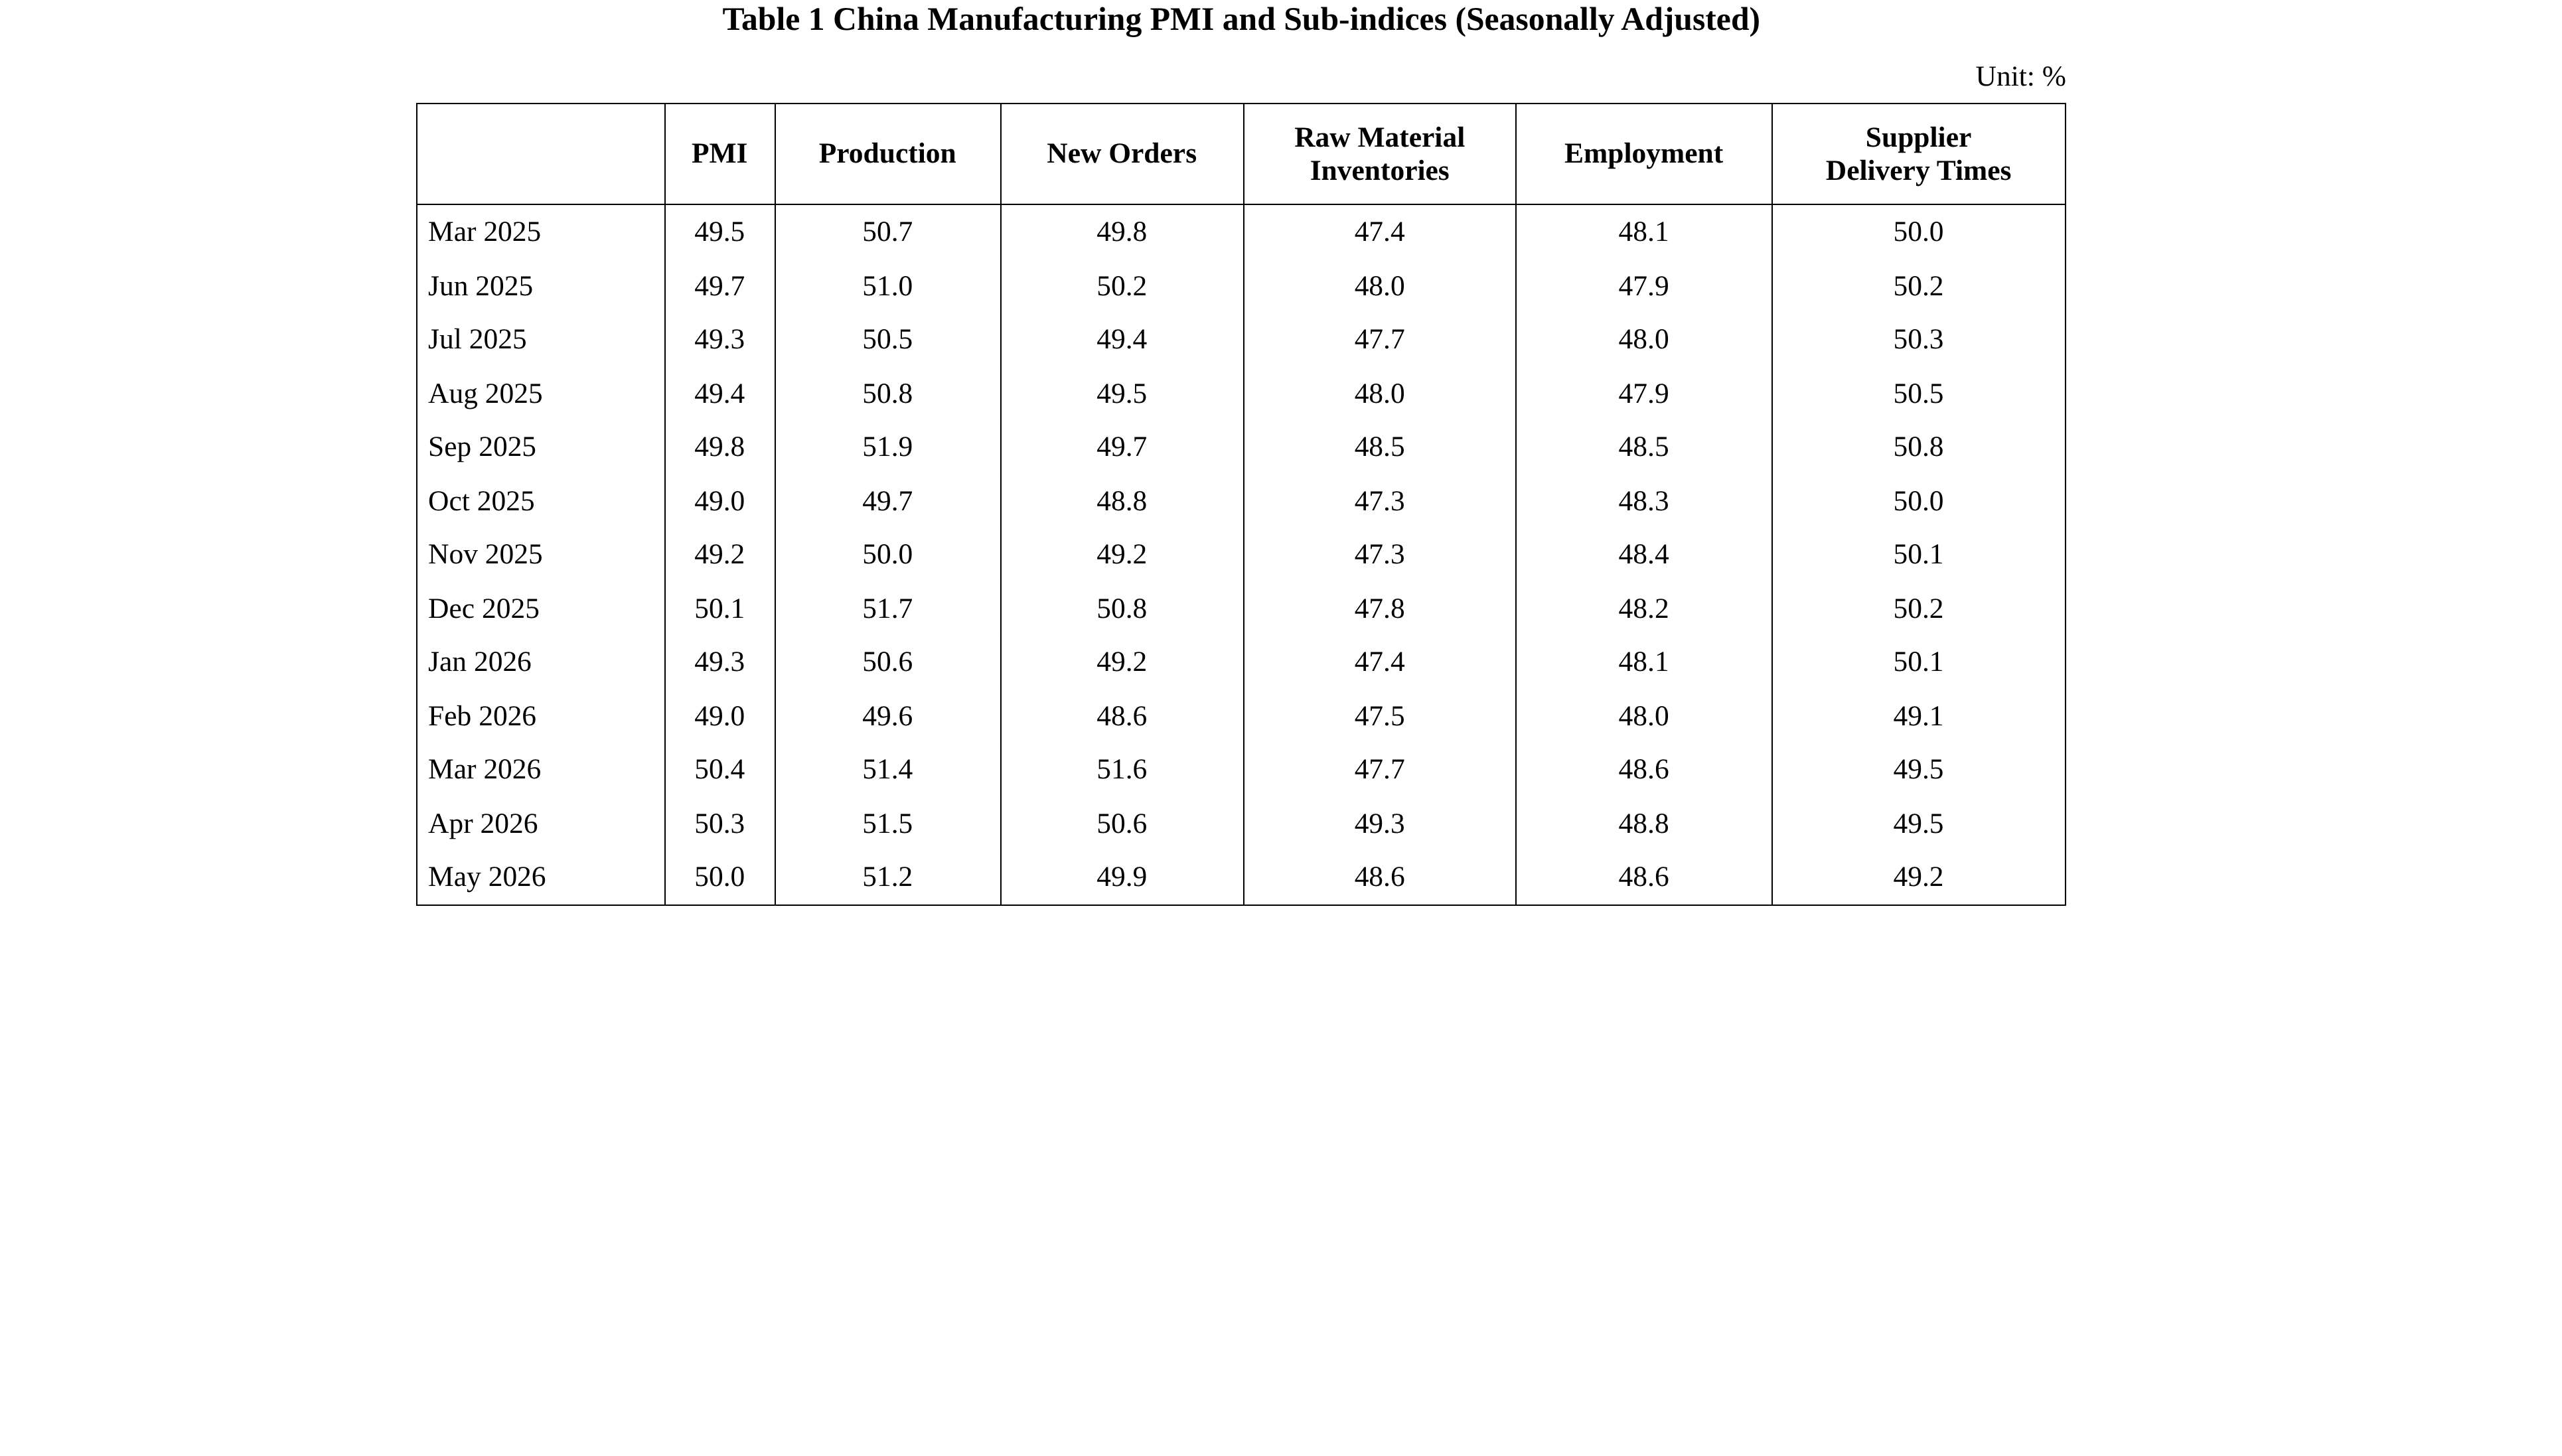
By sub-indices, among the five sub-indices constituting the manufacturing PMI, the production index was above the threshold, while the new orders index, raw material inventory index, employment index, and supplier delivery time index were all below the threshold.
The production index was 51.2%, down 0.3 percentage points MoM, but still above the threshold, indicating that manufacturing production activity remained in expansion.
The new orders index was 49.9%, down 0.7 percentage points MoM, indicating that the prosperity level of manufacturing market demand pulled back somewhat.
The raw material inventory index was 48.6%, down 0.7 percentage points MoM, indicating a decline in the inventory of major raw materials in manufacturing.
The employment index was 48.6%, down 0.2 percentage points MoM, indicating that the prosperity level of manufacturing employment pulled back somewhat.
The supplier delivery time index was 49.2%, down 0.3 percentage points MoM, indicating that the delivery time of manufacturing raw material suppliers continued to lengthen MoM.
II. China's Non-manufacturing PMI Performance
In May, the non-manufacturing business activity index was 50.1%, up 0.7 percentage points MoM, with the non-manufacturing prosperity level rebounding.
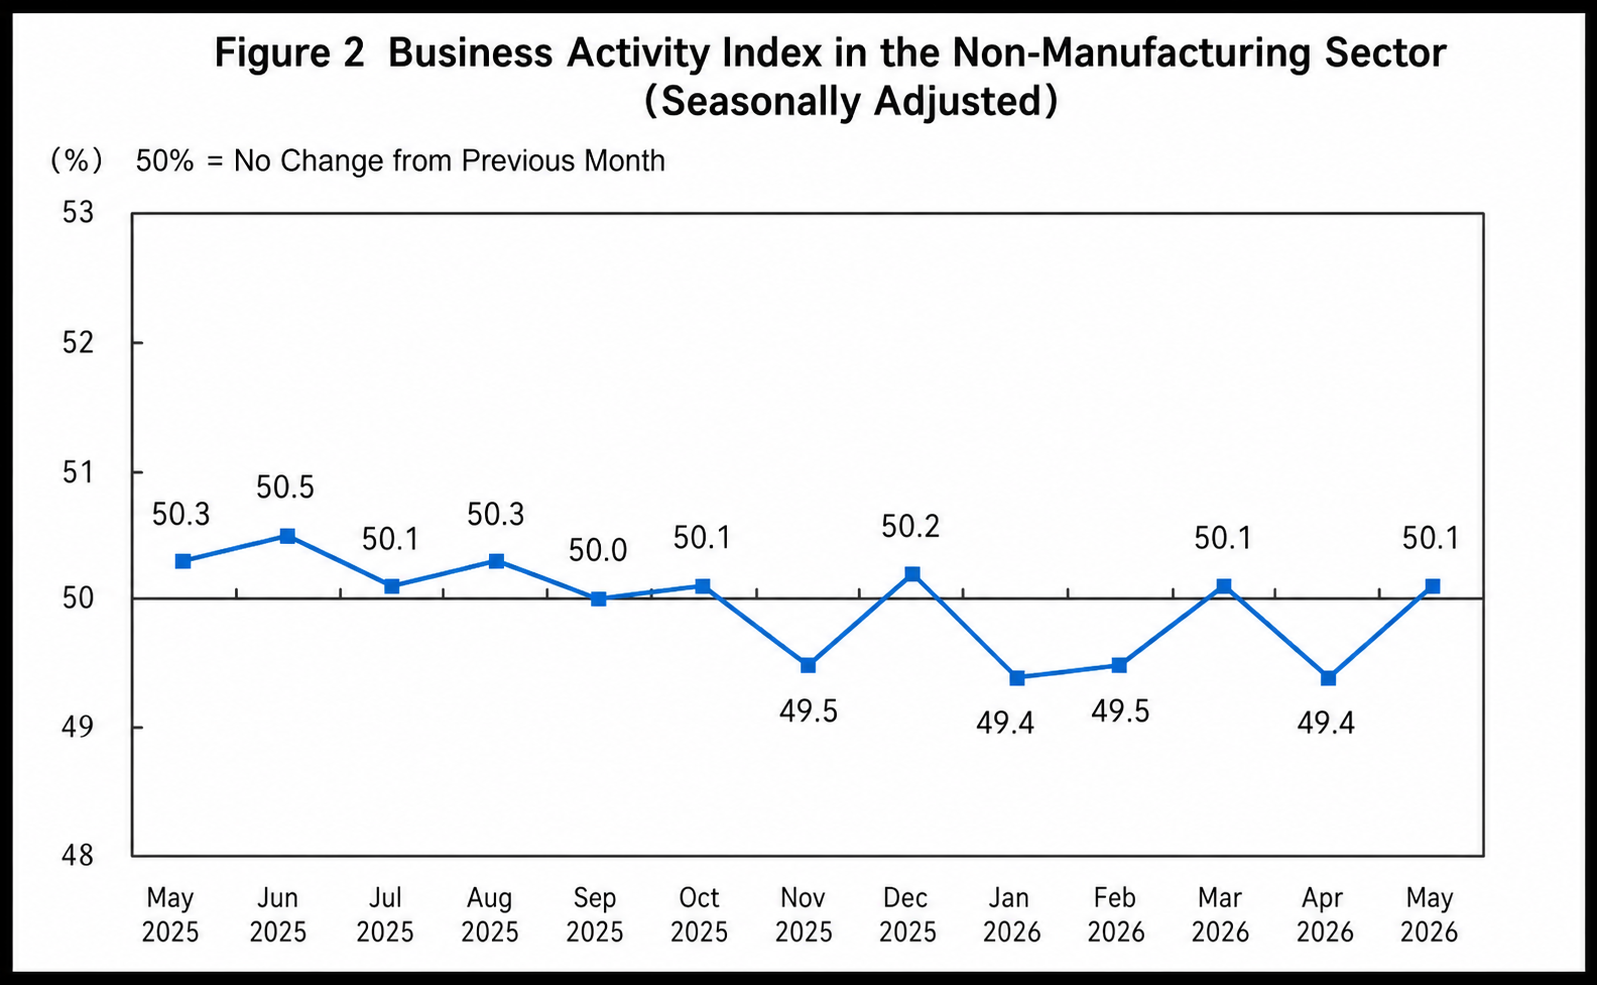
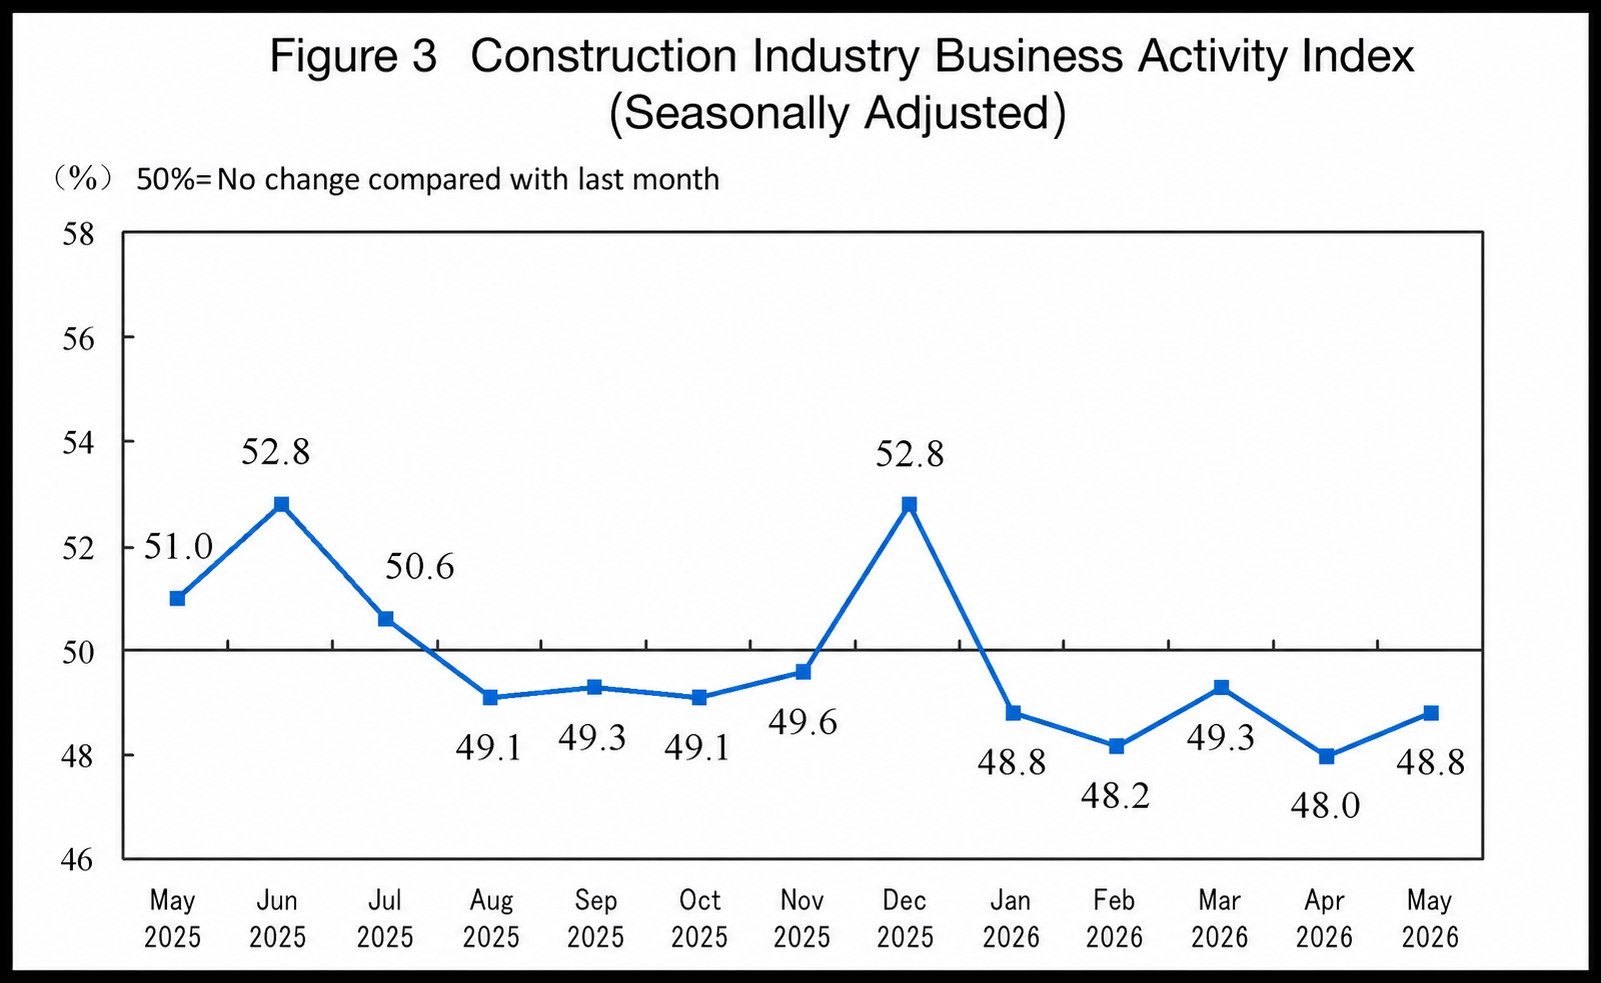
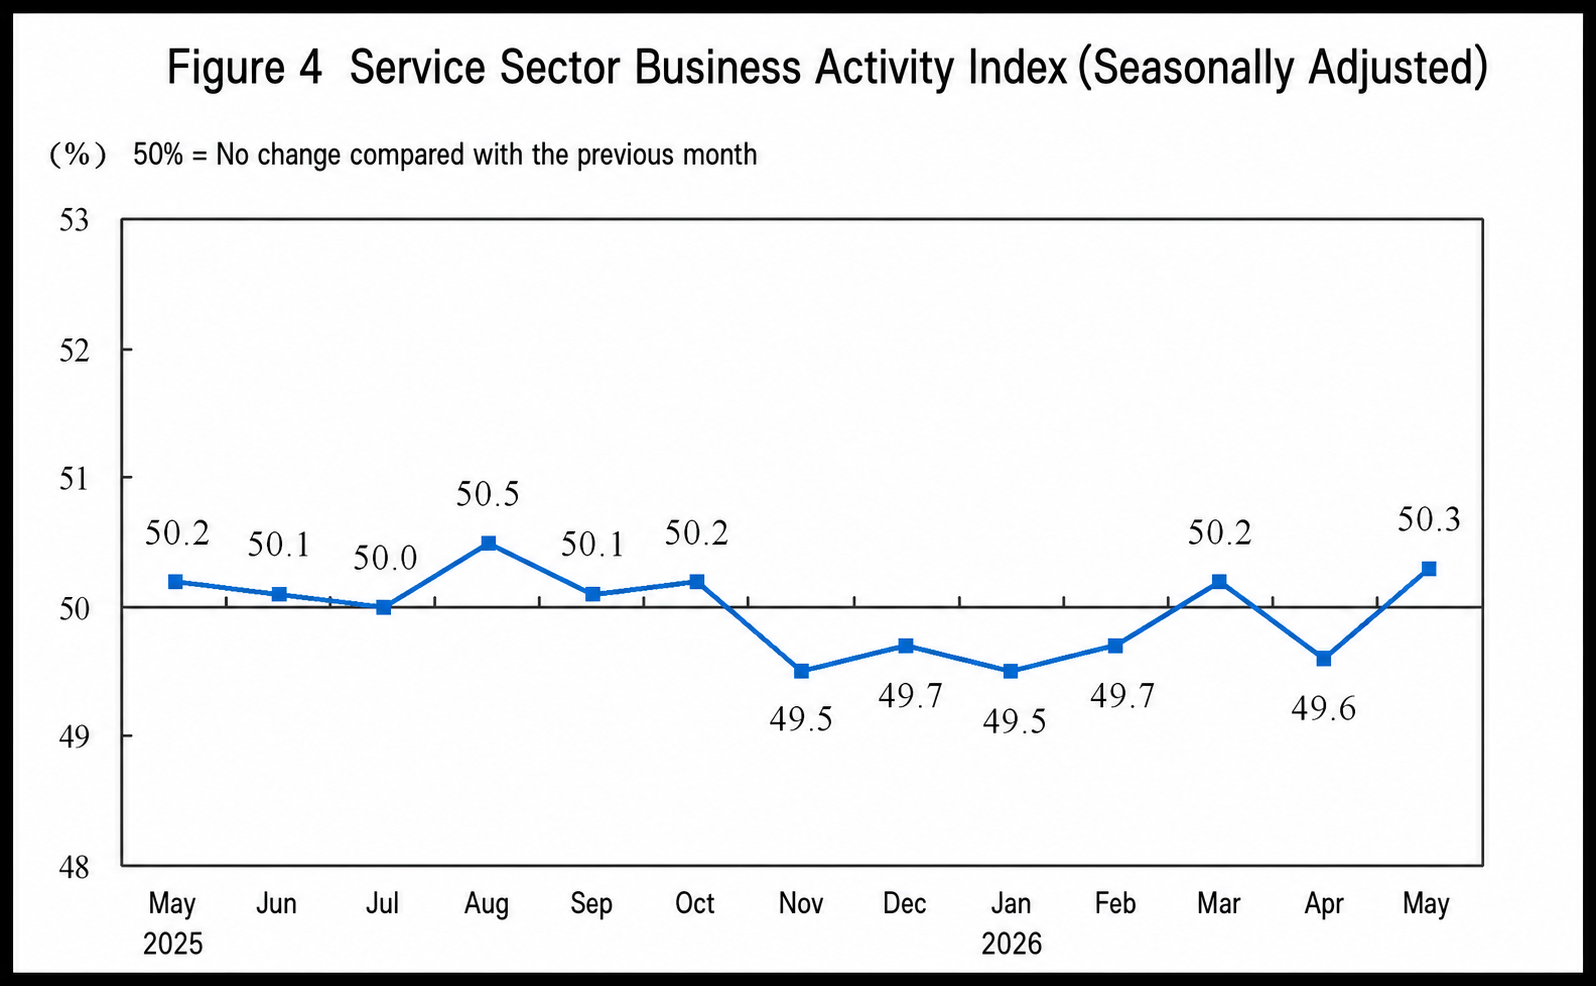
By sector, the construction business activity index was 48.8%, up 0.8 percentage points MoM; the services business activity index was 50.3%, up 0.7 percentage points MoM. Within the services sector, industries such as railway transportation, telecommunications, broadcasting, television and satellite transmission services, and insurance all had business activity indices in the relatively high prosperity range of above 55.0%; industries such as air transportation and real estate had business activity indices below the threshold.
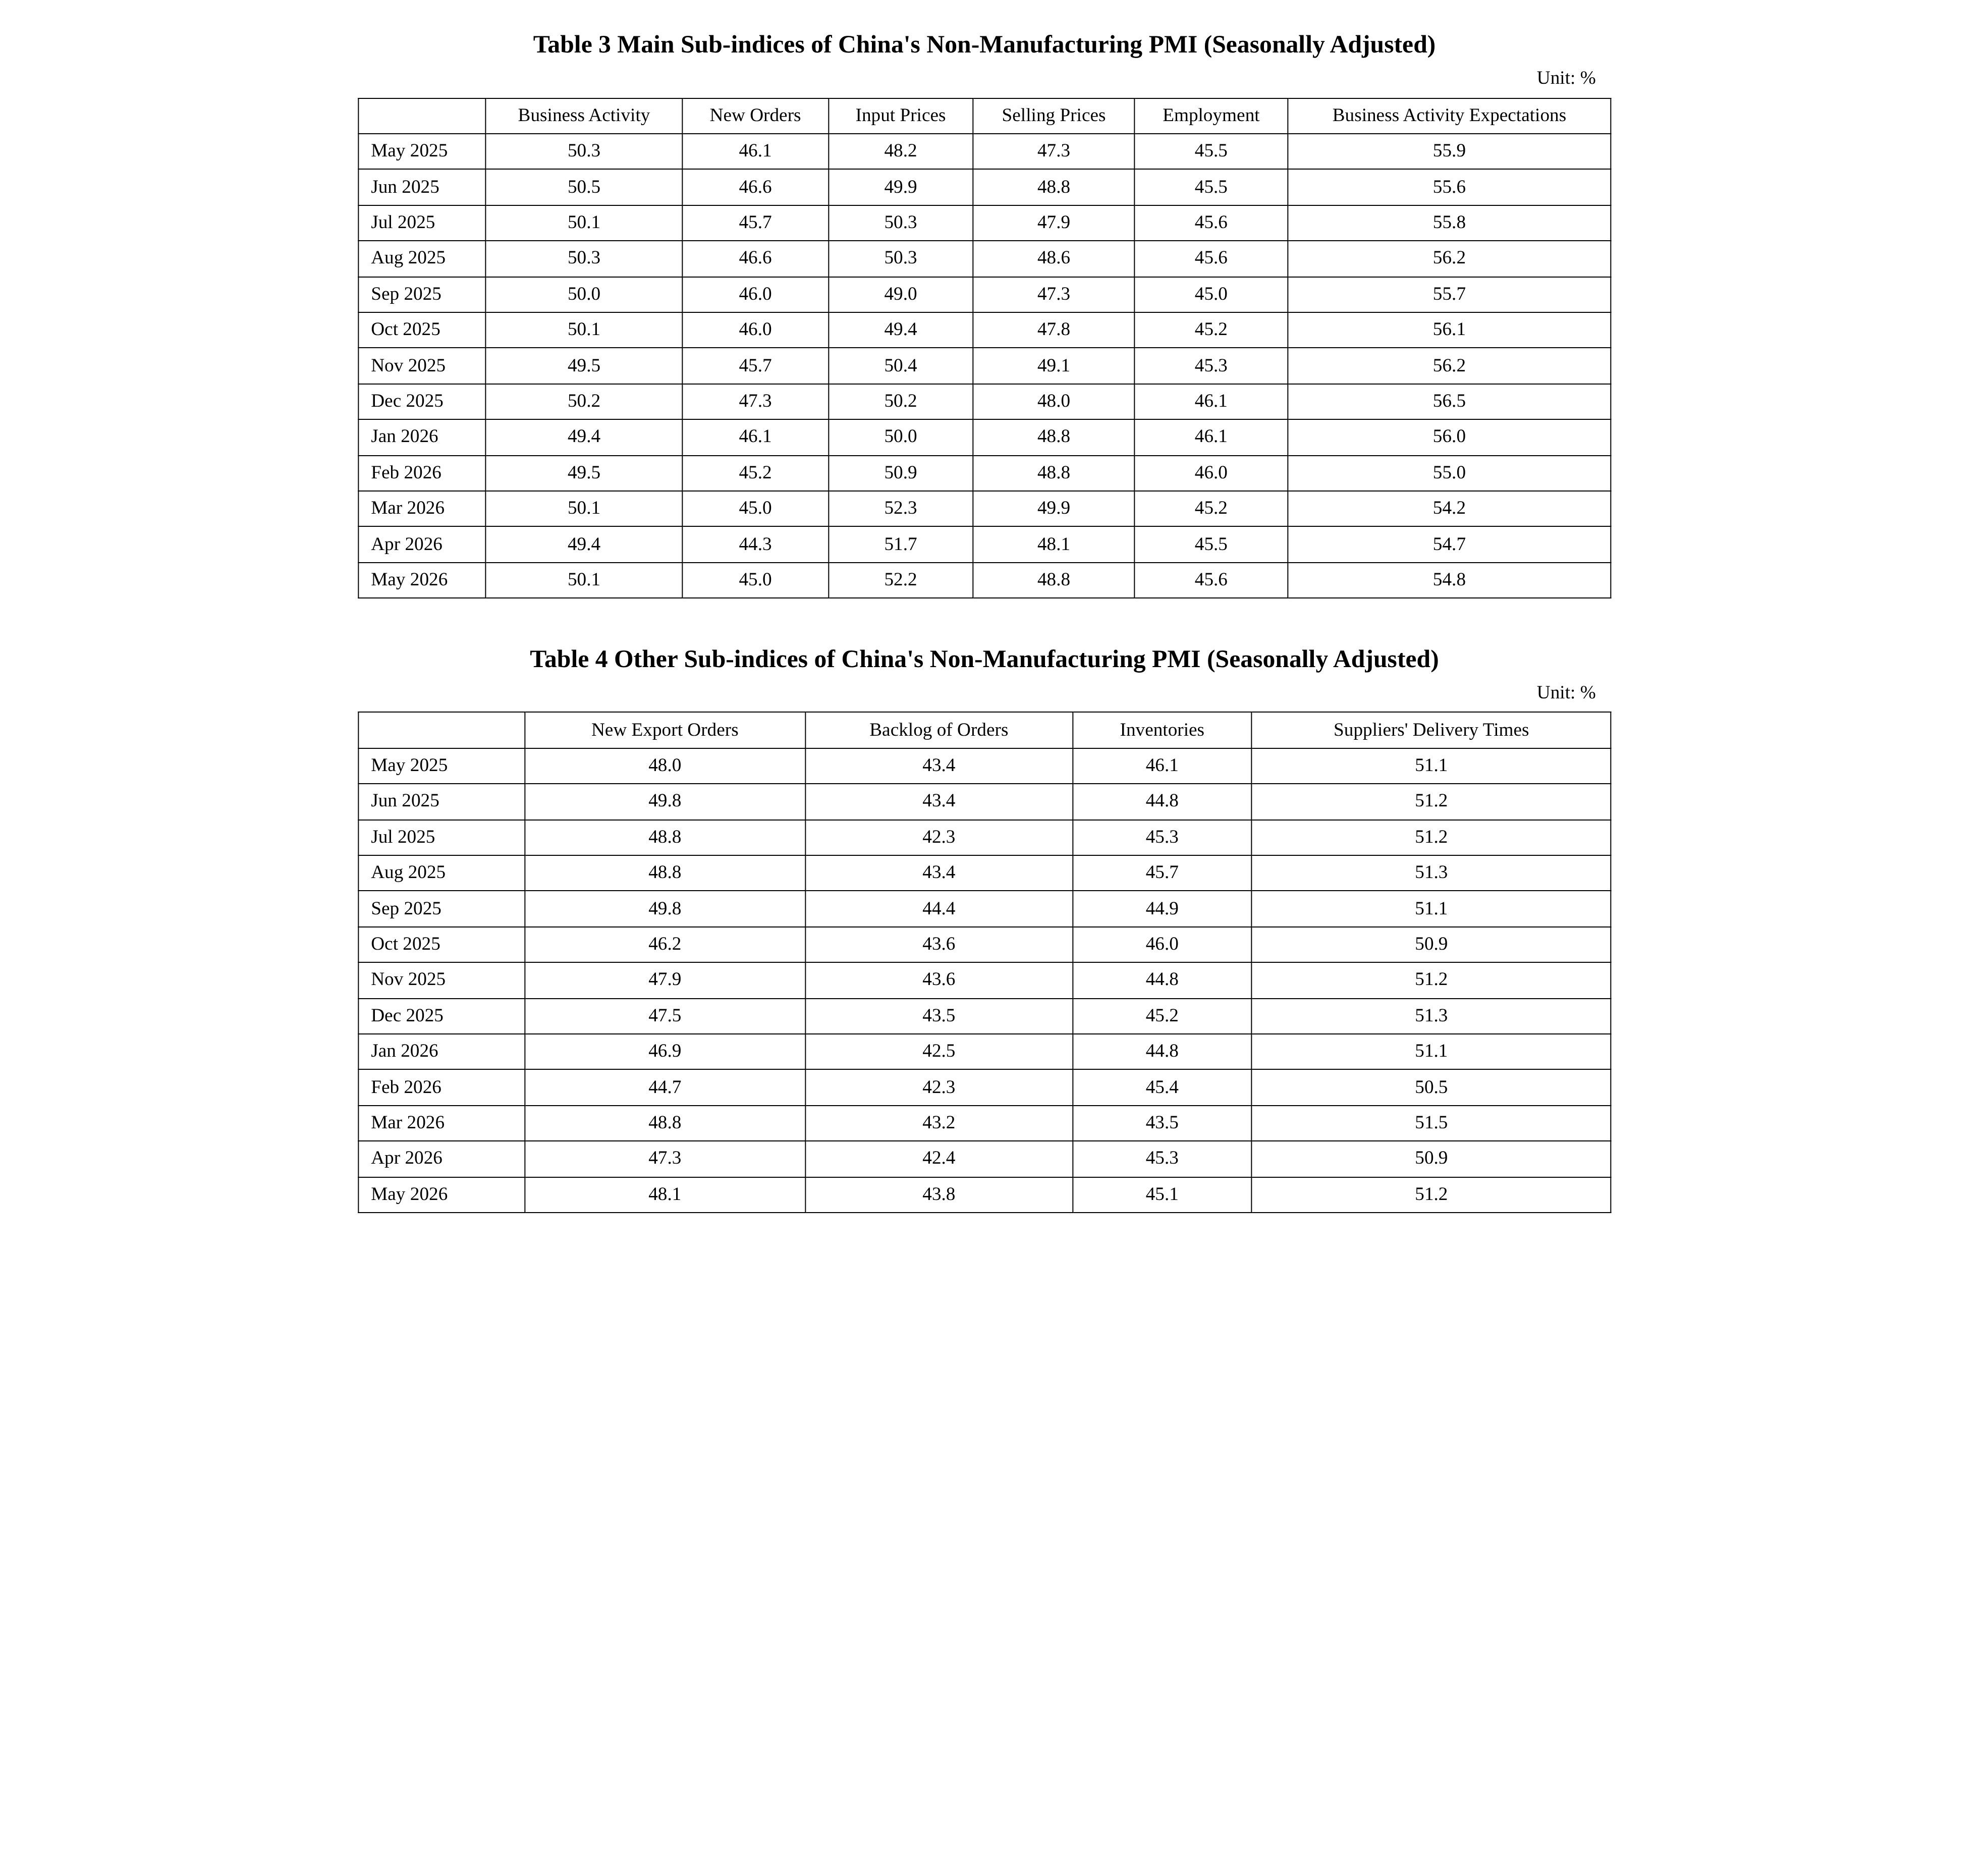
The new orders index was 45.0%, up 0.7 percentage points from the previous month, indicating that the non-manufacturing market demand improved. By sector, the construction new orders index was 43.5%, up 1.9 percentage points from the previous month; the services new orders index was 45.3%, up 0.5 percentage points from the previous month.
The input price index was 52.2%, up 0.5 percentage points from the previous month, indicating that the overall input prices for non-manufacturing business operations continued to rise. By sector, the construction input price index was 53.7%, down 1.2 percentage points from the previous month; the services input price index was 52.0%, up 0.8 percentage points from the previous month.
The selling price index was 48.8%, up 0.7 percentage points from the previous month, indicating that the decline in overall selling prices of non-manufacturing enterprises narrowed. By sector, the construction selling price index was 48.6%, down 0.4 percentage points from the previous month; the services selling price index was 48.9%, up 1 percentage point from the previous month.
The employment index was 45.6%, up 0.1 percentage points from the previous month, indicating that employment conditions in non-manufacturing enterprises improved slightly. By sector, the construction employment index was 41.4%, up 1.8 percentage points from the previous month; the services employment index was 46.4%, down 0.1 percentage points from the previous month.
The business activity expectations index was 54.8%, up 0.1 percentage points from the previous month, indicating that non-manufacturing enterprises' confidence in market development strengthened. By sector, the construction business activity expectations index was 51.5%, up 1 percentage point from the previous month; the services business activity expectations index was 55.4%, unchanged from the previous month.
III. China Composite PMI Output Index
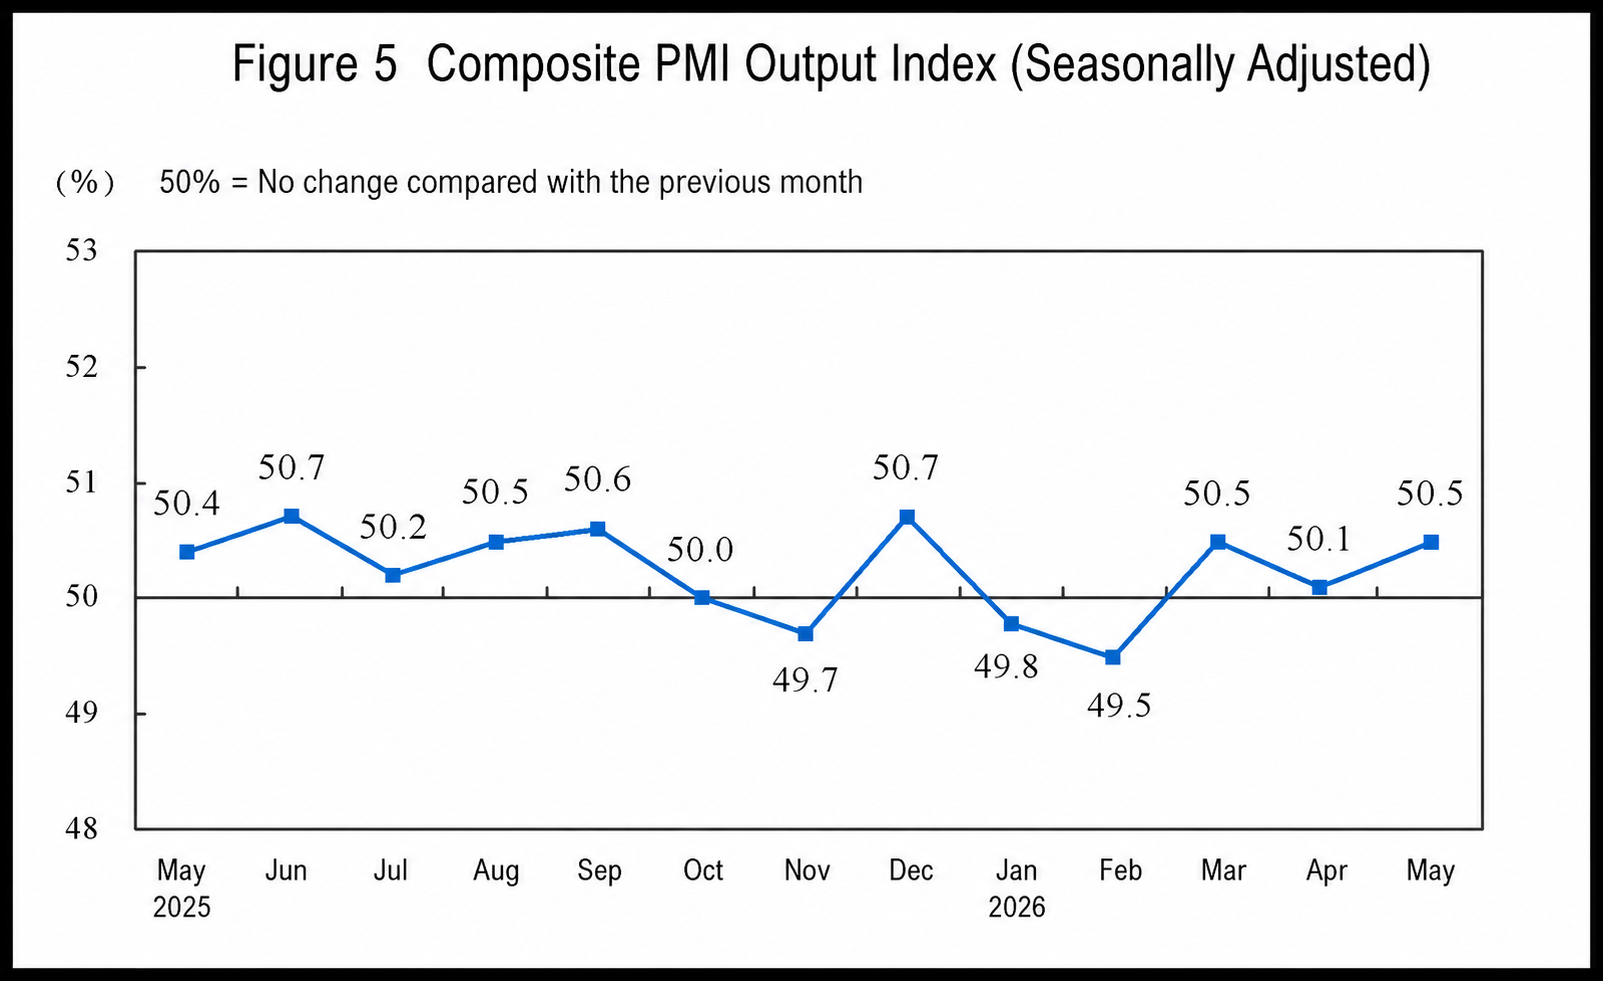
In May, the composite PMI output index was 50.5%, up 0.4 percentage points from the previous month, indicating that China's overall enterprise production and business activities remained in expansion.
Composite PMI Output Index Remained in Expansion in May
— Interpretation of China's PMI for May 2026 by Huo Lihui, Chief Statistician of the Service Industry Survey Center, National Bureau of Statistics (NBS)
On May 31, 2026, the Service Industry Survey Center of the NBS and the China Federation of Logistics and Purchasing released China's PMI. Huo Lihui, Chief Statistician of the Service Industry Survey Center of the NBS, provided an interpretation of the data.
In May, the manufacturing PMI was 50.0%, down 0.3 percentage points from the previous month; the non-manufacturing business activity index and the composite PMI output index were 50.1% and 50.5% respectively, up 0.7 and 0.4 percentage points from the previous month. China's overall economic output remained in expansion.
I. Manufacturing PMI at the Threshold
In May, the manufacturing PMI stood at 50.0%, indicating that overall business production and operations remained stable.
(i) Enterprise production maintained expansion. The production index was 51.2%, above the threshold, as manufacturing production activities continued to expand; the new orders index was 49.9%, suggesting that market demand somewhat slowed down. By sector, the production and new orders indices for industries such as pharmaceuticals, railway, shipbuilding, aerospace equipment, and computer, communications, and electronic equipment were all above 53.0%, with both production and demand sides of these industries remaining relatively active; the two indices for industries such as petroleum, coal, and other fuel processing, chemical fibers, rubber and plastic products, and non-metallic mineral products remained below the threshold, with both supply and demand sides still showing insufficiency.
(ii) New momentum continued to develop favorably. The PMIs for high-tech manufacturing and equipment manufacturing were 52.9% and 52.1%, respectively, up 0.7 and 0.3 percentage points from the previous month, both remaining consistently above the threshold. In particular, the PMI for high-tech manufacturing had stayed in expansion territory for 16 consecutive months, with related industries maintaining strong growth and the leading role of new momentum continuing to emerge; the PMIs for consumer goods industries and high energy-consuming industries were 49.7% and 47.1%, respectively, down 1 and 0.8 percentage points from the previous month, with market activity somewhat weakening.
(iii) Large enterprise PMI remained consistently above the threshold. The PMI for large enterprises was 51.1%, up 0.9 percentage points from the previous month, staying in expansion territory throughout the year, as large enterprises sustained a favorable production and operation trend; the PMIs for medium and small enterprises were 48.6% and 48.5%, respectively, with business conditions pulling back.
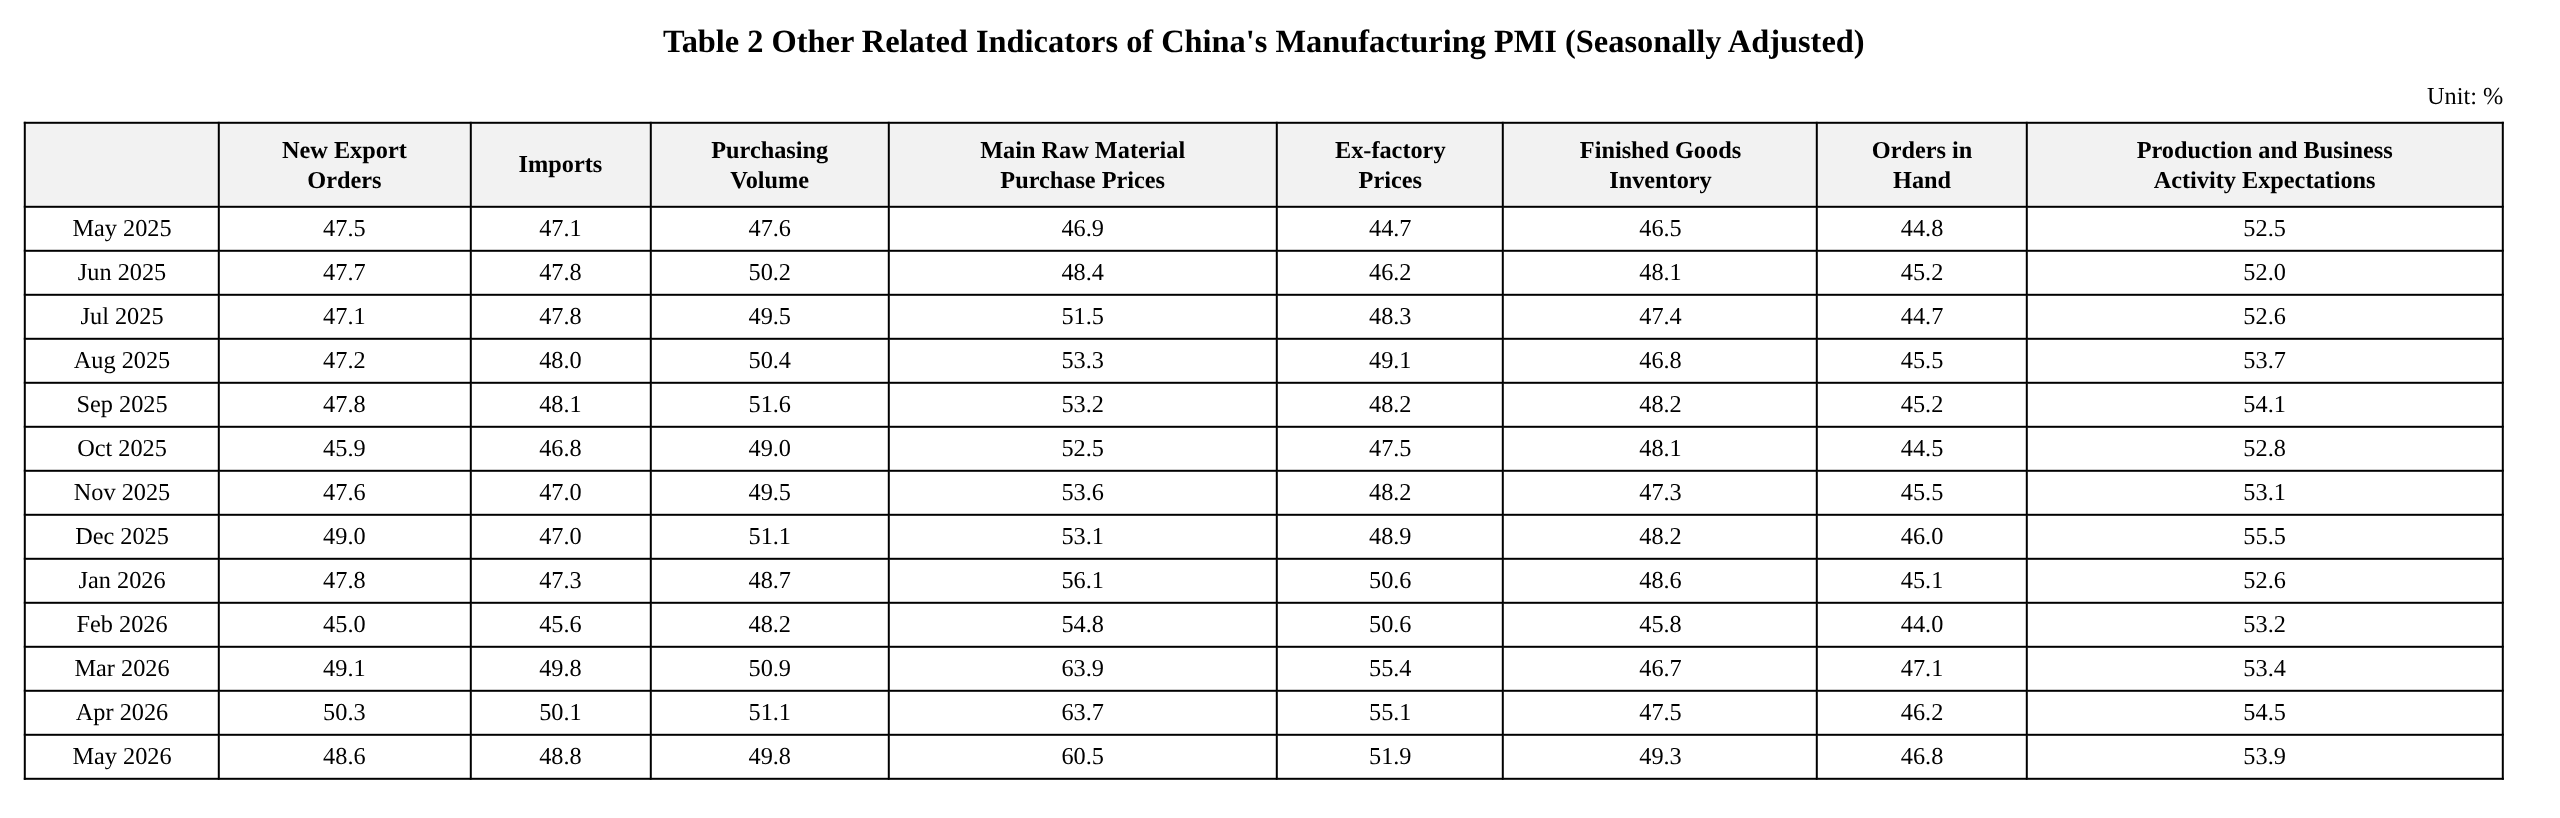
(iv) Price indices fluctuated at high levels. The raw material purchase price index and the ex-factory price index were 60.5% and 51.9%, respectively, both pulling back 3.2 percentage points from the previous month but remaining at relatively high levels in recent periods. Both indices stayed in expansion territory for five consecutive months, as overall market price levels in manufacturing continued to rise. By sector, the two price indices for industries such as textiles, chemical fibers, rubber and plastic products, and ferrous metals smelting and rolling processing remained above 55.0% for three consecutive months, with overall purchase and sales price levels in related industries continuing to rise.
II. Non-manufacturing Business Activity Index Rose above the Threshold
In May, the non-manufacturing business activity index was 50.1%, up 0.7 percentage points from the previous month, as the non-manufacturing business conditions rebounded.
(i) The services business activity index rose into expansion territory. The services business activity index was 50.3%, up 0.7 percentage points from the previous month, with market activity in the services sector somewhat improving. By industry, the business activity indices for industries such as railway transportation, telecommunications, radio, television and satellite transmission services, and insurance were all above the relatively high prosperity range of 55.0%, with rapid growth in total business volume; the business activity indices for industries such as air transportation and real estate were below the critical point, indicating relatively low prosperity levels in these industries. In terms of market expectations, the service sector business activity expectations index was 55.4%, remaining in the relatively high prosperity range, indicating that most service sector enterprises held generally optimistic expectations for near-term market development.
(2) The construction sector business activity index rebounded. The construction sector business activity index was 48.8%, up 0.8 percentage points from the previous month, with improved prosperity levels. In terms of market expectations, the construction sector business activity expectations index was 51.5%, up 1 percentage point from the previous month, indicating that construction enterprises' confidence in future industry development recovered somewhat.
3. Composite PMI Output Index Continued to Expand
In May, the composite PMI output index was 50.5%, up 0.4 percentage points from the previous month, indicating that China's enterprise production and business activities generally maintained expansion. The manufacturing production index and non-manufacturing business activity index, which constitute the composite PMI output index, were 51.2% and 50.1%, respectively.
![Crude Oil Posted Largest Monthly Decline in Nearly Five Years, Metals Showed Mixed Performance, Gold Fell for Three Consecutive Months, Silver Rose on Monthly Basis [Overnight Market]](https://imgqn.smm.cn/usercenter/nQsOk20251217171736.jpg)
![[SMM Flash News] Vulcan Energy Achieves Financial Close for €2.2B Lionheart Lithium Project](https://imgqn.smm.cn/usercenter/tSwaX20251217171735.jpg)
![[SMM Flash News] Sandvik Mining Achieves ISO/IEC 27001 Certification for Global IT Operations](https://imgqn.smm.cn/usercenter/fNuSg20251217171735.jpg)