Data from the NBS showed that in March, raw coal production by above-designated-scale industrial enterprises totaled 440 million mt, flat YoY, with daily average production of 14.21 million mt. In January–March, raw coal production by above-designated-scale industrial enterprises totaled 1.2 billion mt, up 0.1% YoY. In March, crude oil production by above-designated-scale industrial enterprises totaled 19.07 million mt, up 0.2% YoY, with daily average production of 615,000 mt. In January–March, crude oil production by above-designated-scale industrial enterprises totaled 54.8 million mt, up 1.3% YoY. In March, crude oil processing volume by above-designated-scale industrial enterprises totaled 61.67 million mt, down 2.2% YoY, with daily average processing of 1.989 million mt. In January–March, crude oil processed by above-designated-scale industrial enterprises totaled 184.31 million mt, up 1.1% YoY.
Energy Production in March 2026
In March, raw coal production by above-designated-scale industrial enterprises (hereinafter referred to as above-designated-scale industries) remained stable, crude oil production maintained growth, natural gas production growth accelerated, and power generation grew steadily.
I. Raw Coal, Crude Oil, and Natural Gas Production and Related Information
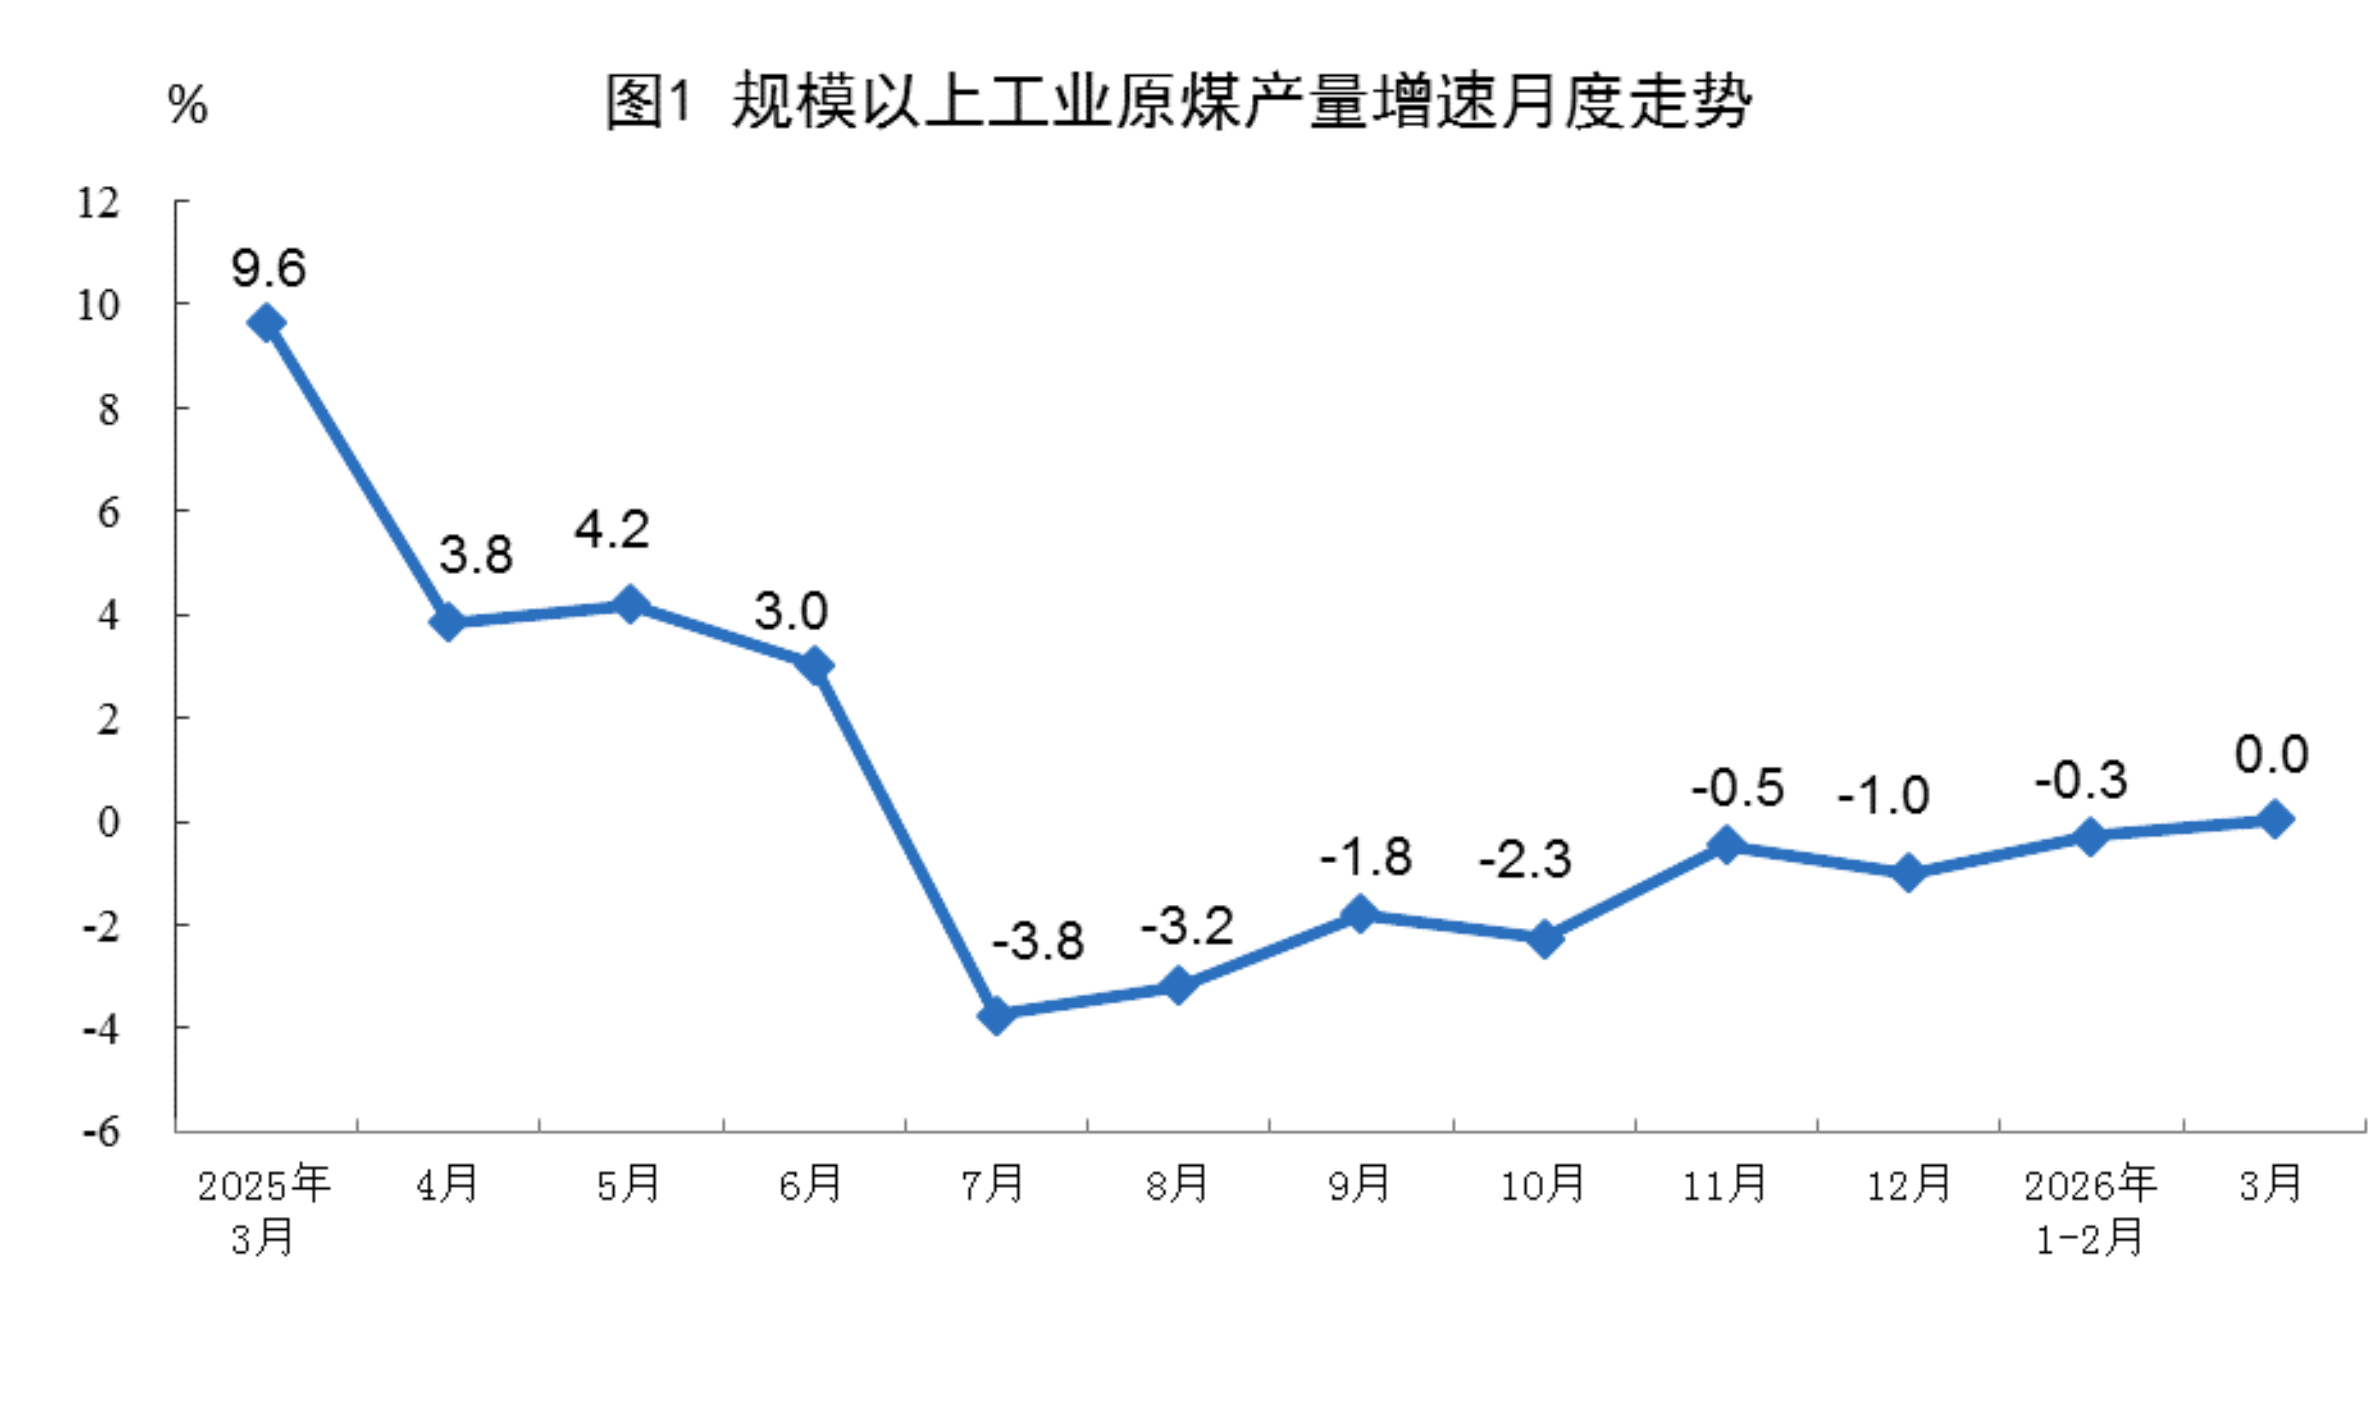
Raw coal production remained stable. In March, raw coal production by above-designated-scale industries totaled 440 million mt, flat YoY, with daily average production of 14.21 million mt.
In January–March, raw coal production by above-designated-scale industries totaled 1.2 billion mt, up 0.1% YoY.
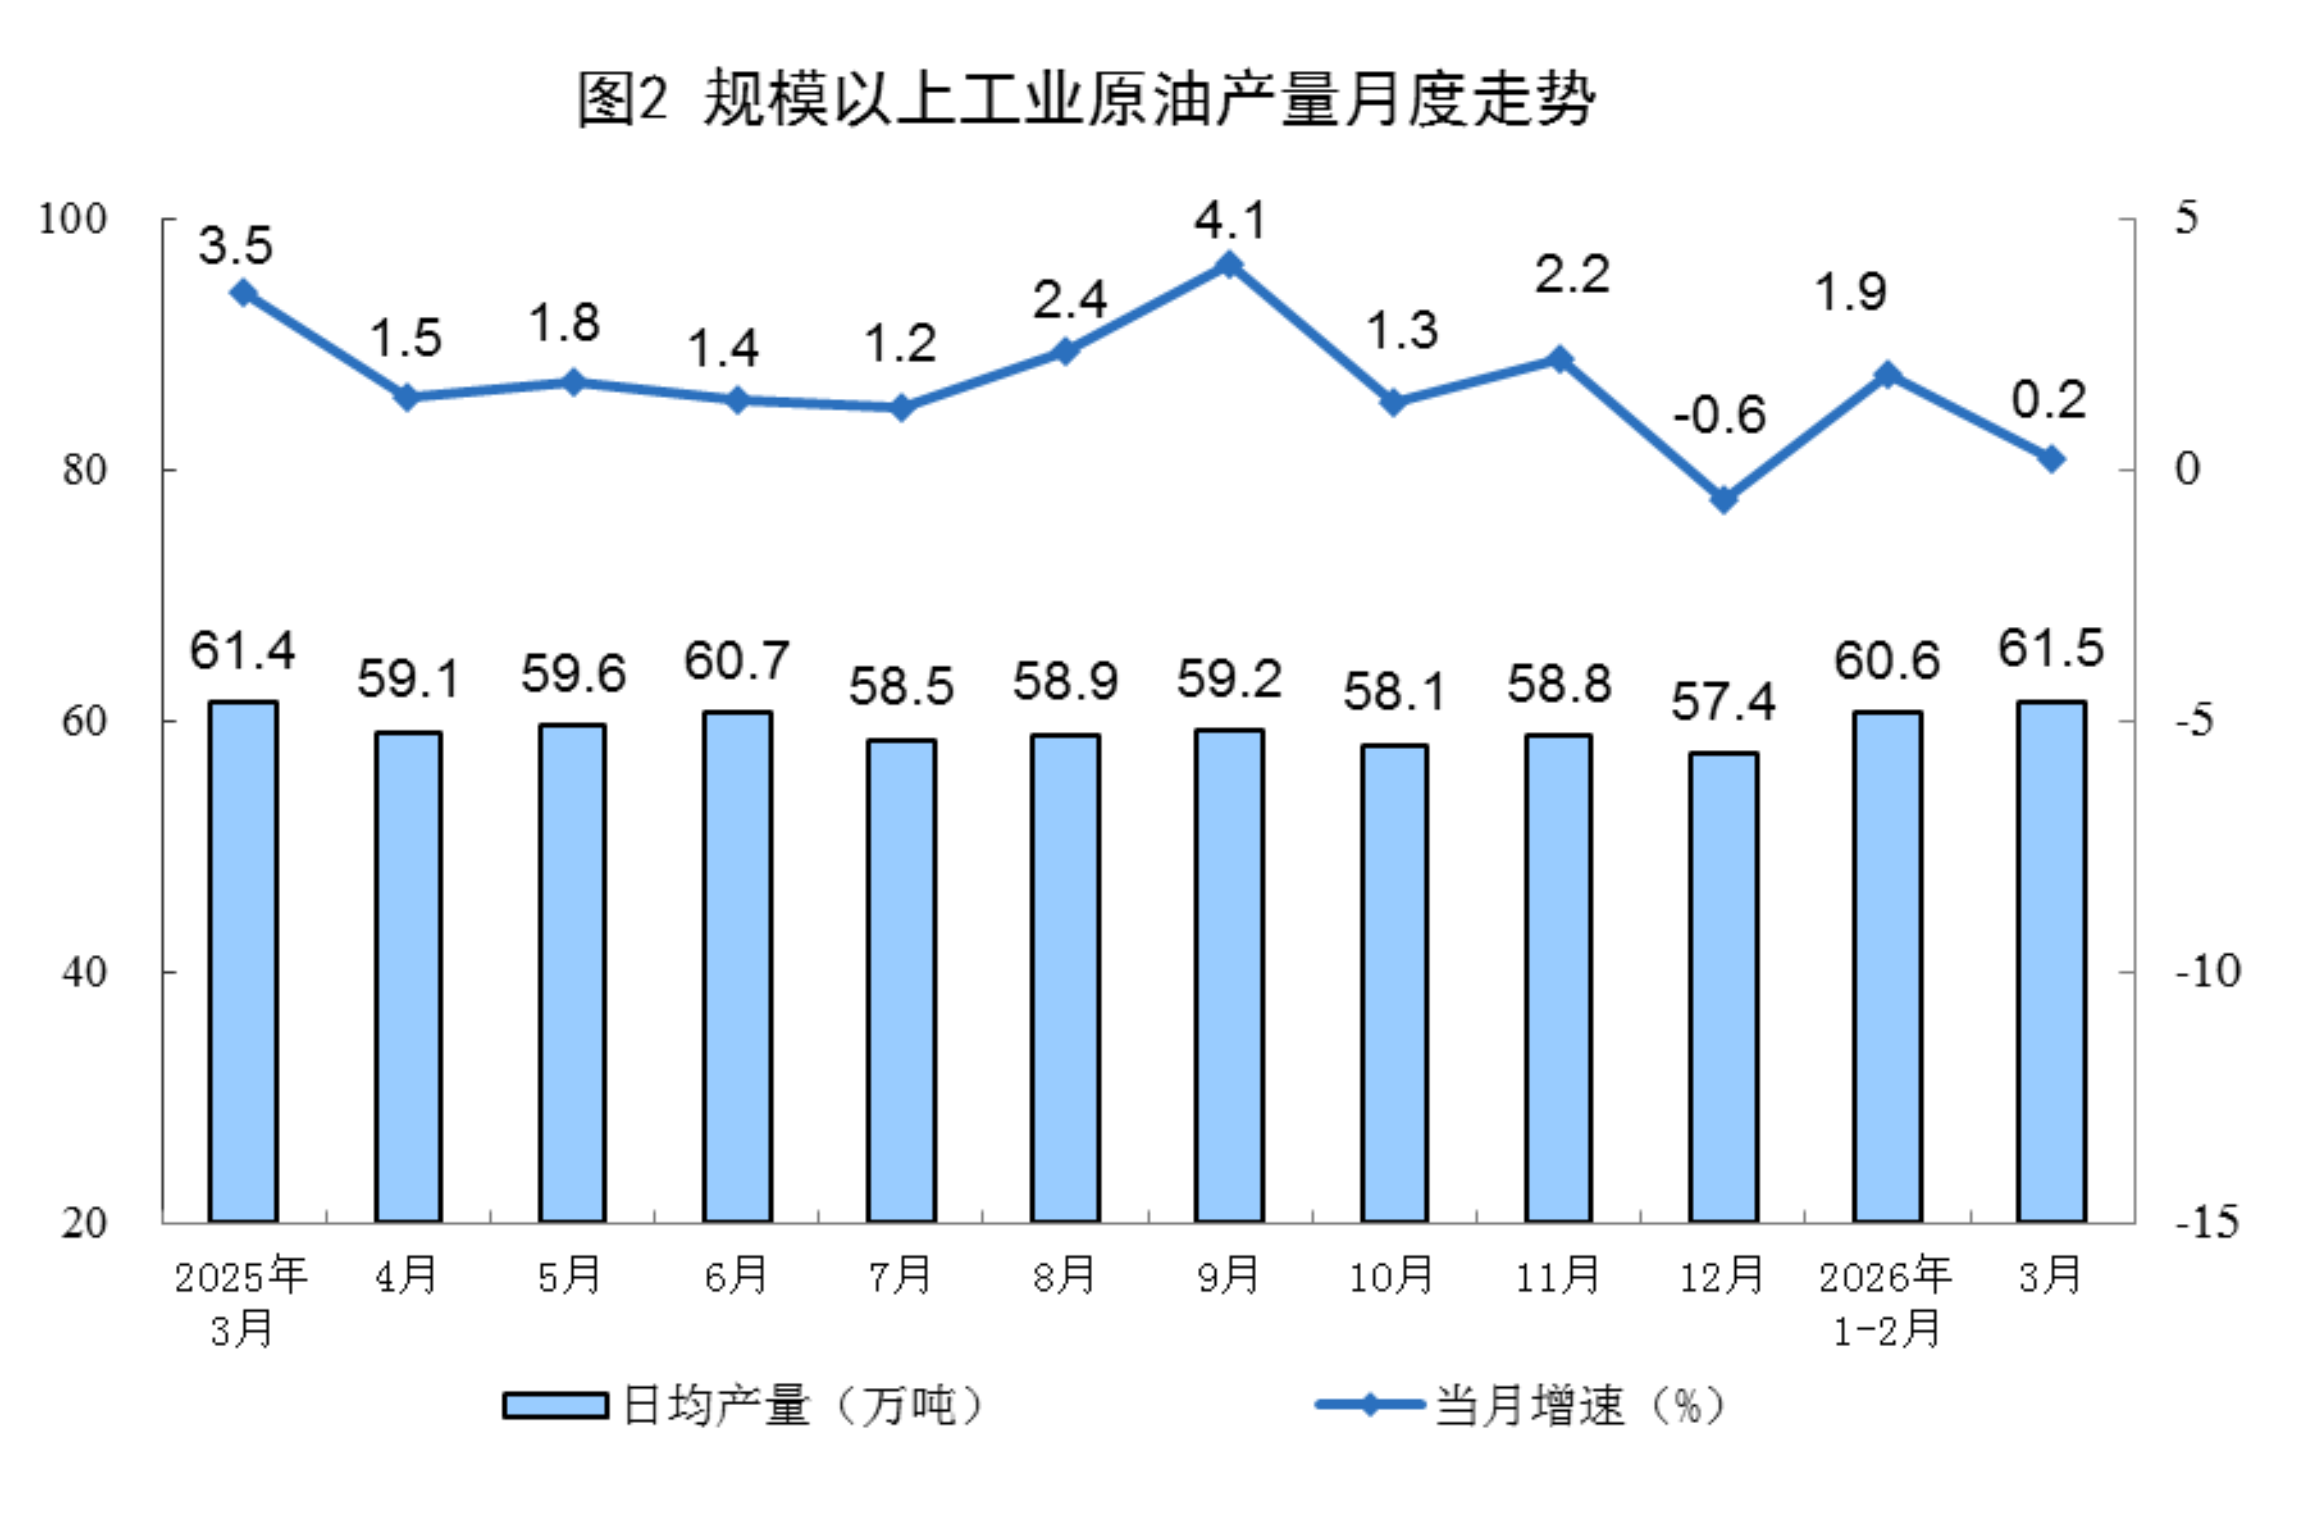
Crude oil production maintained growth. In March, crude oil production by above-designated-scale industries totaled 19.07 million mt, up 0.2% YoY, with daily average production of 615,000 mt.
In January–March, crude oil production by above-designated-scale industries totaled 54.8 million mt, up 1.3% YoY.
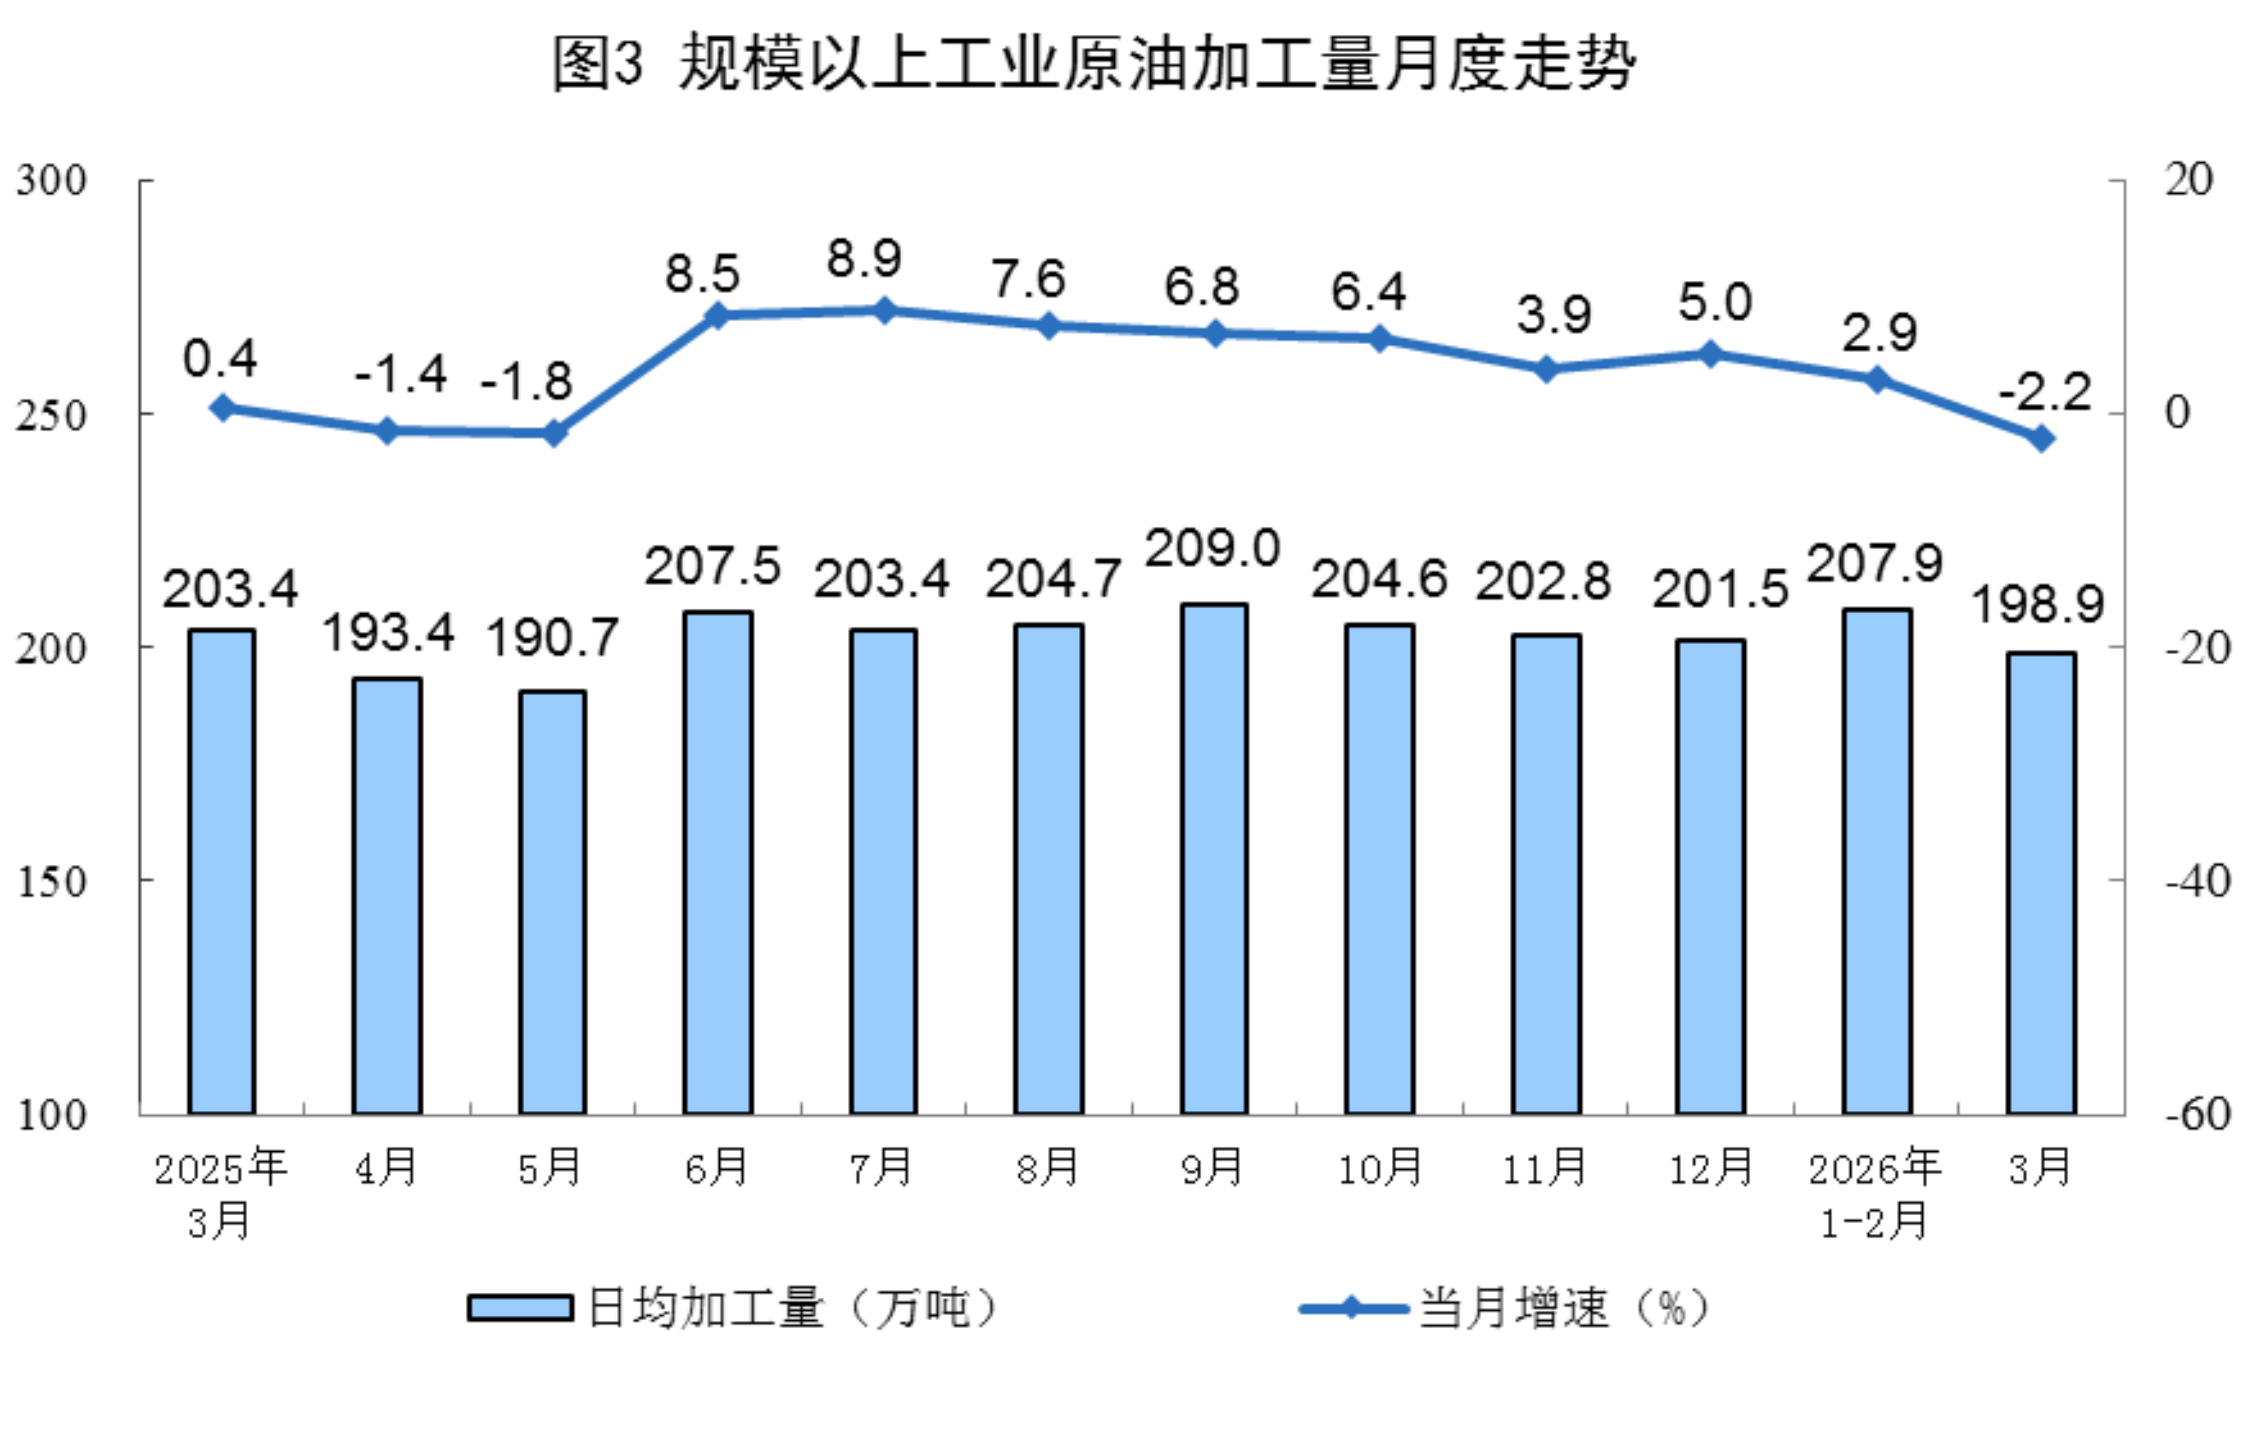
Crude oil processing shifted from growth to decline. In March, crude oil processing volume by above-designated-scale industries totaled 61.67 million mt, down 2.2% YoY, with daily average processing of 1.989 million mt.
In January–March, crude oil processed by above-designated-scale industries totaled 184.31 million mt, up 1.1% YoY.
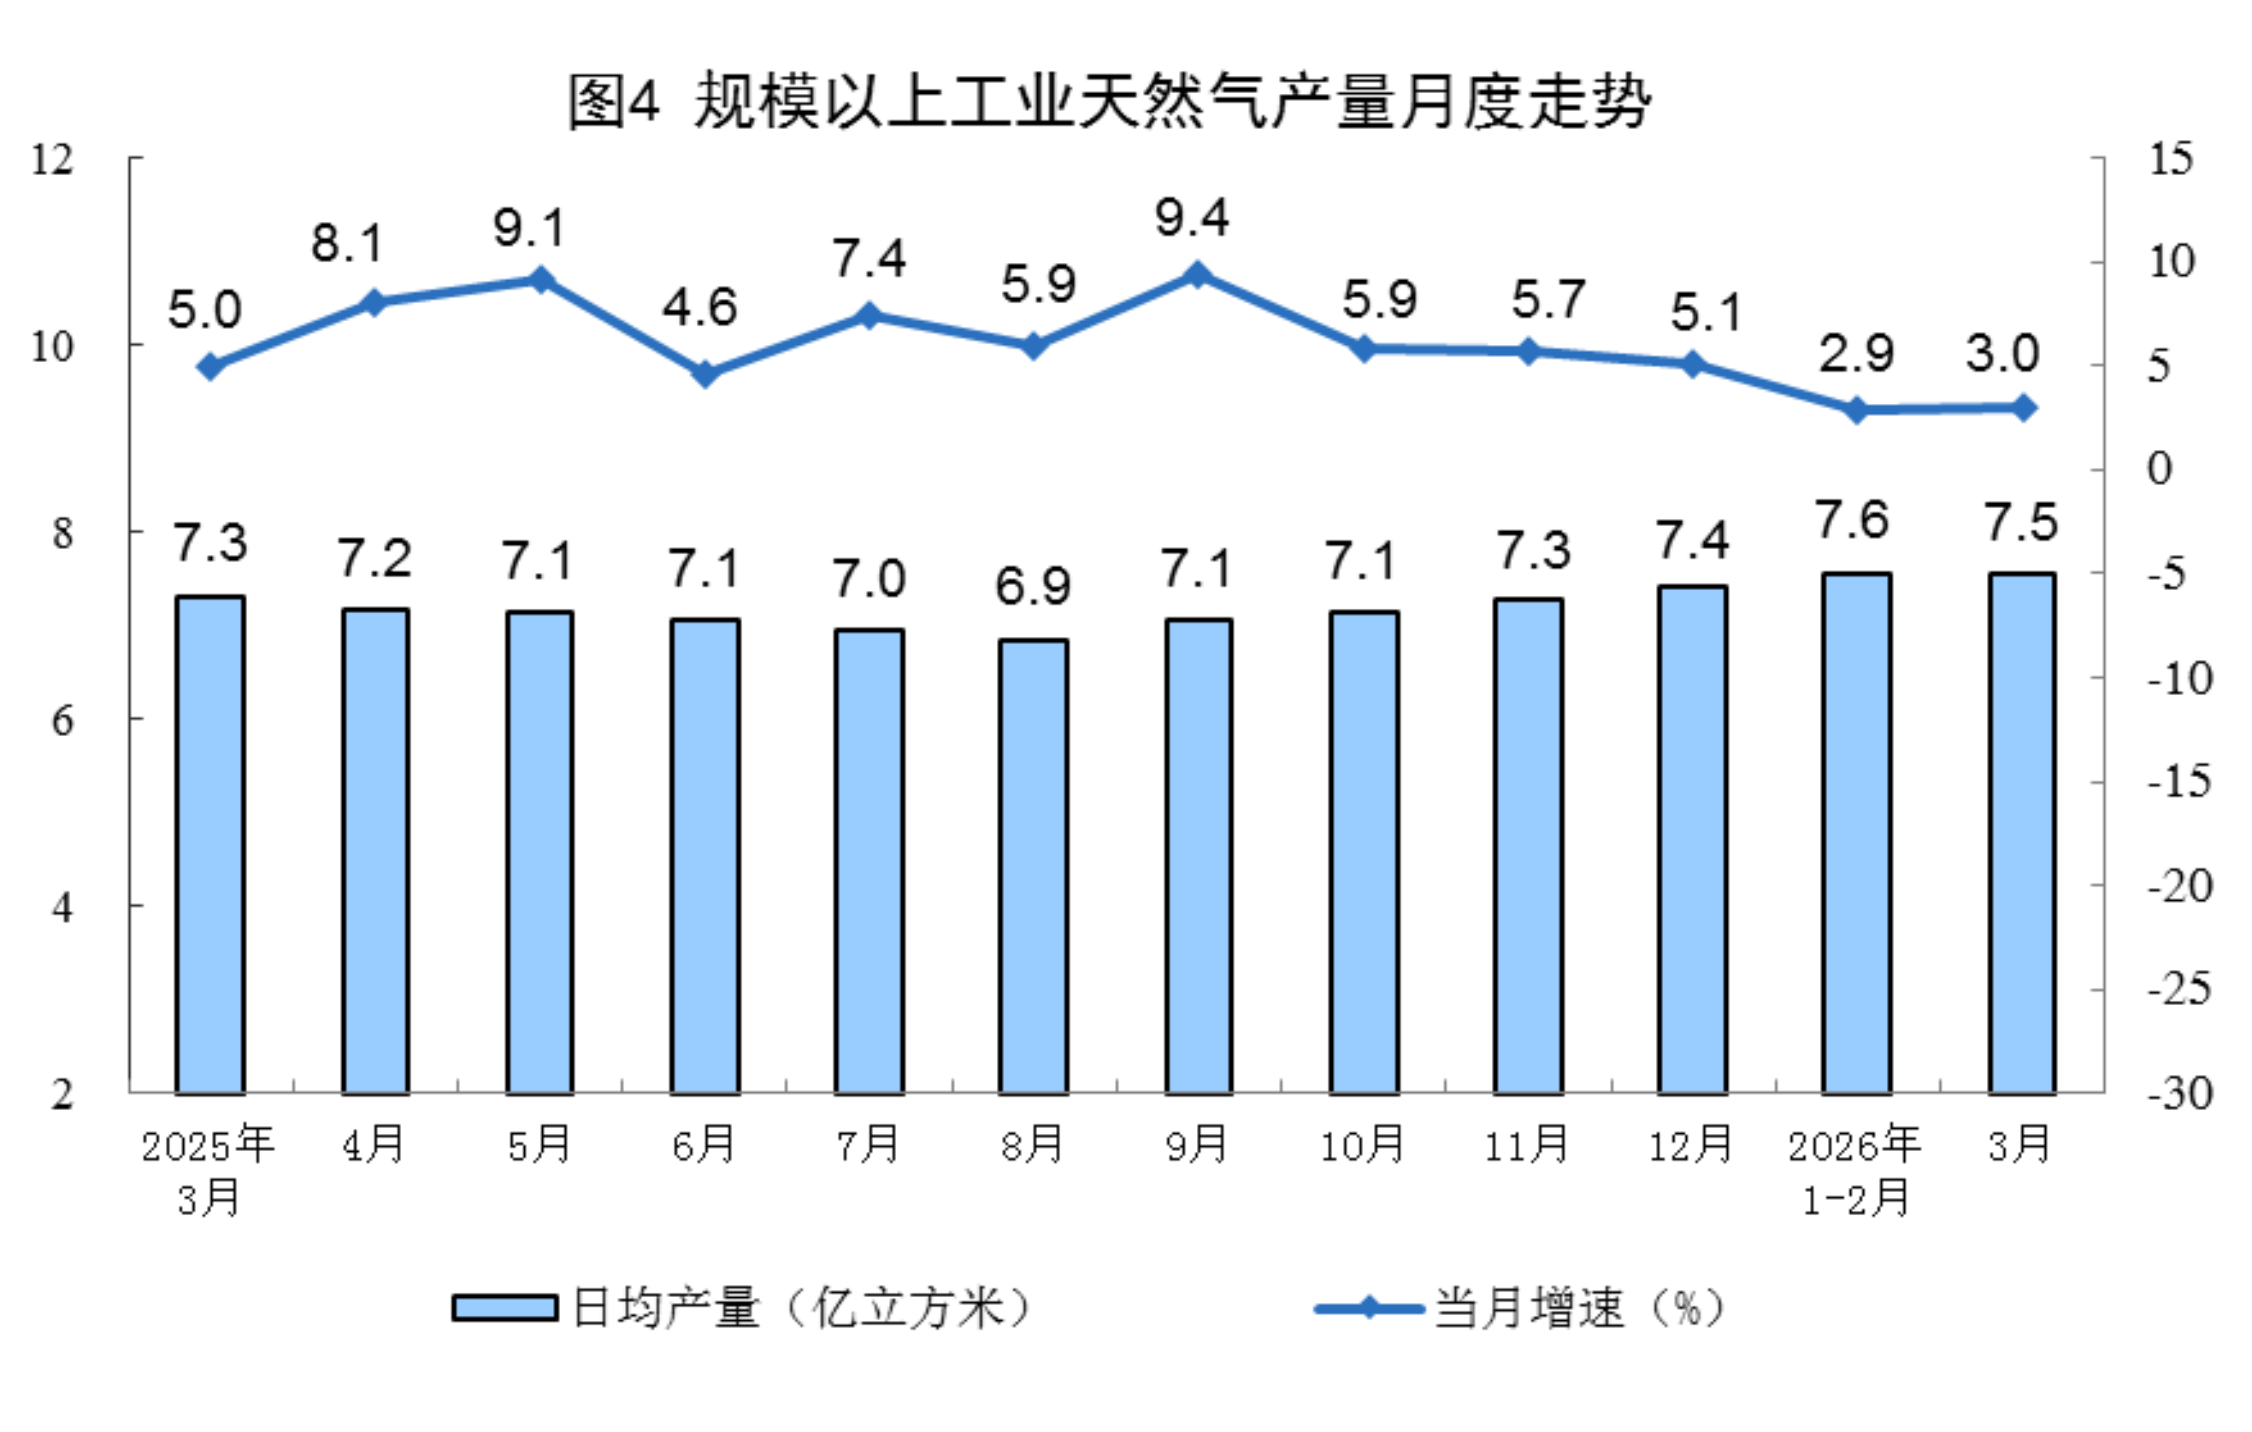
Natural gas production growth accelerated. In March, natural gas production by above-designated-scale industries totaled 23.4 billion m³, up 3.0% YoY, with the growth rate accelerating by 0.1 percentage points from January–February; daily average production was 750 million m³.
In January–March, natural gas production by above-designated-scale industries totaled 68.1 billion m³, up 3.0% YoY.
II. Power Generation
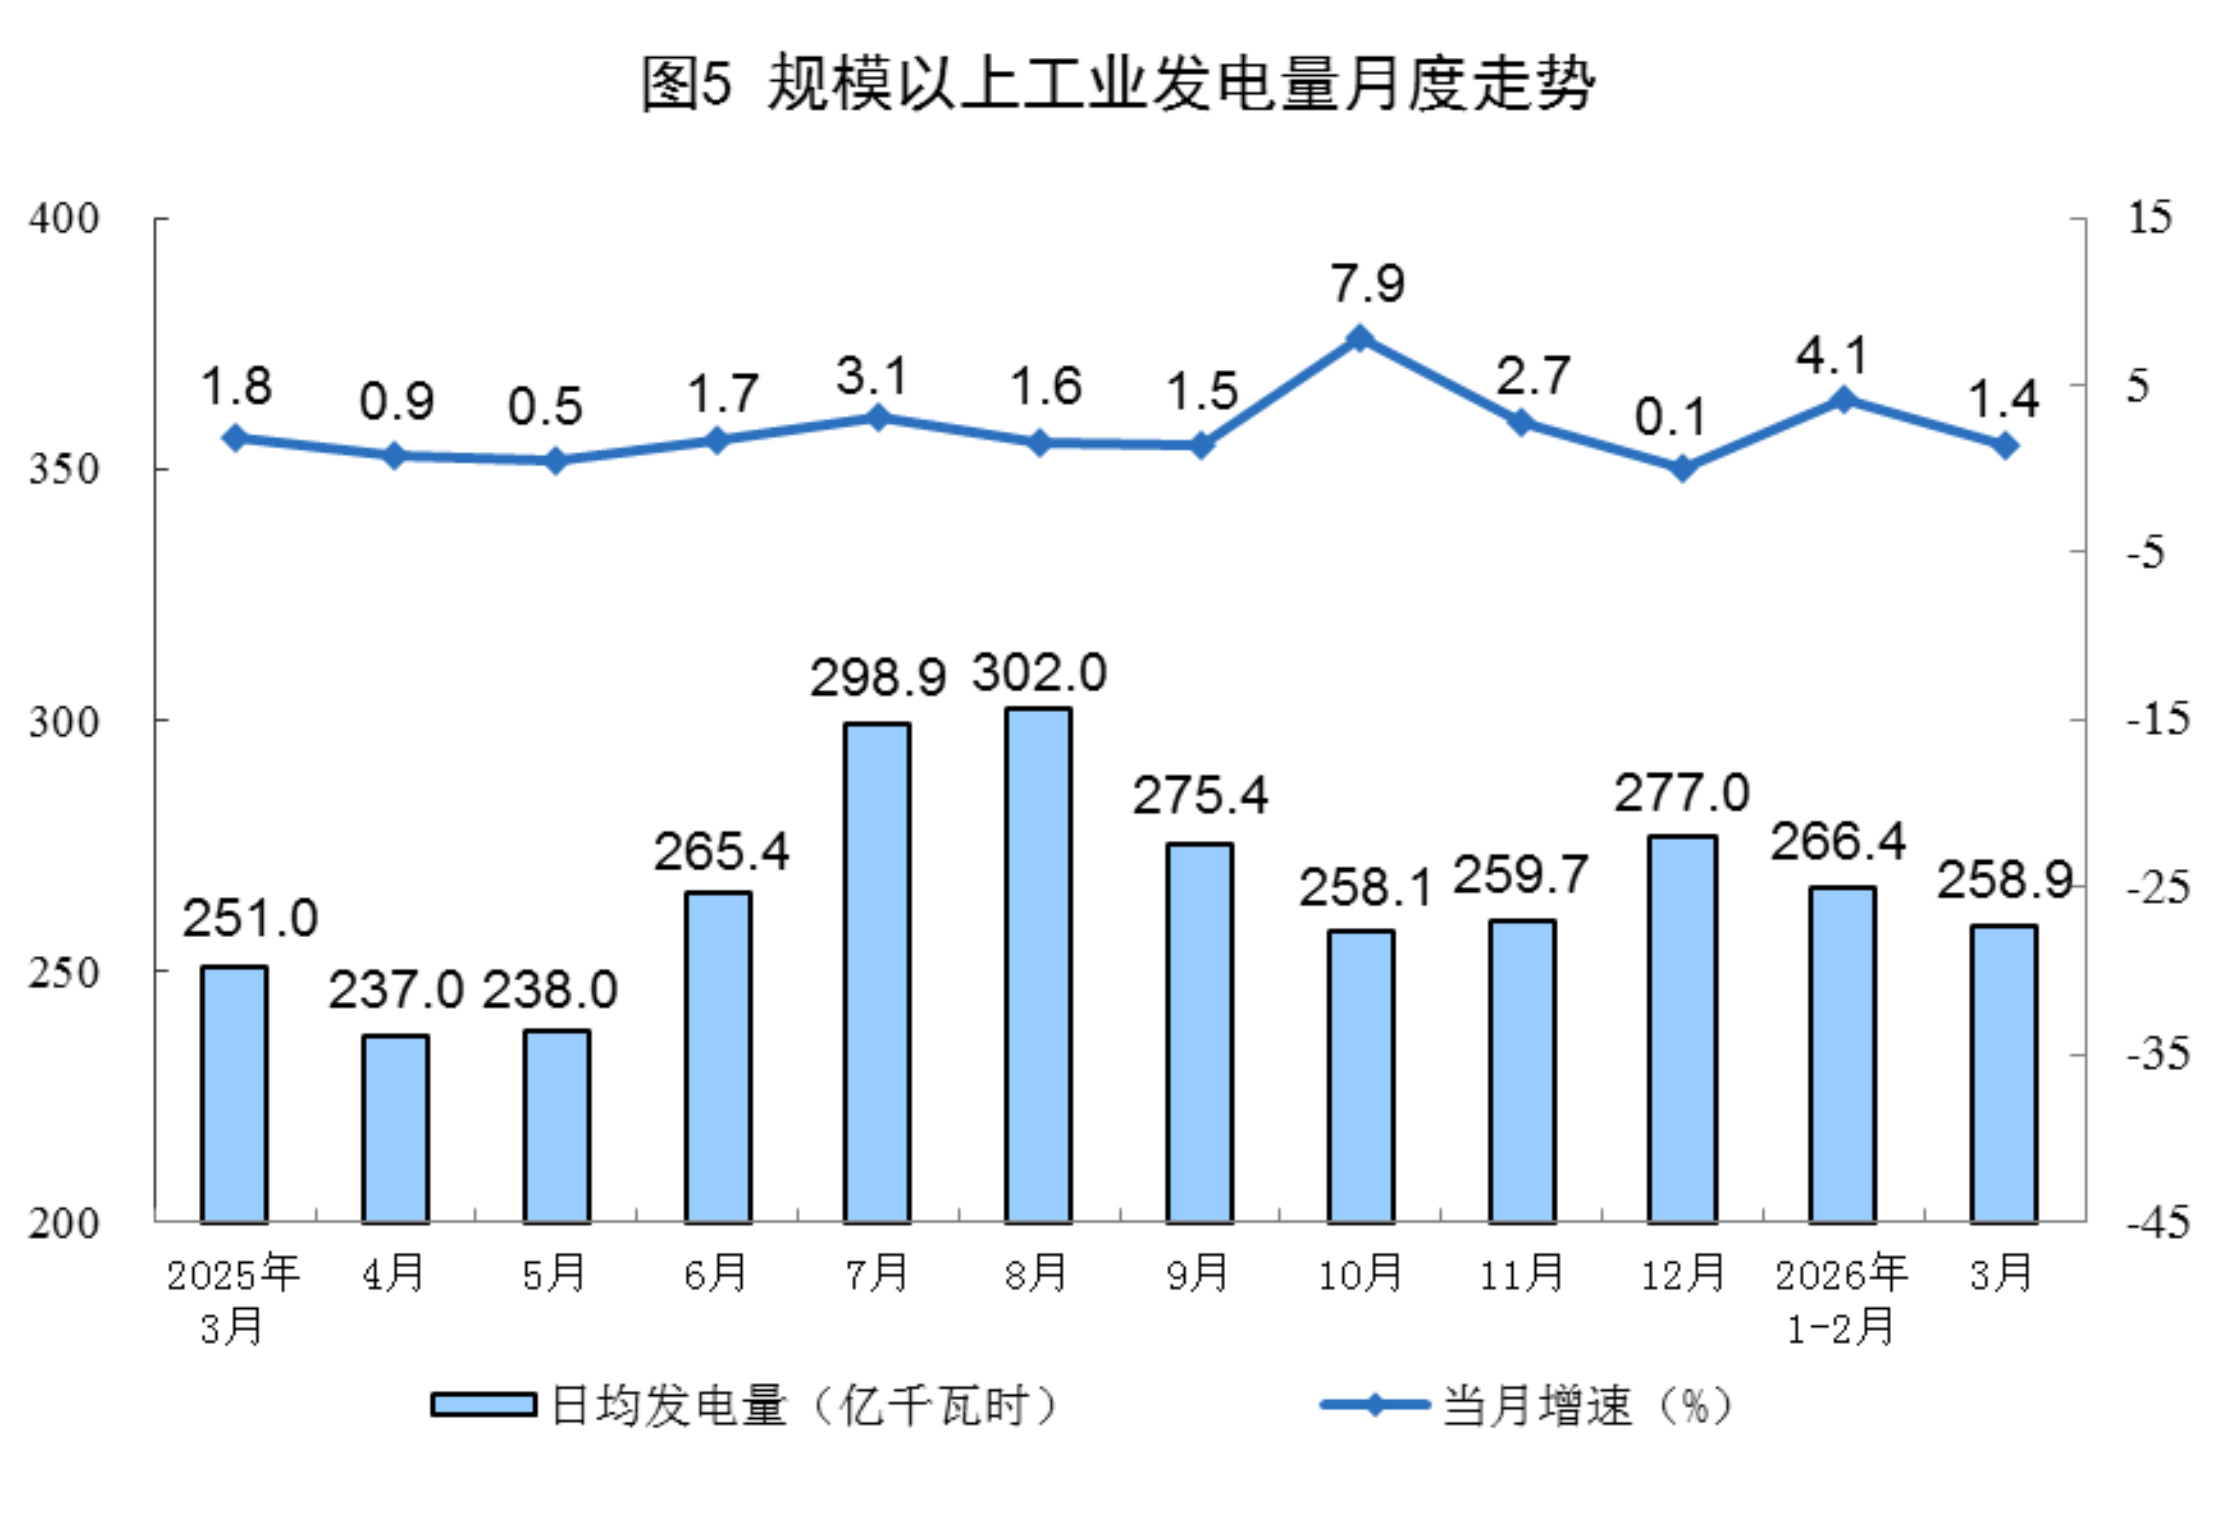
Power generation by above-designated-scale industries grew steadily. In March, power generation by above-designated-scale industries totaled 802.5 billion kWh, up 1.4% YoY, with the growth rate pulling back by 2.7 percentage points from January–February; daily average power generation was 25.89 billion kWh. In January–March, power generation by above-designated-scale industries totaled 2,378.2 billion kWh, up 3.4% YoY.
By category, in March, thermal power, hydropower, and solar power generation by above-designated-scale industries saw accelerated growth, while nuclear power and wind power shifted from growth to decline. Among them, thermal power generation by above-scale industrial enterprises was up 4.2% YoY, with the YoY growth rate 0.9 percentage points faster than that of January–February; hydropower generation was up 10.8% YoY, with the growth rate 4 percentage points faster; nuclear power generation was down 11.8% YoY, compared with a 0.8% increase in January–February; wind power generation was down 17.3% YoY, compared with a 5.3% increase in January–February; solar power generation was up 10.0% YoY, with the growth rate 0.1 percentage points faster than that of January–February.


![[SMM Analysis] Domestic EV Demand for Ternary Cathode Shows Modest Recovery](https://imgqn.smm.cn/usercenter/QxQbN20251217171727.jpg)