1. Manufacturing Purchasing Managers Index
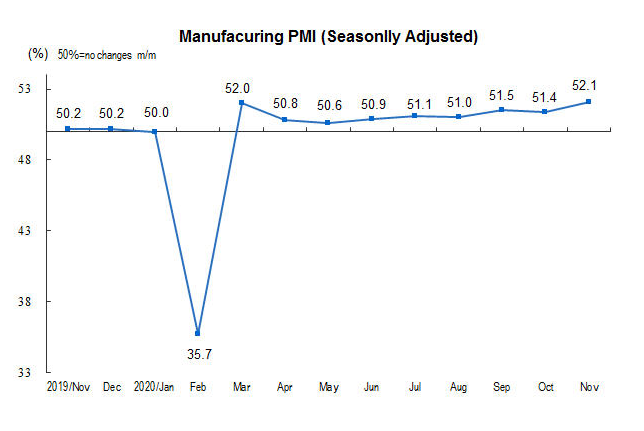
In November 2020, China's Manufacturing Purchasing Managers Index (PMI) was 52.1 percent, up by 0.7 percentage point from last month, which was above the threshold for nine consecutive months, indicating that the recovery growth of the manufacturing industry has accelerated.
In terms of enterprise scale, the PMI of large, medium and small enterprises were 53.0, 52.0 and 50.1 percent respectively, 0.4, 1.4 and 0.7 percentage point higher than the previous month, all above the threshold.
According to the classification index, the five sub-indices composing PMI, the production index, new orders index, and supplier distribution time index were all above the threshold, while main raw materials inventory index and employment index stayed below the threshold.
Production index was 54.7 percent, up by 0.8 percentage point from last month, indicating that the manufacturing production has accelerated.
New orders index was 53.9 percent, up by 1.1 percentage points from last month, indicating that the demand of the manufacturing industry has accelerated its recovery.
The inventory index of raw materials was 48.6 percent, up 0.6 percentage point from the previous month, indicating that the decline in inventory of major raw materials in the manufacturing industry narrowed.
The employment index was 49.5 percent, up 0.2 percent from the previous month, indicating a slight improvement in the employment situation of manufacturing enterprises.
The supplier delivery time index was 50.1 percent, which was 0.5 percentage point lower than the previous month, but it was still higher than the threshold, indicating that the delivery time of raw material suppliers in manufacturing industry was slightly faster than that of last month.

2. Non-manufacturing purchasing managers index
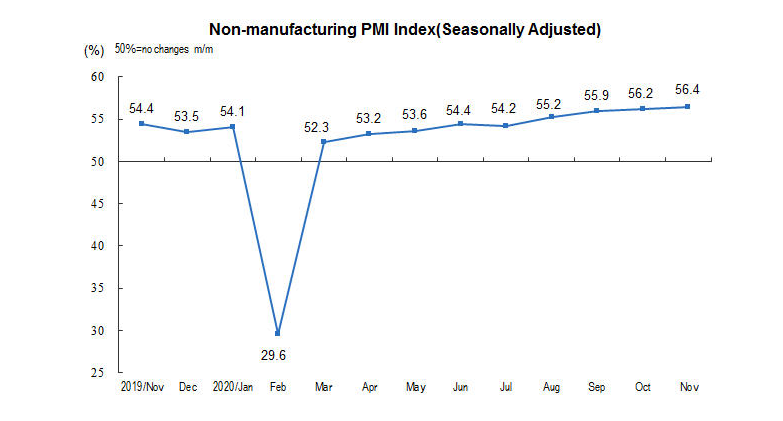
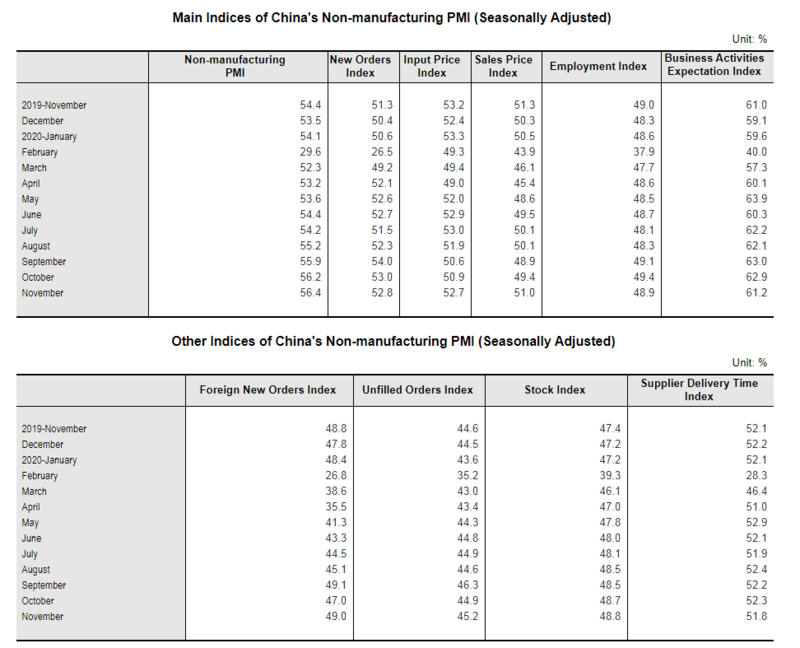
In November, the non-manufacturing business activity index was 56.4 percent, 0.2 percentage point higher than that of the previous month, which was the highest point in the year. The non-manufacturing industry continued to recover steadily.
In terms of industry, the business activity index of the construction industry was 60.5 percent, 0.7 percentage point higher than that of the previous month. The business activity index of the service industry was 55.7 percent, up 0.2 percentage point over the previous month. In terms of industry situation, the business activity index of railway transportation, air transportation, telecommunication, radio and television satellite transmission service and financial industry stayed above 60.0 percent, while that of real estate industry, ecological protection and environmental treatment industry was below the threshold.
The index of new orders was 52.8 percent, slightly down 0.2 percentage point from the previous month, but still higher than the threshold, indicating the continuous improvement of non-manufacturing market demand. In terms of industries, the index of new orders in the construction industry was 54.0 percent, up 0.9 percentage point over the previous month; the index of new orders in the service industry was 52.6 percent, down 0.3 percentage point from the previous month.
The input price index was 52.7 percent, up 1.8 percentage points from last month, indicating that the prices of inputs used by non-manufacturing enterprises for business activities have increased significantly. In terms of industries, the price index of construction inputs was 57.5 percent, up 4.6 percentage points over the previous month; the price index of inputs in service industry was 51.9 percent, up 1.3 percentage points over the previous month.
The sales price index was 51.0 percent, an increase of 1.6 percentage points over the previous month, indicating that the sales prices of non-manufacturing industries in general have changed from falling to rising. By industry, the sales price index of the construction industry was 51.3 percent, down 1.0 percentage point from the previous month; the sales price index of the service industry was 50.9 percent, up 2.0 percentage points from the previous month.
The employment index was 48.9 percent, down 0.5 percentage point from the previous month, indicating that the employment situation of non-manufacturing industry has declined. In terms of industries, the construction industry employee index was 54.4 percent, up 1.2 percentage points over the previous month; the service industry employee index was 47.9 percent, down 0.8 percentage point from the previous month.
The expected index of business activities was 61.2 percent, which was 1.7 percentage points lower than that of the previous month, but it was still in the high boom range, indicating that most non-manufacturing enterprises were optimistic about the development of the industry. In terms of industries, the expected index of business activities in the construction industry was 61.8 percent, down 5.3 percentage points from the previous month; the expected index of business activities in the service industry was 61.1 percent, down 1.1 percentage point from the previous month.
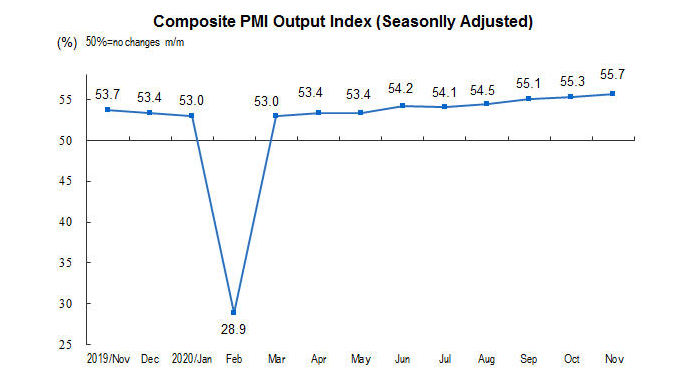
3. Composite PMI Output Index
In November, the comprehensive PMI output index was 55.7 percent, up 0.4 percentage point over last month, indicating the production and operation of Chinese enterprises continued to improve.
![[SMM Expresso de Metais Preciosos]](https://imgqn.smm.cn/usercenter/OQqCm20251217171736.jpg)