SMM, October 22,
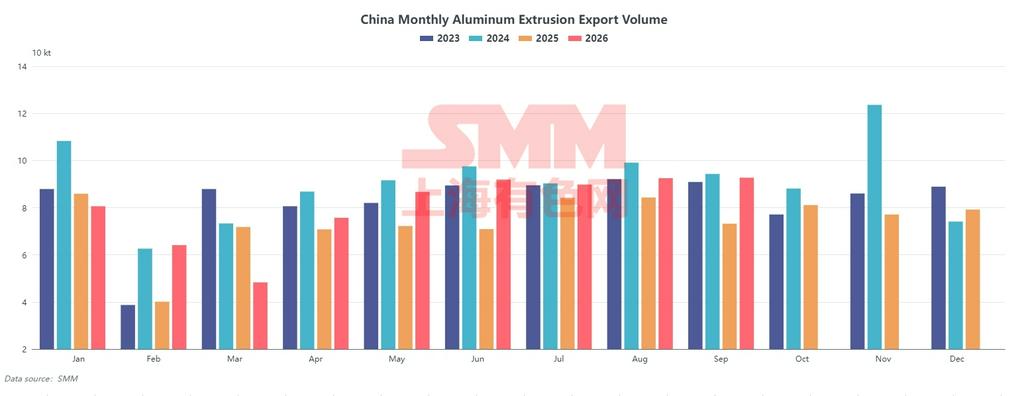
According to customs data, China's aluminum extrusion exports totaled 92,700 mt in September 2026, up 0.2% MoM and up 26.5% YoY. Cumulative exports from January to September reached 722,300 mt, up 10.7% YoY. September exports hit a new monthly high for 2026. Aluminum extrusion exports have shifted from the recovery phase in Q2 to a high-level plateau, with total volumes holding near 90,000 mt for three consecutive months.
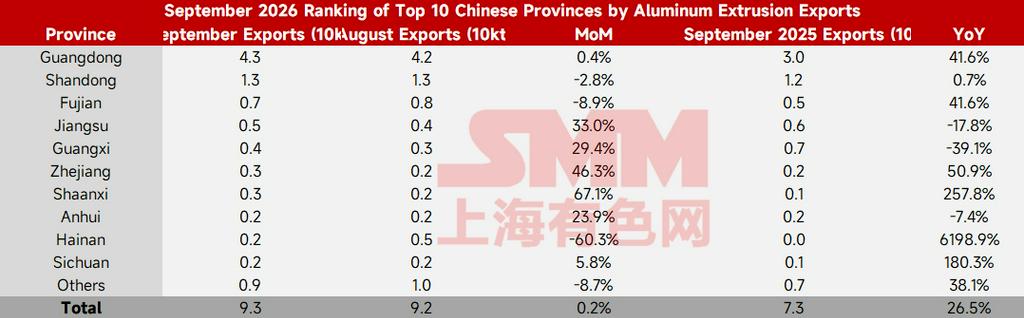
By province, the main feature in September was basically stable total volume with significant inter-provincial structural changes. In traditional production areas, Guangdong exported 42,600 mt, accounting for 45.9%, up 200 mt or 0.4% MoM, basically flat; Shandong stayed above 12,000 mt for two consecutive months in August and September, making it a relatively stable exporting province at present. The incremental growth came from Jiangsu, Zhejiang, Shaanxi, and Guangxi: Jiangsu increased by 1,300 mt, up 33.0% MoM; Zhejiang increased by 1,100 mt, up 46.3% MoM; Shaanxi increased by 1,100 mt, up 67.1% MoM; Guangxi increased by 900 mt, up 29.4% MoM. The four provinces together added about 4,400 mt. This mix differed from August's structure, which was dominated by Guangdong alone, with growth sources relatively dispersed. The pullbacks were concentrated in three areas: Hainan fell from 4,800 mt in August to 1,900 mt, a decrease of 2,900 mt or 60.3% MoM, ending its streak of staying above 2,900 mt for three consecutive months. September exports pulled back in stages after the release of free trade port closure factors. Inner Mongolia fell from 2,000 mt to 1,100 mt, a decrease of 900 mt or 43.0% MoM. Fujian pulled back slightly from 7,600 mt to 7,000 mt, down 8.9% MoM.
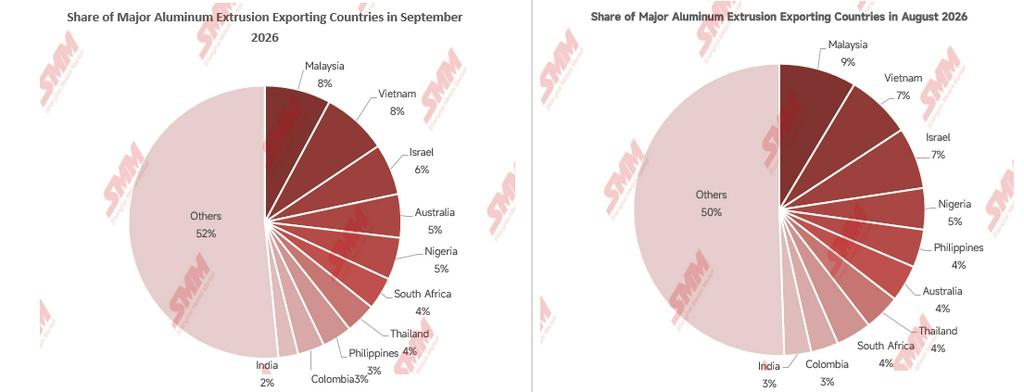
By export destination, the top five destinations in September totaled 29,500 mt, accounting for 31.8% of the total, slightly higher than August's top five of 28,900 mt and 31.2%. With total volume basically flat, concentration rose rather than fell, but trends within the five countries diverged notably. Malaysia was 7,300 mt, or 7.9%, down 7.6% MoM and up 55.3% YoY; Vietnam was 7,200 mt, or 7.7%, up 7.5% MoM and down 25.0% YoY; Israel was 5,600 mt, or 6.0%, down 11.1% MoM, versus only 1,000 mt a year earlier; Australia was 4,800 mt, or 5.2%, up 26.3% MoM and up 23.1% YoY; Nigeria was 4,600 mt, or 5.0%, up 9.5% MoM and up 100% YoY. Australia and Nigeria were the two markets among the top five with both positive MoM and YoY growth; Malaysia and Israel pulled back MoM but were sharply higher YoY; Vietnam was the only top-five market with a YoY decline, as the substitution effect of local aluminum extrusion continued. By region, Southeast Asia was 25,700 mt, or 27.7%, still the largest region, down 3.0% MoM; Africa was 18,200 mt, or 19.6%, down 2.2% MoM; the six Middle Eastern countries totaled 1,900 mt, or 2.1%, down 0.8% MoM, with all three major regions negative MoM. Supporting total volume this month were non-EU Europe at 4,500 mt (up 28.6% MoM), Oceania at 5,700 mt (up 18.8% MoM), Northeast Asia at 4,300 mt (up 10.3% MoM), and Latin America at 15,000 mt (up 4.2% MoM), with these four regions together adding a net increase of about 2,900 mt, largely offsetting the declines in major regions. Overall, the trend of orders dispersing from a few large markets to multiple small and medium-sized markets continued, and the impact of fluctuations in any single market on total volume weakened accordingly.
By trade mode, September Ordinary Trade exports were 79,900 mt, accounting for 86.2%, down 1.1 ppts from 87.3% in August, with volume down 1.1% MoM. Processing trade with supplied materials exports were 6,500 mt, accounting for 7.0%, up 0.8 ppts from 6.2% in August, up 13.7% MoM. Processing trade with imported materials exports were 4,700 mt, accounting for 5.1%, down 0.4 ppts from August, down 8.0% MoM. The share of Ordinary Trade declined for two consecutive months, while processing trade provided marginal support.
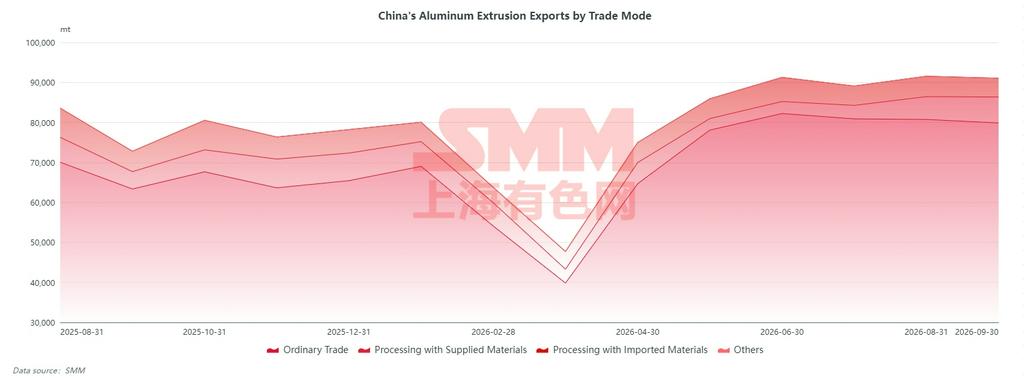
September exports were basically flat MoM, but the structure shifted compared with August: the concentrated shipment momentum from Guangdong faded, Hainan's surge pulled back, and growth became more broad-based, coming from Jiangsu, Zhejiang, Shaanxi, and Guangxi. By destination, the three main markets contracted simultaneously, while non-EU Europe, Oceania, Northeast Asia, and Latin America played an offsetting role. The share of Ordinary Trade continued to decline, with processing trade filling the gap, indicating that price-driven momentum for independent order-taking is still weakening. According to manufacturer feedback, overall exports in August and September changed relatively little. A Fujian producer noted that after entering October, the price spread between Chinese and overseas markets continued to narrow, and combined with higher shipping costs, the cost advantages of aluminum extrusion exports weakened, with exports expected to pull back mildly going forward. A Henan producer also reported that after Australia made an affirmative preliminary anti-dumping ruling on Chinese aluminum doors and windows, local clients' willingness to import Chinese aluminum extrusion was affected, and related export orders have already shrunk. Overall, the rise in cumulative growth in January-September was mainly due to the low base last year, and demand for export orders is expected to pull back. October aluminum extrusion exports are expected to land at 83,000-90,000 mt, with the Q4 midpoint shifting down from Q3 to 79,000-86,000 mt, and the full-year total at 950,000-990,000 mt.