According to customs statistics, in the first three quarters of this year, China’s total imports and exports of goods reached 39.94 trillion yuan, up 18.8% YoY. Of this total, exports were 23.2 trillion yuan, an increase of 16.4%, and imports were 16.74 trillion yuan, an increase of 22.3%. The monthly growth rate remained in double digits for six consecutive months. In September, imports and exports totaled 5.16 trillion yuan, surpassing 5 trillion yuan for the first time, up 27.5%. Of this total, exports were 3.03 trillion yuan, up 29.6%, and imports were 2.13 trillion yuan, up 24.6%.
Data from the General Administration of Customs showed that in the first three quarters, China’s equipment manufacturing sector played a prominent leading role, contributing nearly 90% of export growth. Intermediate products accounted for more than half of total export value, effectively serving as a “stabilizing anchor” for global industrial and supply chains. Export products became smarter and greener: integrated circuit exports increased by 99.1%, while exports of green products such as EVs, lithium batteries, wind turbine generator sets, and parts increased by 72.3%, 36.4%, and 22.4%, respectively.
Data from the General Administration of Customs showed that in the first three quarters, China’s private enterprises recorded imports and exports of 22.73 trillion yuan, up 19.1%, accounting for 56.9% of total foreign trade value and continuing to rank as the largest foreign trade entity; foreign-invested enterprises recorded imports and exports of 11.69 trillion yuan, up 19%; and state-owned enterprises recorded imports and exports of 5.46 trillion yuan, up 17.8%.
Data from the General Administration of Customs showed that in the first three quarters, China’s import growth rate was 5.9 percentage points faster than export growth. Benefiting from the China-Europe Railway Express and the development of the New International Land-Sea Trade Corridor in western China, the pace of opening-up in central and western regions accelerated significantly. Imports and exports in the central region increased by 20.5%, and those in the western region increased by 25.7%.
On October 14, Wang Jun, Deputy Administrator of the General Administration of Customs, said at a press conference held by the State Council Information Office that in the first three quarters, China’s foreign trade effectively responded to external shocks and challenges and maintained strong development momentum. Although various risks and challenges continue to emerge, the drivers and vitality of China’s foreign trade strengthened, and its resilience was evident. There is a foundation and support for continued growth in imports and exports in Q4. (CCTV News)
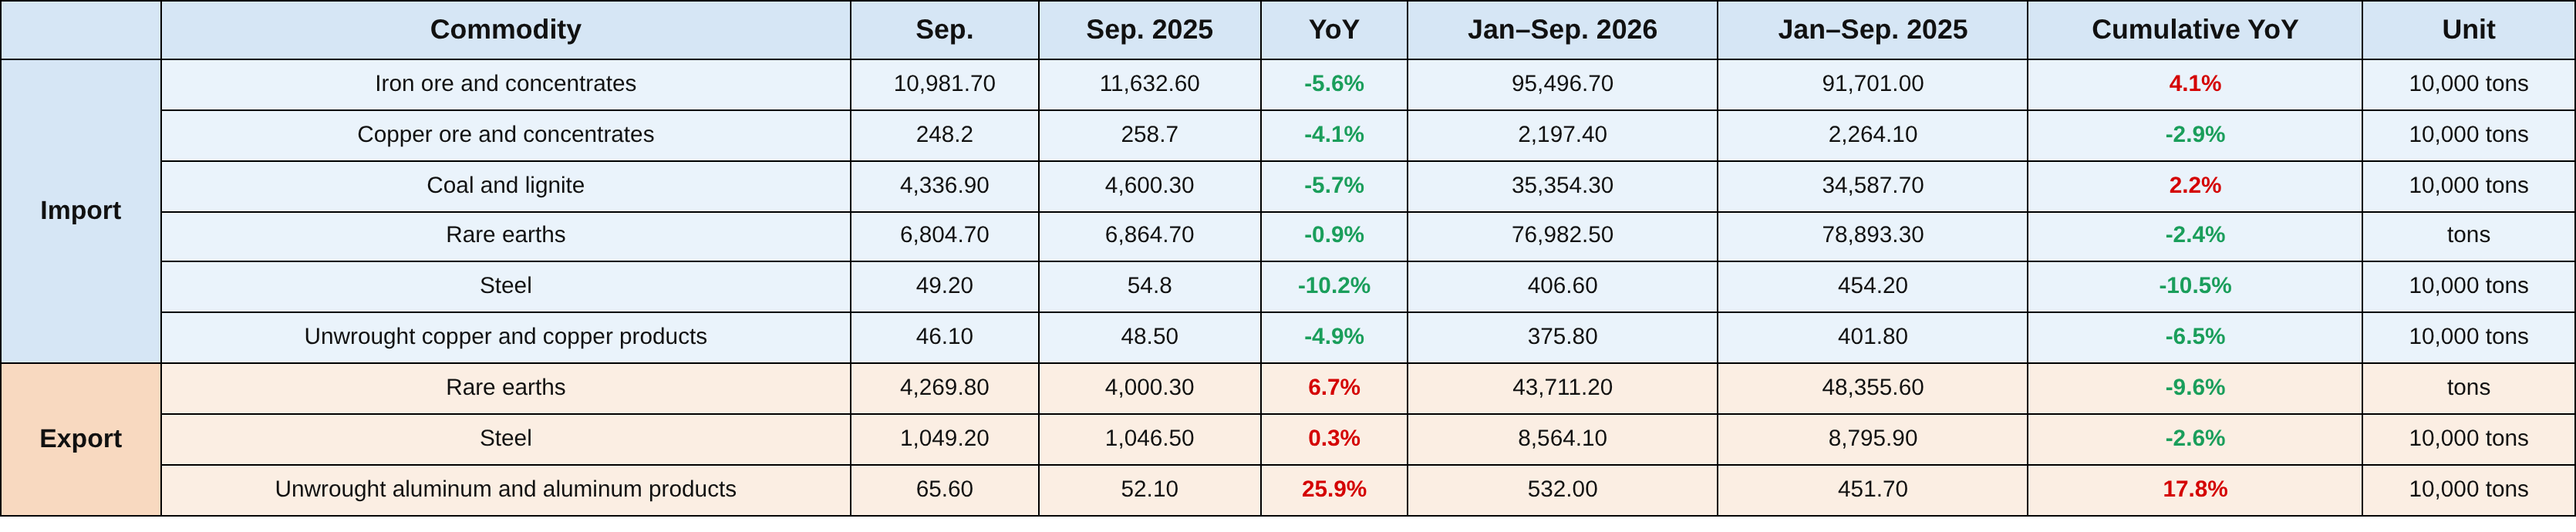
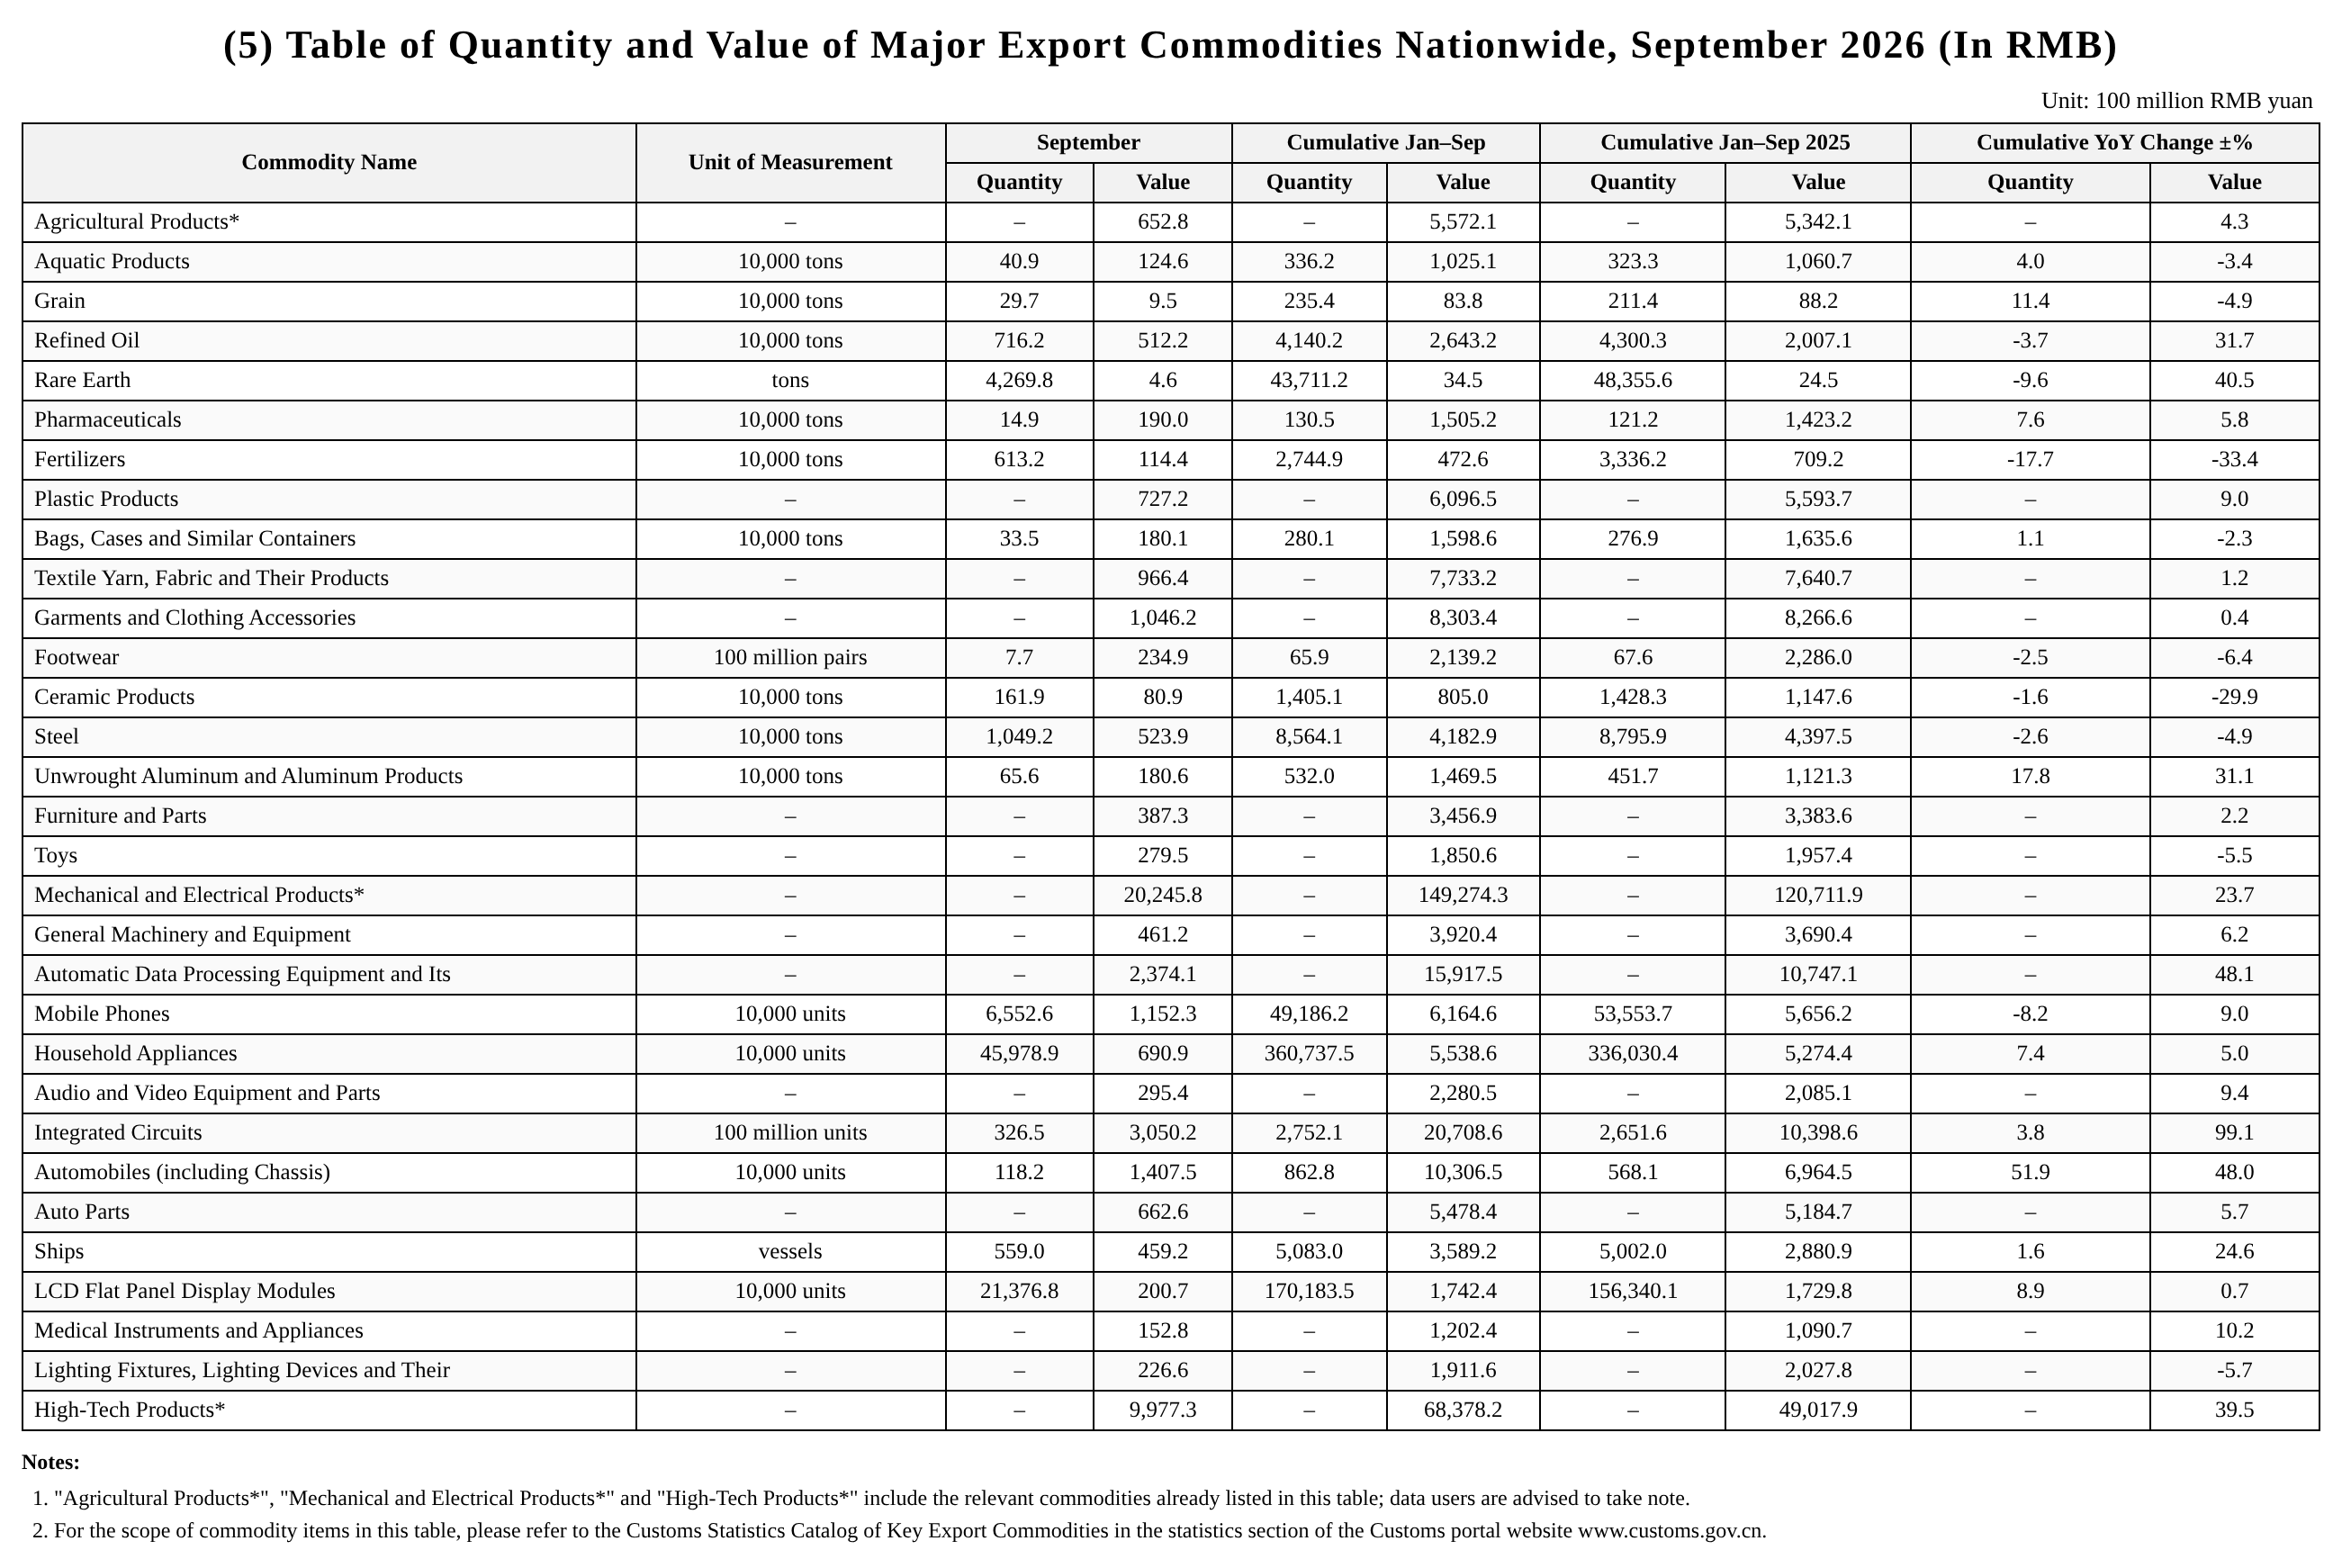
Based on data released by the General Administration of Customs, SMM compiled the import and export situation of certain products in the metals industry, as follows:
Exports:
Rare earth exports in Sep 20264,269.8 mt,up 6.7% YoY vs. Sep 2025. Cumulative exports from Jan to Sep 2026 were 43,711.2 mt,down 9.6% YoY vs. Jan to Sep 2025.
Steel exports in Sep 202610.492 millionmt,up 0.3% YoY vs. Sep 2025. In January-September 2026, cumulative exports totaled 8,564.1 mt, down 2.6% YoY from January-September 2025.
In September 2026, unwrought aluminum and aluminum semis exports were 656,000 mt, up 25.9% YoY from September 2025.In January-September 2026, cumulative exports totaled 5.32 million mt, up 17.8% YoY from January-September 2025.
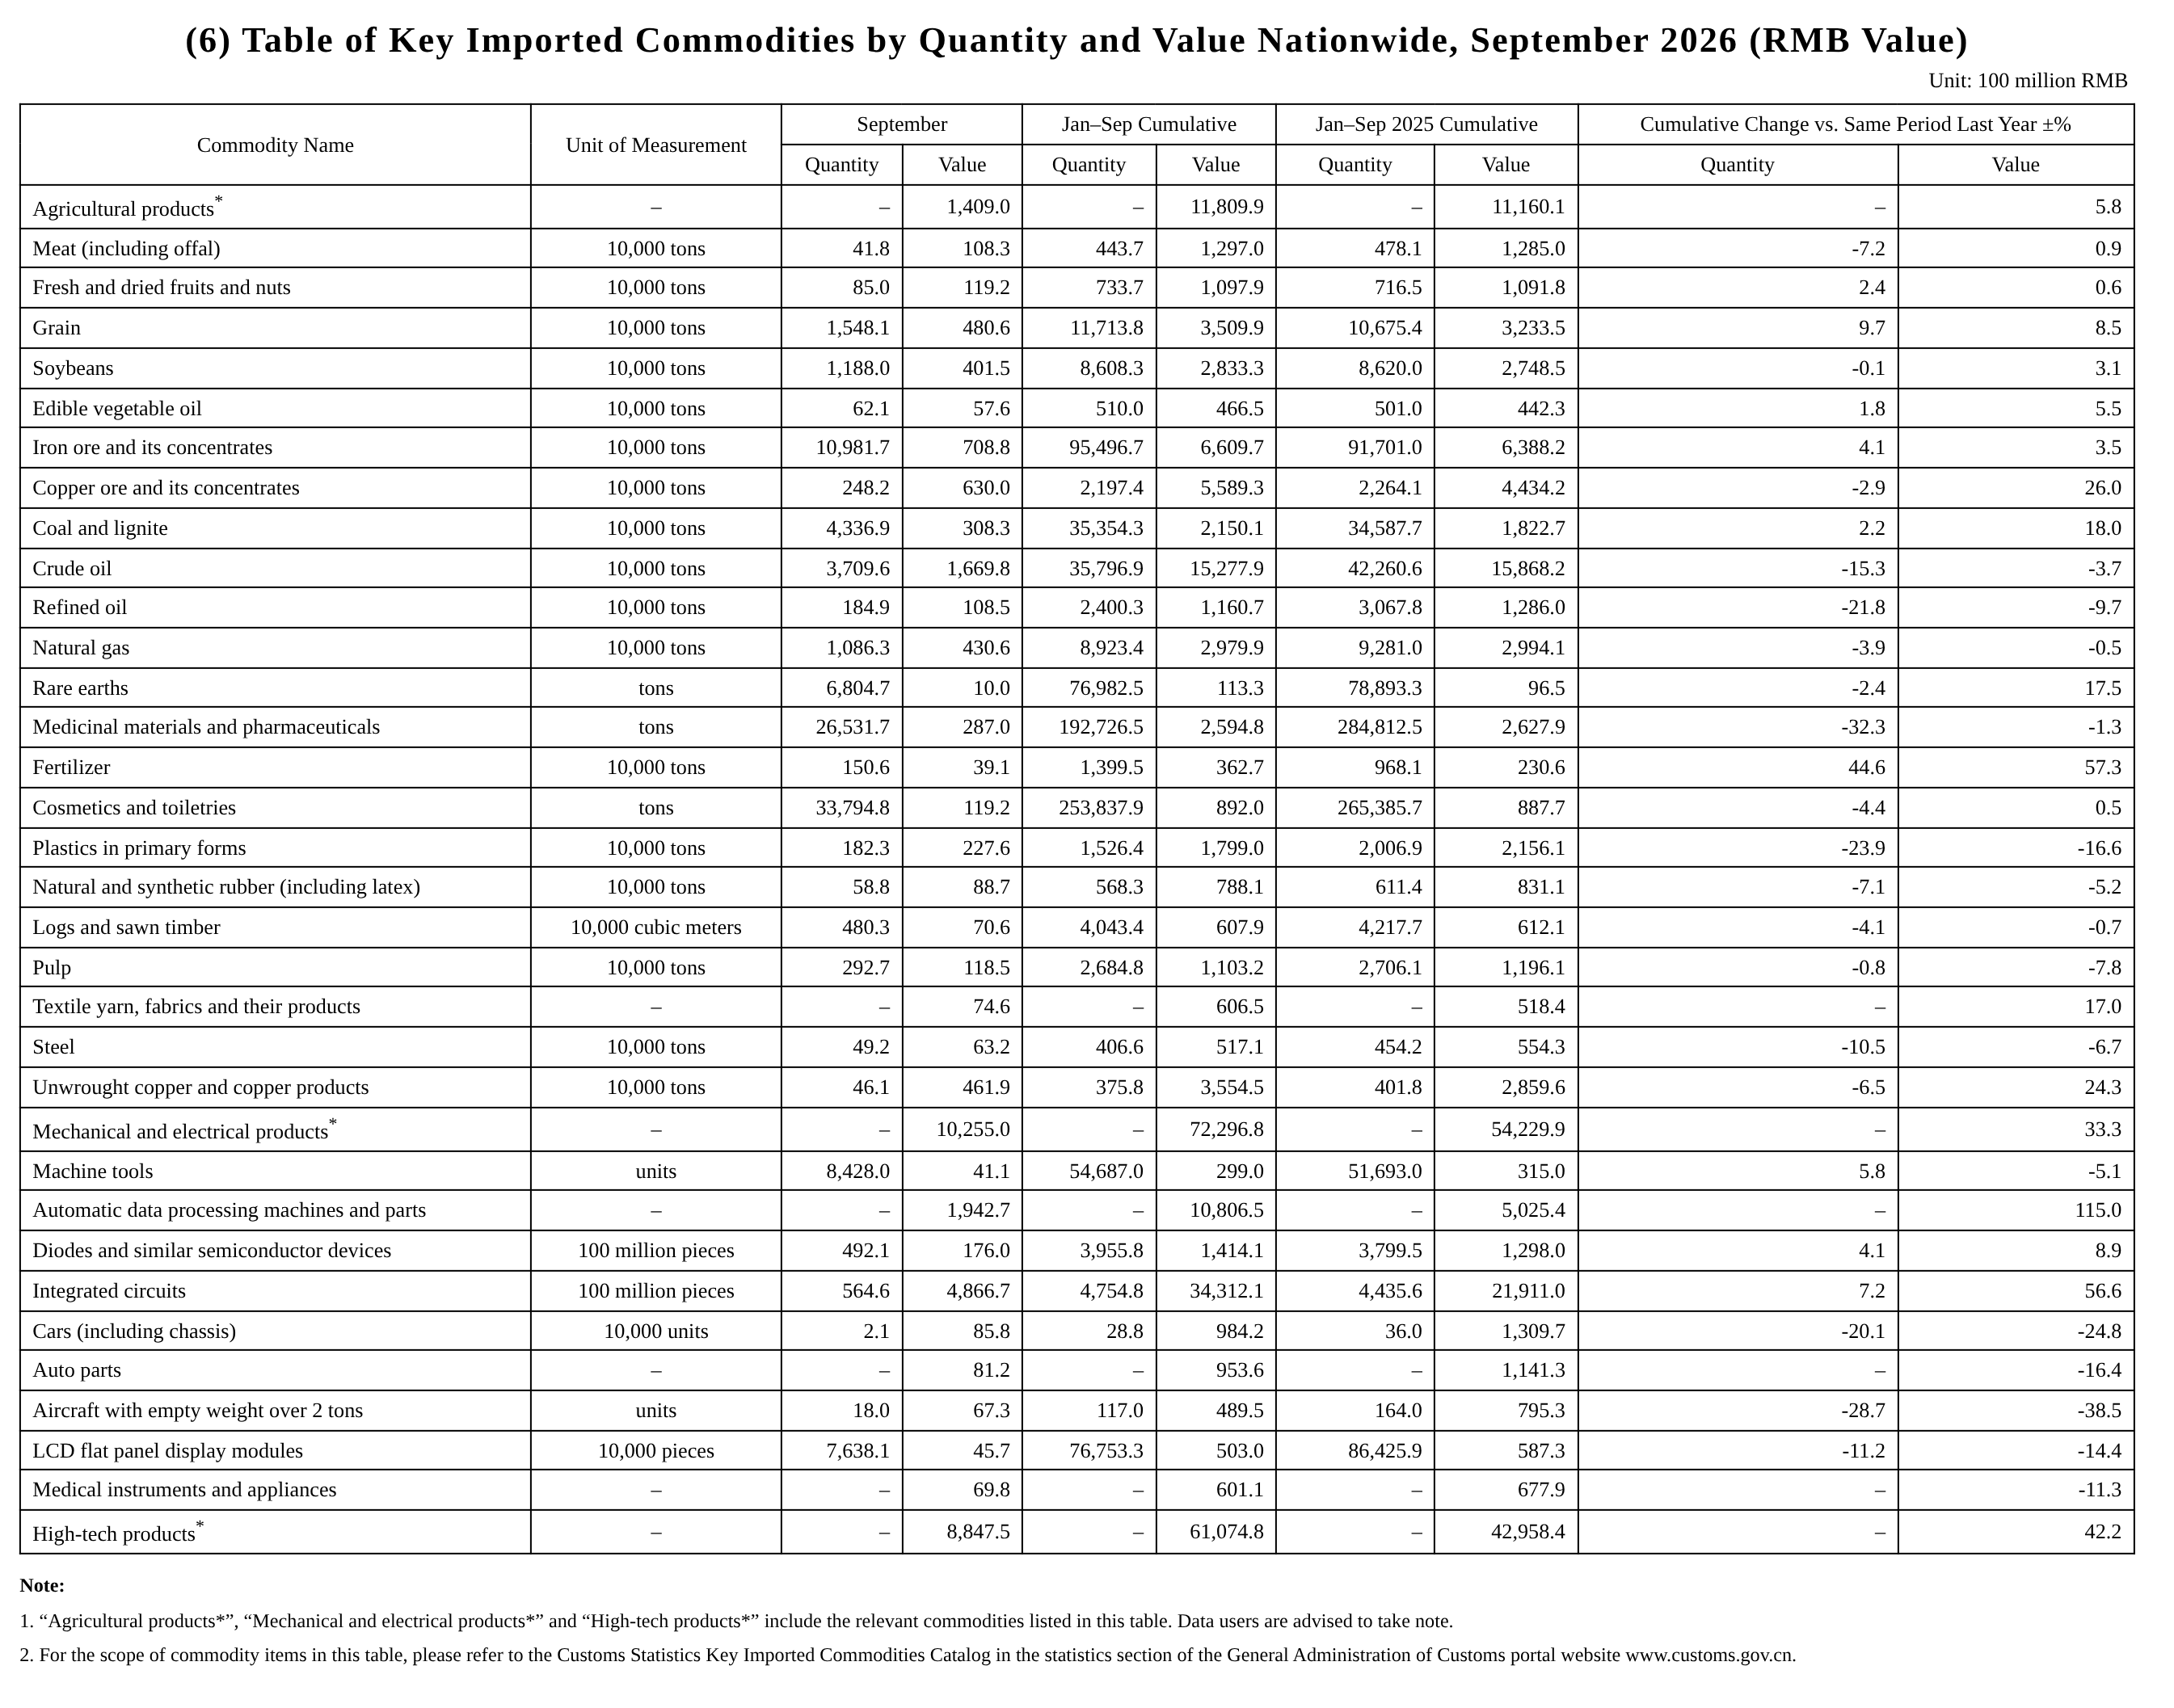
Imports:
In September 2026, iron ore and concentrates imports were 109.817 million mt, down 5.6% YoY from September 2025.In January-September 2026, cumulative imports totaled 954.967 million mt, up 4.1% YoY from January-September 2025.
In September 2026, copper ore and concentrates imports were 2.482 million mt, down 4.1% YoY from September 2025.In January-September 2026, cumulative imports totaled 21.974 million mt, down 2.9% YoY from January-September 2025.
In September 2026, coal and lignite imports were 43.369 million mt, down 5.7% YoY from September 2025.In January-September 2026, cumulative imports totaled 353.543 million mt, up 2.2% YoY from January-September 2025.
In September 2026, rare earth imports reached 6,804.7 mt, down 0.9% YoY from September 2025.In January-September 2026, cumulative imports totaled 76,982.5 mt, down 2.4% YoY from January-September 2025.
In September 2026, steel imports reached 492,000 mt, down 10.2% YoY from September 2025.In January-September 2026, cumulative imports totaled 4.066 million mt, down 10.5% YoY from January-September 2025.
In September 2026, unwrought copper and copper semis imports were 461,000 mt, down 4.9% YoY from September 2025.In January-September 2026, cumulative imports totaled 3.758 million mt, down 6.5% YoY from January-September 2025.
Related reading:
![As contract rollover approaches, the price spread between futures contracts narrows, and spot premiums continue to edge down [SMM Shanghai spot copper]](https://imgqn.smm.cn/usercenter/mpocQ20251217171712.jpg)
![LME backwardation structure narrows, SHFE/LME price ratio recovers, registered copper premiums stay high [SMM Yangshan spot copper]](https://imgqn.smm.cn/usercenter/hsjMg20251217171712.jpg)
![[SMM Tin Midday Review] AI narrative cools, coupled with rate hike expectations, tin prices decline on heavy volume, testing lower support](https://imgqn.smm.cn/usercenter/WPbpj20251217171753.jpg)