I. Overview
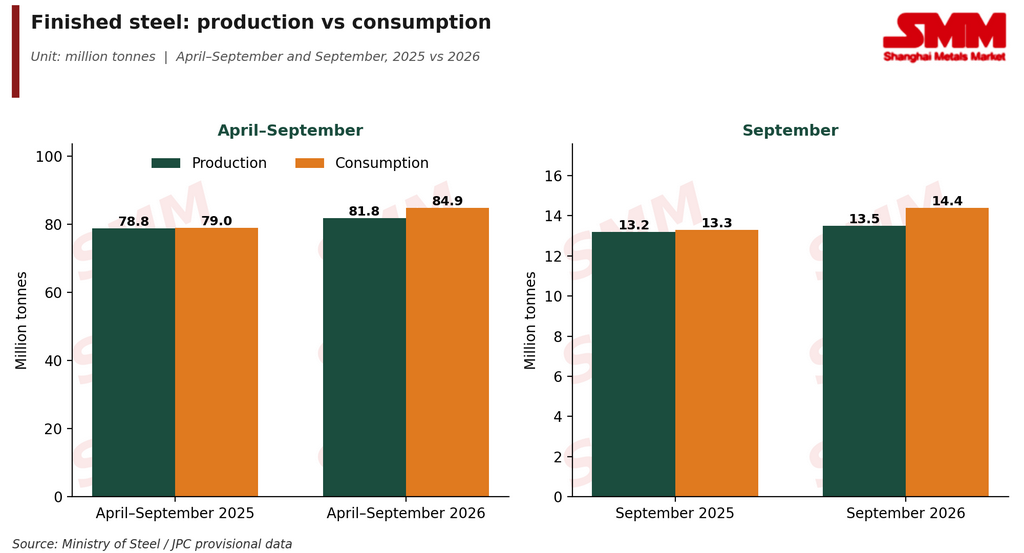
India’s finished steel market remained demand-driven in April–September 2026, with consumption growing faster than domestic production. Finished steel consumption increased 7.5% YoY to 84.9 Mt, while production rose 3.7% to 81.8 Mt.
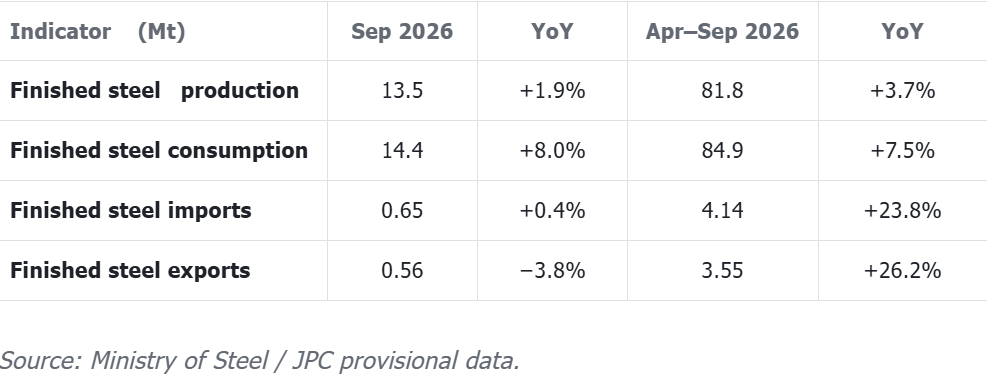
India’s finished steel consumption continued to grow strongly during April–September 2026, supported by demand from construction, infrastructure and manufacturing sectors. This suggests that domestic production growth was not enough to fully keep pace with the increase in steel demand.
Consumption increased 7.5% YoY to 84.9 Mt, compared with a 3.7% YoY increase in production to 81.8 Mt. As demand grew faster than domestic output, the gap between consumption and production widened to 3.1 Mt. Net imports of 0.59 Mt covered less than a fifth of that gap, implying a drawdown of roughly 2.5 Mt from stocks along the chain.
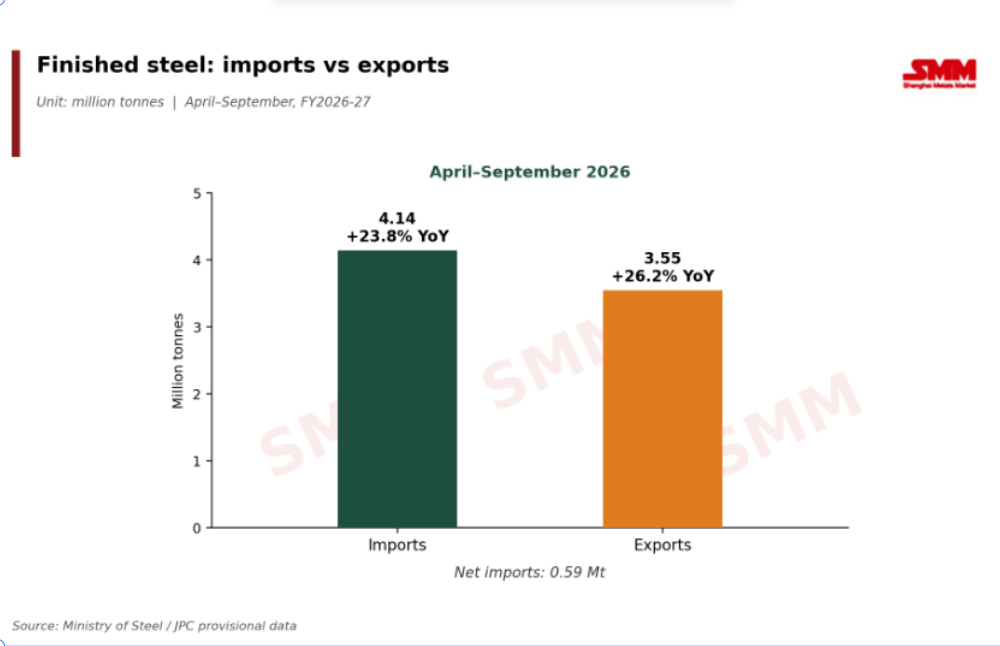
Higher imports also point to stronger demand relative to domestic availability. Finished steel imports increased 23.8% YoY to 4.14 Mt during April–September, showing that overseas material continued to supplement domestic supply as consumption grew faster than production. Exports rose even faster by 26.2% to 3.55 Mt, largely reflecting a low base a year earlier (2.81 Mt). Even so, imports exceeded exports by about 0.59 Mt.
Market view
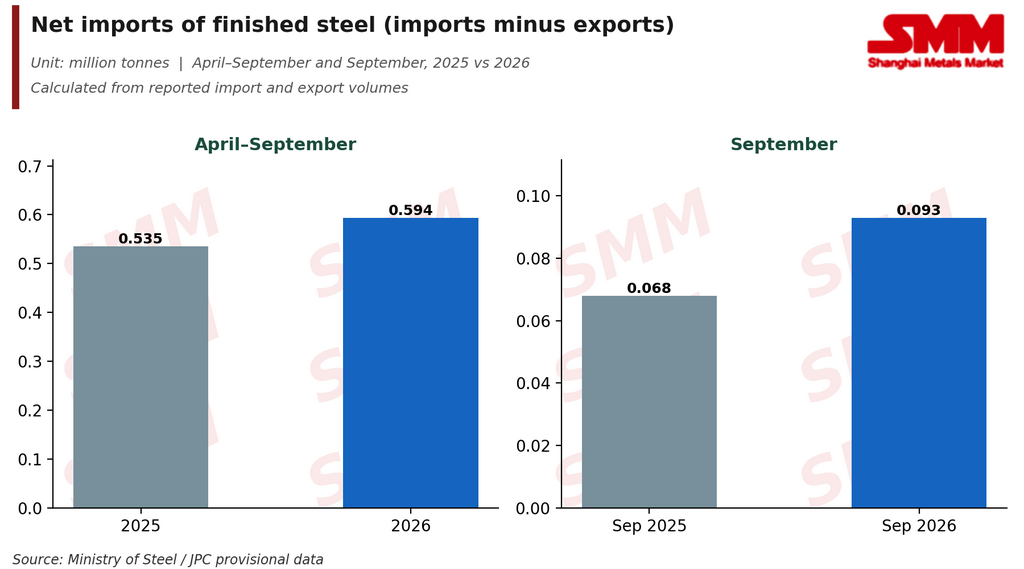
The key trend in H1 FY2026-27 was that steel demand expanded faster than domestic production. Ministry of Steel commentary attributes recent consumption growth to construction, infrastructure and manufacturing end-use segments, while domestic output grew at a slower pace. Gross imports rose sharply, by 23.8% to 4.14 Mt but exports rose even faster by 26.2% to 3.55 Mt, so net trade added little. Net imports edged up to 0.59 Mt from 0.54 Mt a year earlier, covering less than a fifth of the 3.1 Mt gap between consumption and production. This implies a drawdown of roughly 2.5 Mt from inventories.
Overall, the market remained positive on the demand side, but the faster increase in consumption compared with production resulted in a wider supply-demand gap.
September: demand remains the stronger side
September data shows a similar pattern, but with a clearer divergence between demand and supply.
-
Production: 13.5 Mt, up 1.9% YoY. The relatively slow increase reflects largely flat hot metal output, which capped growth from the BF-BOF route.
-
Consumption: 14.4 Mt, up 8.0% YoY. The much faster growth points to continued strength on the demand side.
-
Imports: 0.65 Mt, broadly stable YoY at +0.4%. While September imports were flat, cumulative imports rose 23.8% YoY to 4.14 Mt, showing that imports had a more significant role over the first six months of FY2026-27.
-
Exports: 0.56 Mt, down 3.8% YoY in September. However, April–September exports still increased 26.2% YoY to 3.55 Mt, indicating that the September decline was not enough to reverse the broader export trend.
Net imports
India remained a net importer of finished steel, with net imports at 0.59 Mt in April–September, compared with 0.54 Mt a year earlier and 0.093 Mt in September, compared with 0.068 Mt a year earlier. Net imports accounted for only around 0.7% of consumption over the six months and 0.6% in September, covering less than one-fifth of the 3.1 Mt demand-supply gap.
II. Crude Steel, Hot Metal and Finished Steel
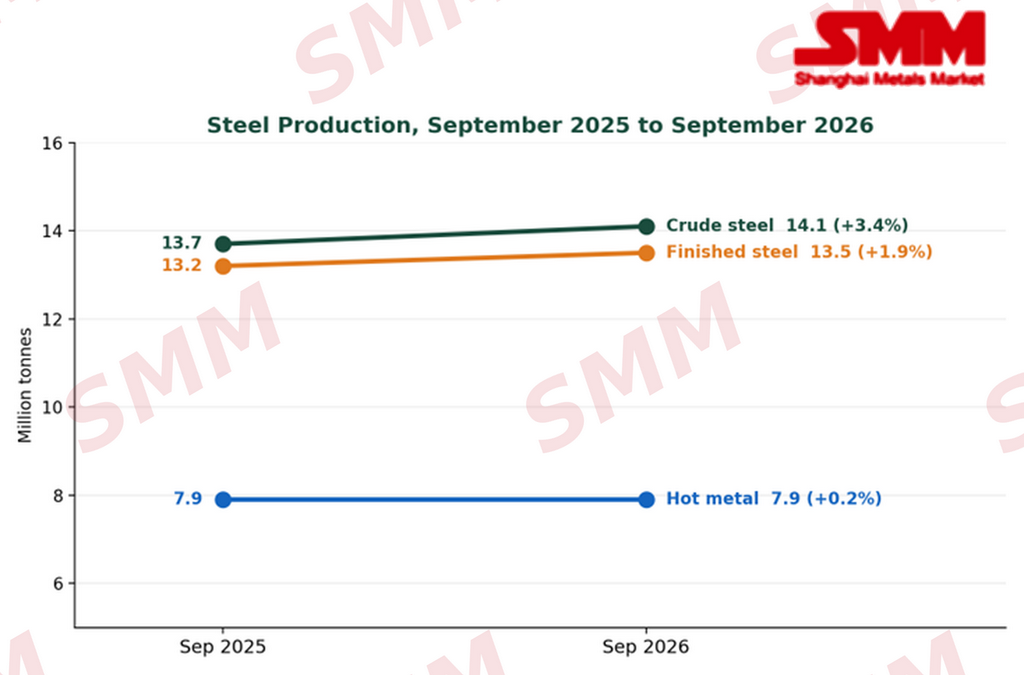
Steel production grew in September 2026, but growth was modest. Crude steel rose 3.4% YoY to 14.1 Mt (August: 4.6%). Finished steel rose 1.9% to 13.5 Mt (August: 3.2%). Hot metal was almost flat, up only 0.2% at 7.9 Mt (August: 3.5%).
-
Hot metal is the main constraint – Crude steel grew 3.4% while hot metal grew 0.2%, which suggests growth came mainly from non-hot-metal routes. Output stayed at 7.9 Mt, the same as last year. The top seven groups made 93% of April–September hot metal (44.8 of 48.3 Mt), so a slowdown at a few large plants can hold back total output.
-
India’s NMDC raises iron ore output in April–September – NMDC raised output by 8% YoY to 4.04 Mt in September from 3.75 Mt a year ago and by about 23% annually to 27.3 Mt in April–September from 22.2 Mt. As NMDC is only one supplier, its production trend provides an indication of supply conditions but does not represent the overall Indian market.
-
Scrap and Sponge Iron Costs Rise – Scrap and sponge iron are the main metallic inputs for induction furnace and electric arc furnace mills, which together accounted for about 56% of steel output in April–August (38.9% and 17.2%, respectively). Higher prices for both materials increase production costs. With hot metal output remaining almost flat, these routes are likely to remain important in meeting steel demand, potentially supporting demand for scrap and sponge iron. However, mills face margin pressure and are trying to pass on higher costs, while buyers remain price-sensitive.
-
Finished steel lagged crude steel in September – It grew 1.9% against 3.4% for crude. Over April–September, however, finished steel grew faster (3.7% vs 2.9%). The data does not explain the September gap.
III. Producers, Routes and States
Route, state and sponge iron data run through August, while company-level crude steel, finished steel and hot metal figures, along with overall production and consumption totals, run through September.
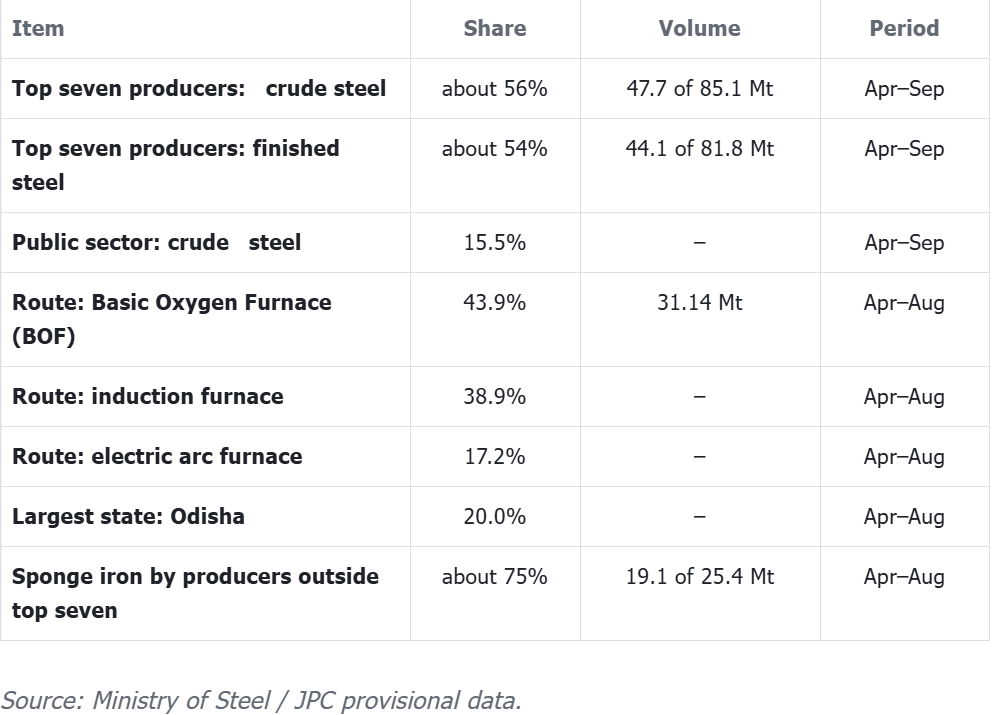
Because smaller producers make most of the sponge iron, slow sponge iron growth could matter more for them.
IV. Steel Prices
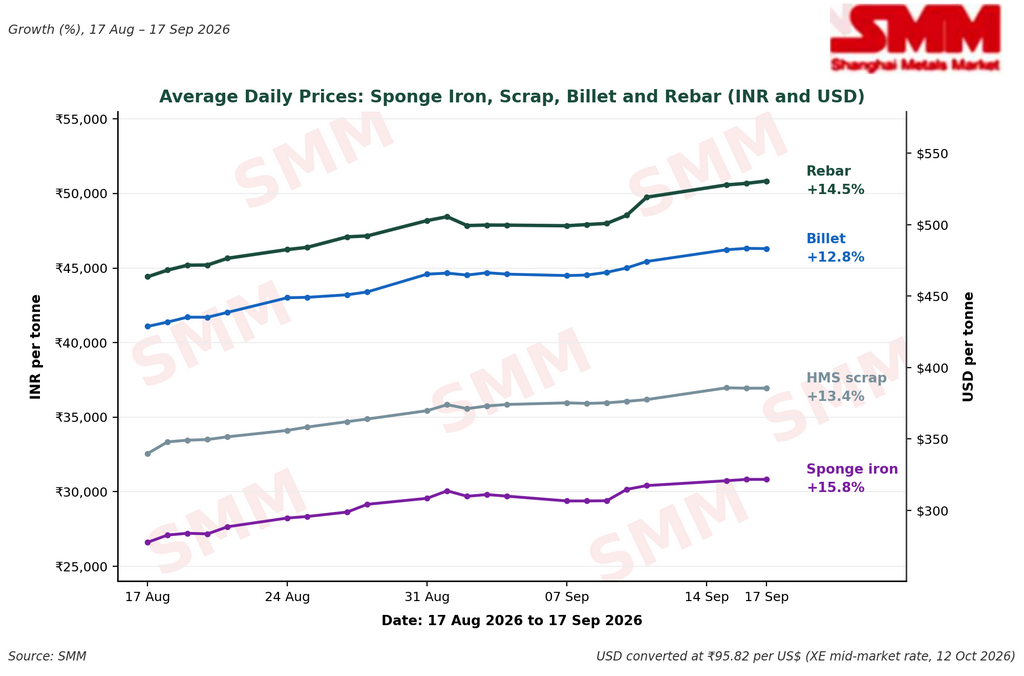
Steel prices rose across the production chain between August 17 and September 17, with scrap, sponge iron, billet and rebar gaining 12.8%–15.8%. Sponge iron recorded the highest increase at 15.8%, while billet saw the lowest at 12.8%.
Rebar prices rose from 464 USD/tonne (44,420 INR /tonne) on August 17 to 529 USD/tonne (50,675 INR/tonne) on September 17, respectively, using a single reference exchange rate of INR 95.82/USD (XE, 12 October 2026).
Key drivers behind the price increase
-
Higher raw material costs: Scrap and sponge iron prices moved higher first, increasing production costs for secondary steel mills. Billet and rebar producers were therefore under pressure to raise selling prices to protect margins.
-
Tighter material availability: Steel consumption has been growing faster than production, while hot metal output has increased only slightly. This has kept the availability of some raw materials and steel products relatively tight, giving sellers more support to maintain higher prices.
-
Power cuts and production disruptions: Power shortages in some steel-producing regions have affected furnace and rolling-mill operations. Lower operating rates can reduce spot availability and provide short-term support to prices.
-
Post-monsoon demand recovery: Construction and infrastructure activity has started to improve as the monsoon season ends. This has helped buying interest recover, particularly for rebar, although buyers remain cautious at higher price levels.
-
Restocking: Some traders and end-users have started replenishing stocks ahead of the busier construction period but in limited quantities. Buying remains mostly need-based rather than aggressive, as buyers are price-sensitive at higher levels.
-
Higher producer offers: Higher raw material and operating costs have encouraged mills to raise their offers. When producers and traders see limited availability, they are also less willing to reduce prices, which supports the overall market.
-
Rebar demand provided additional support: Rebar prices increased more than billet during the recent rally. This suggests that the price increase was not driven only by higher production costs; improving downstream demand and tighter finished-steel availability also played a role.
V. Official prices, September vs August average
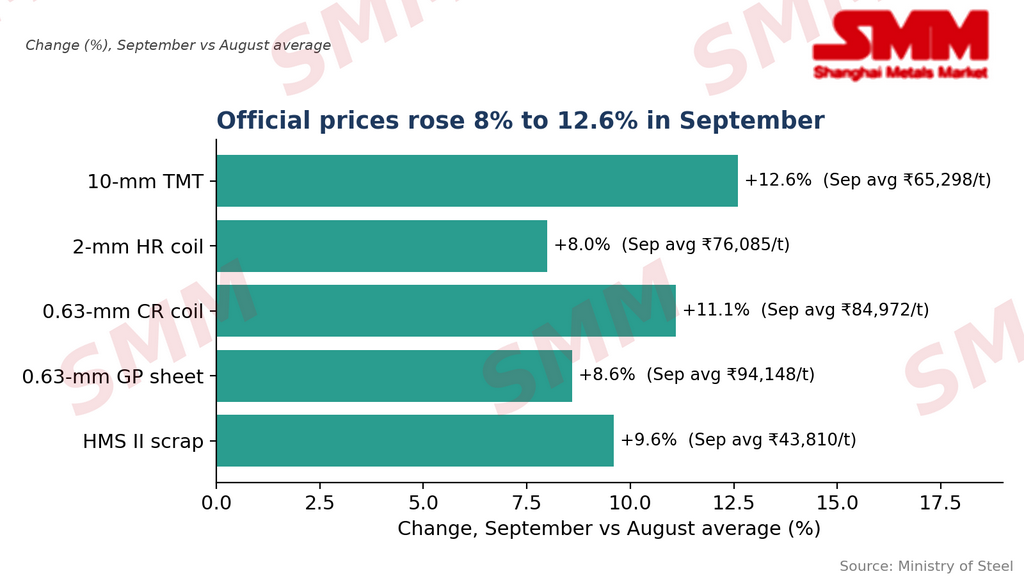
The Ministry of Steel’s official series, based on monthly average GST-inclusive prices across four cities includes Delhi, Mumbai, Kolkata and Chennai shows smaller increases of 8.0%–12.6%. The difference reflects the use of monthly averages rather than point-to-point prices. Steel prices include GST.
VI. Outlook
India’s steel market may remain supported in October, with consumption likely to stay healthy as construction and infrastructure activity improves after the monsoon. However, domestic production may need to increase further to keep pace with consumption, particularly as hot metal output remained almost flat in September. If production does not recover, relatively tight availability may continue to support domestic steel prices. Imports will also remain an important factor, as higher imports could improve domestic availability and limit price increases, while lower exports could have a similar effect.
![[SMM Steel Import & Export Analysis] September export orders improved; will steel exports continue to rise in October?](https://imgqn.smm.cn/usercenter/rKOND20251217171716.jpg)
![[PBOC: To conduct 700 billion yuan outright reverse repo operation on October 15 with a tenor of 6 months]](https://imgqn.smm.cn/usercenter/DpLok20251217171715.png)