India can almost match China's forecast demand loss in 2026. Whether that supports international steel prices depends on what India buys, how quickly its mills expand, and whether China's contraction stays contained.
India's emergence as a major source of steel demand growth raises a question with consequences well beyond the two countries: can its expanding market compensate for China's shrinking appetite? The answer depends on what “compensate” means. Replacing lost consumption in the global total is one test. Creating an equivalent market for internationally traded steel is another. Reproducing the scale and influence of China's steel-intensive development cycle is a much larger proposition.
India's Steel Demand Growth Nearly Offsets China's Decline
On the narrowest test, the numbers are strikingly close. Worldsteel's April outlook puts India's finished steel demand at 171.6 million tonnes in 2026, up from 159.8 million tonnes in 2025. China moves from 796.0 million tonnes to 784.1 million tonnes. India therefore adds 11.8 million tonnes against China's 11.9-million-tonne decline: a combined change of approximately minus 0.1 million tonnes, calculated from the published rounded levels.
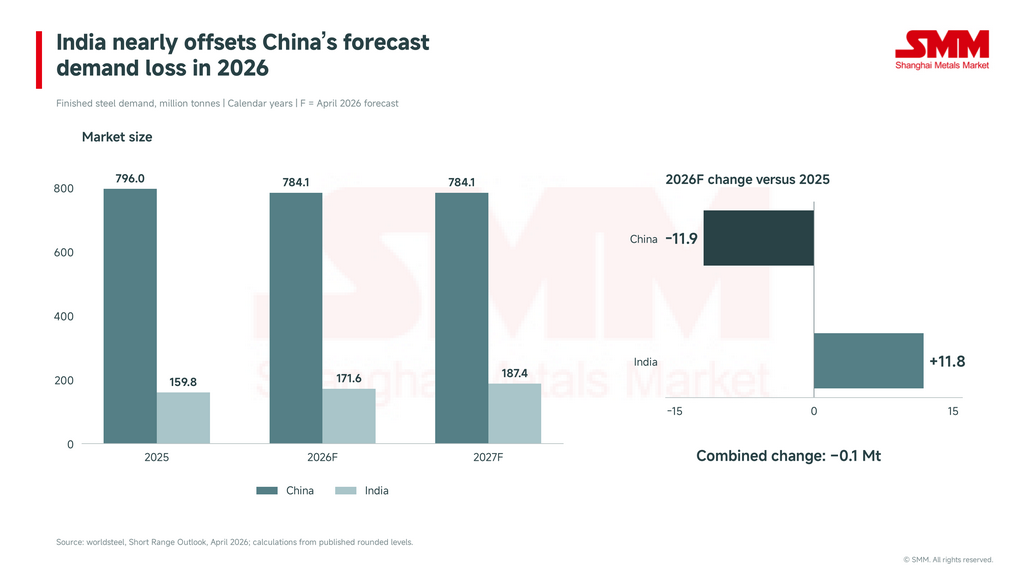
Figure 1. Strong percentage growth in a smaller market can offset a modest decline in a much larger one. This comparison concerns finished steel demand, not crude steel production.
That is a meaningful contribution to market stability. It is also a fragile balance. China remains roughly 4.6 times the size of India in the 2026 forecast. A small change in the Chinese trajectory can therefore absorb a substantial part of the Indian increase. The sensible interpretation is that India provides a significant counterweight to a contained Chinese slowdown. It does not yet make the global market insensitive to China.
The distinction matters for how the story is presented. Comparing India's 7.4% forecast growth with China's 1.5% decline makes the offset look overwhelming. Comparing the tonnes shows that almost the entire Indian gain is needed simply to neutralise the Chinese loss. A percentage point of growth has very different physical significance in the two markets.
The following table keeps the annual comparison on one consistent statistical basis. It also separates the contribution of the rest of the world, calculated as a residual, from the China–India pair.
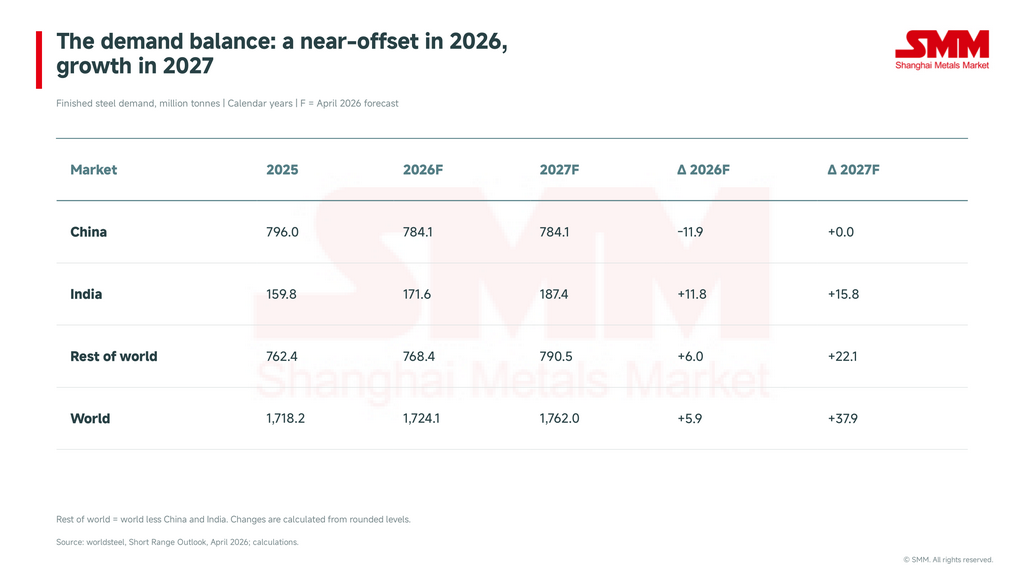
Figure 2. Calendar-year finished steel demand; 2026 and 2027 are April 2026 forecasts. Changes use rounded published levels. Rest of world is calculated rather than a separately quoted regional series.
China's Property Sector Remains Under Pressure, Casting Doubt on Demand Stabilisation
For 2027, the same forecast becomes more constructive because China stops declining while India continues growing. But that is an assumption to test against incoming evidence, rather than a result already secured. The outlook was published on 14 April and reflected information available by mid-March. Worldsteel explicitly tied its Chinese stabilisation view to the property correction largely running its course; it also highlighted uncertainty in the reported severity of China's 2025 demand decline.
Later property indicators justify caution. China's National Bureau of Statistics reported that new building starts fell 24.8% year on year in January–August 2026, while real estate development investment fell 19.9%. These are property measures, not estimates of total steel consumption, and cannot be substituted directly into a steel-demand forecast. They nevertheless show that an important steel-consuming activity remained under pressure well after the April outlook was prepared. China NBS, January–August property data
The relevant transmission is through the construction pipeline. New projects create requirements for structural materials; projects already under way can continue consuming steel even when starts weaken. Changes in project timing, building design and materials intensity prevent a fixed conversion from floor space to steel tonnage. Manufacturing and infrastructure also influence the aggregate. Consequently, weak starts are a reason to scrutinise the demand baseline, rather than proof that steel consumption must fall at the same rate.
Infrastructure and Manufacturing Drive India's Steel Demand Growth
India's growth has a broader set of reported drivers. Worldsteel identifies infrastructure-led construction, automotive activity, capital goods, rail development and consumer durables as supports. Worldsteel's India assessment. For market participants, the next question is how these end uses translate into orders for particular products. Reinforcement steel for a construction project, qualified automotive sheet and electrical steel for equipment are different commercial markets, even when all contribute to the same national demand total.
There is encouraging evidence in India's more recent consumption figures. The Ministry of Steel's 6 October release shows finished steel consumption rising from 79.0 million tonnes to 84.9 million tonnes in April–September 2026, a reported increase of 7.5%. These provisional fiscal-half-year observations cover a different period from Worldsteel's calendar-year forecast. They support the picture of continuing growth without establishing the final 2026 outcome. Ministry of Steel / PIB, first-half update
Rising Consumption Does Not Guarantee Higher Imports as India's Steel Trade Diverges
For foreign mills, however, consumption growth is only the beginning of the assessment. Additional Indian demand can be supplied by domestic production, reduced exports, imports or changes in stocks. It need not become a matching increase in purchases from abroad. A strong domestic market can improve sales opportunities for Indian producers while having a much smaller effect on the net international steel balance.
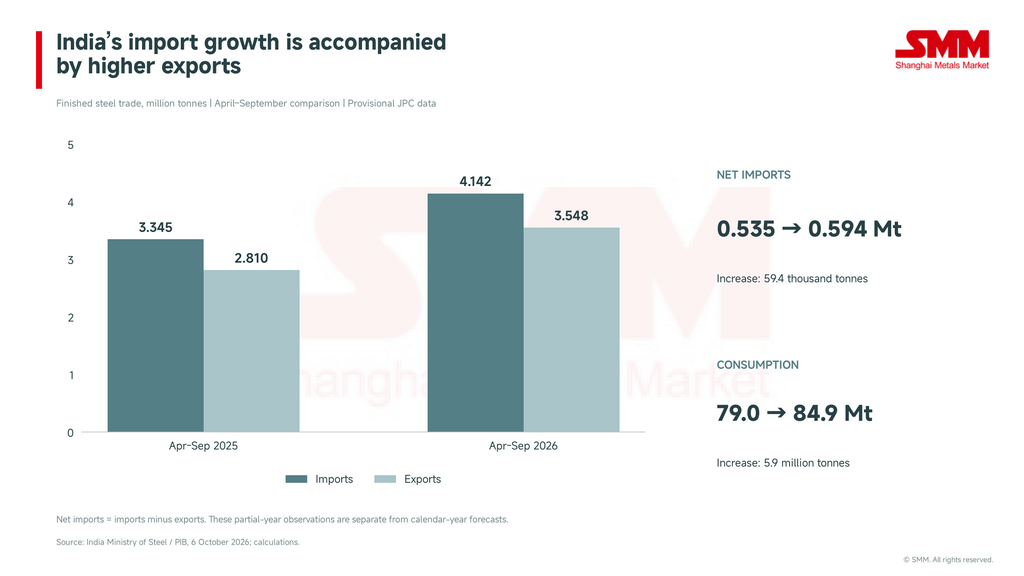
Figure 3. Both trade flows expanded in April–September 2026. Their difference changed much less than consumption. This is a comparison of indicators, not a complete supply-and-use reconciliation.
The trade arithmetic illustrates the distinction. April–September imports increased from 3.3448 million tonnes to 4.1418 million tonnes, while exports rose from 2.8102 million tonnes to 3.5478 million tonnes. Net imports consequently widened from 0.5346 million tonnes to 0.5940 million tonnes—an increase of just 59,400 tonnes.
This does not mean overseas suppliers found no opportunities: gross imports clearly increased. It means India was simultaneously selling more steel abroad. An exporter assessing possible sales into India should examine gross imports by product and customer. An analyst assessing whether India is absorbing a global surplus should also examine exports. Those two questions cannot be answered with the consumption growth rate alone.
Nor should the headline statistics be forced into an inventory calculation. Production, trade and consumption need matching definitions and adjustments before they form a complete material balance. The figures presented here do not establish how much steel was drawn from or added to stocks. Assigning their residual entirely to inventories would create precision the available evidence does not support.
Product detail makes the commercial picture clearer. An earlier Ministry release provides comparable import and export figures for selected categories in April–July 2026. Hot-rolled coil and strip recorded net imports of 173,700 tonnes, while bars and rods recorded net exports of 95,100 tonnes. The table below uses that shorter period explicitly; it is not a breakdown of the April–September totals.
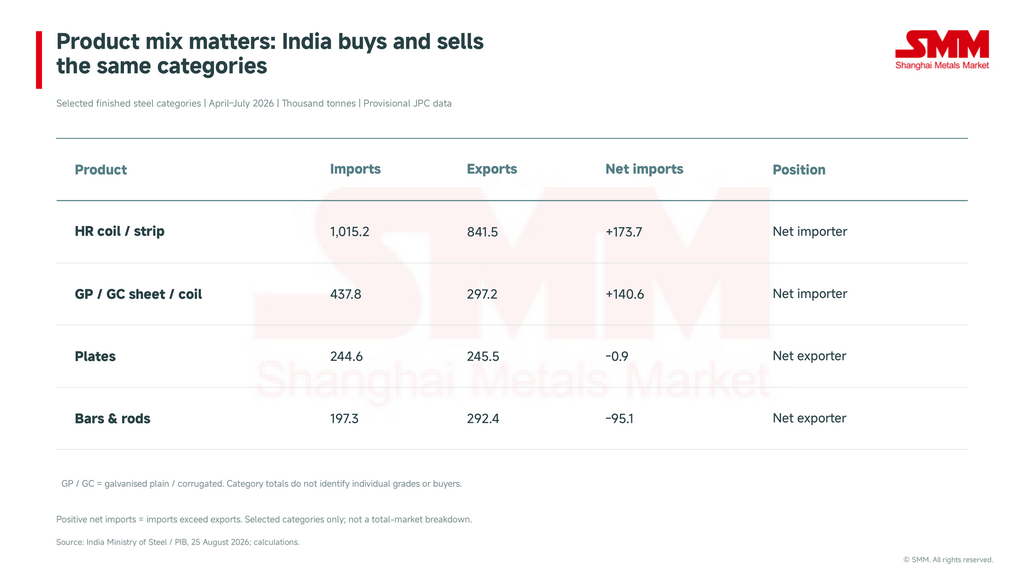
Figure 4. Selected categories with both flows reported. The table does not cover all products, and broad categories conceal differences in grades, dimensions and customer approvals.
These simultaneous flows are commercially plausible. A country can export one specification and import another within the same category. Freight economics, delivery windows, mill availability and qualification requirements can also separate buyers into distinct markets. The national net position is therefore useful context, but it is an incomplete guide to a particular mill's prospects. The relevant opportunity is the grade a buyer needs at an achievable delivered price and delivery date.
Domestic Capacity Expansion Could Reshape India's Steel Import Requirements
Domestic supply is also responding to the opportunity. In its FY2025–26 annual report, JSW describes a consolidated crude steel capacity base of 33.4 million tonnes a year and a target of 50.3 million tonnes by FY2029–30, with joint-venture capacity discussed separately. The company also describes investment in electrical steel technology and manufacturing. These are company-reported capacities and plans, not guaranteed additional finished steel output.
The implication is that Indian demand growth and Indian supply growth must be assessed together. New capacity can serve domestic customers, displace imports or eventually support exports. The outcome depends on commissioning, ramp-up, product capability and cost. Announced crude steel capacity should not be subtracted directly from a finished steel demand forecast: the measures differ, and nameplate capacity is not the same as saleable output.
China's Demand Remains the Key Variable: Can India Support Global Steel Prices?
This leaves the Chinese trajectory as a critical variable. A simple sensitivity test holds India's forecast increment at 11.8 million tonnes and changes only the assumed decline in Chinese demand from its 2025 base. It is a mechanical scenario, not a replacement for worldsteel's forecast.
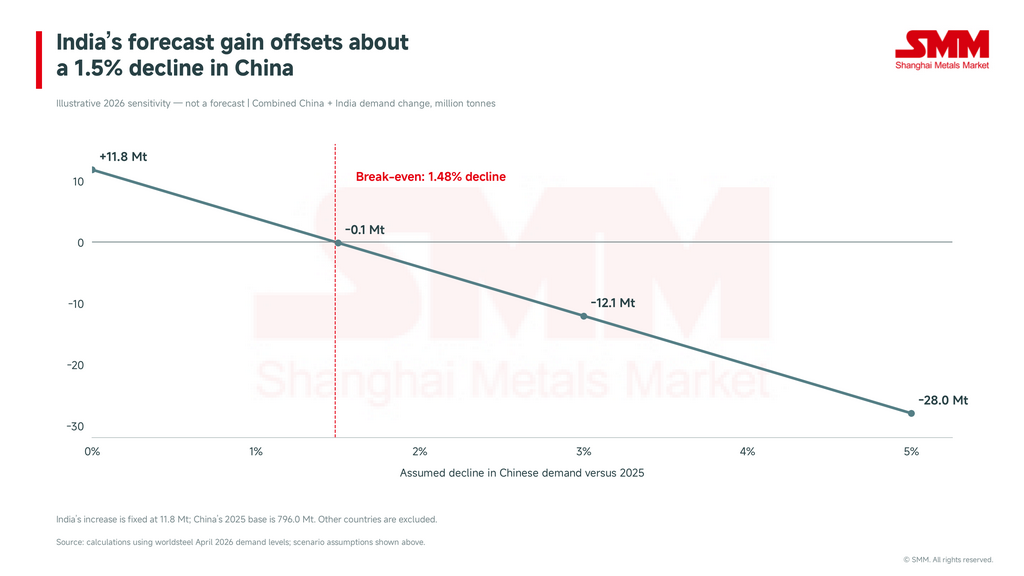
Figure 5. Combined change = 11.8 − (796.0 × assumed Chinese decline). The percentage input is expressed as a fraction in the calculation. Other markets are excluded.
The break-even Chinese decline is approximately 1.48%. At a 3% decline, China would lose about 23.9 million tonnes, leaving the pair approximately 12.1 million tonnes lower despite India's increase. Conversely, a stable Chinese market would allow the Indian gain to contribute fully to combined growth. This asymmetry is the main reason the property and manufacturing indicators in China remain important even as India's role expands.
For producers and traders, three practical tests follow. First, monitor whether Indian growth persists in physical deliveries to end users rather than relying only on broad economic narratives. Second, track supply additions by their actual commissioning and product readiness. Third, compare import and export flows for the relevant steel grade, alongside freight, delivery terms and applicable market-access requirements. A favourable national demand trend cannot substitute for that commercial work.
The evidence supports a qualified answer to the original question. India can nearly offset the Chinese demand loss embedded in the April 2026 forecast, and subsequent Indian observations confirm continued consumption growth. But the offset is sensitive to a deeper Chinese contraction, and it does not translate automatically into an equally large outlet for foreign steel. India’s expanding market deserves increasing weight in global analysis. Its ability to support international prices will be determined jointly by demand, domestic supply and the products that actually cross its borders.
![[SMM Analysis] What does CBAM add to a tonne of steel? SMM's International Steel CBAM Calculator answers in three steps](https://imgqn.smm.cn/usercenter/ocJKj20251217171717.jpg)
![[Shanghai New Home Transactions Double YoY During National Day Holiday]](https://imgqn.smm.cn/usercenter/wSpkX20251217171718.png)