Introduction: Congo as the King of Coltan
Coltan is the common name for mineral concentrates containing columbite and tantalite. Tantalum recovered from these minerals is used in electronic capacitors, high-temperature alloys and other applications where reliability matters. The DRC is central to this market. The US Geological Survey described the country as the world’s leading tantalum producer in 2024, with an estimated 51% of global mine output. [1]
That leadership needs one important qualification: coltan tonnage and contained tantalum are not the same measure. A tonne of concentrate contains gangue, moisture and different amounts of tantalum and niobium. Production, export and trade figures therefore cannot be compared safely unless their definitions, grades and reporting dates match.
This article uses the harmonised and consolidated Ministry data supplied for 2025. It provides the detailed monthly, provincial and destination series, but it is not the only official view. Other government releases publish different totals. Rather than hiding that conflict, this analysis treats it as part of the whole market story.
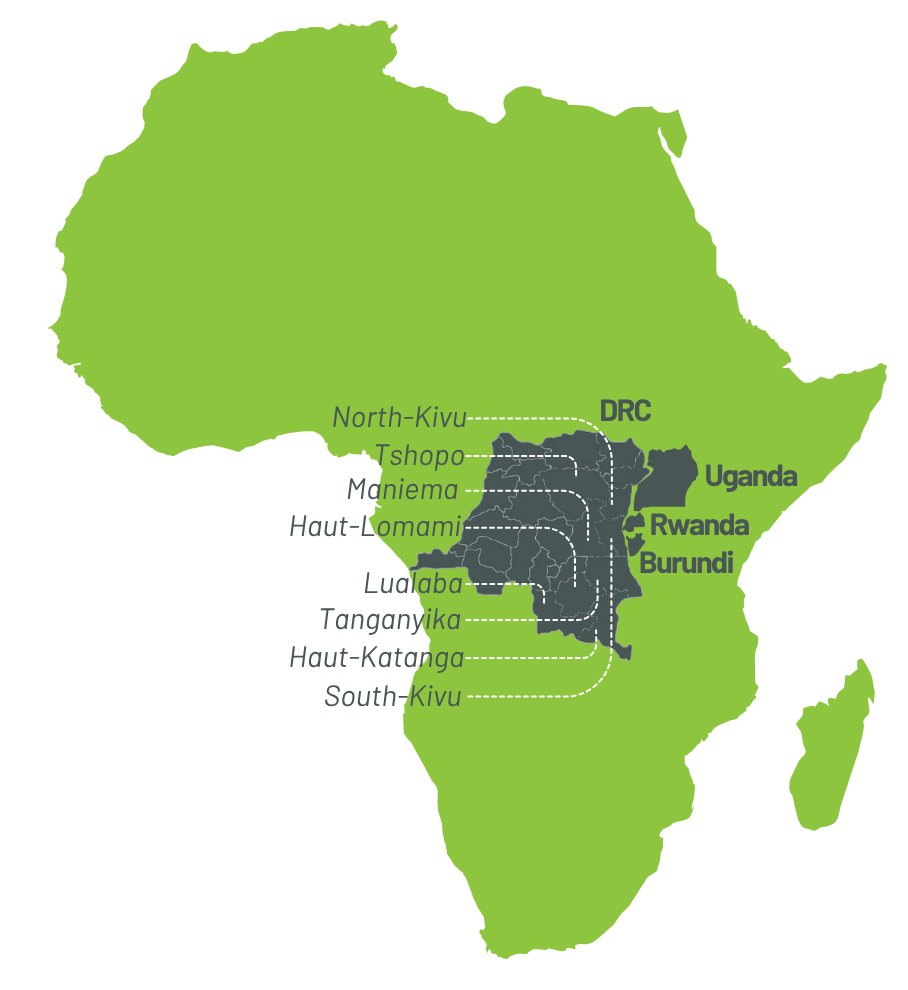
Map of the DRC highlighting Tanganyika, Maniema, Haut-Lomami, South Kivu and North Kivu. - ITSCI
Production Structure: Artisanal Mining Dominates Supply
The harmonised data puts 2025 coltan production at 1,434.17 tonnes. Artisanal production accounts for 1,263.15 tonnes, or 88.1%, while industrial production contributes 171.02 tonnes, or 11.9%. In plain terms, almost nine out of every ten reported kilograms came from artisanal supply chains rather than large mechanised mines. [2]
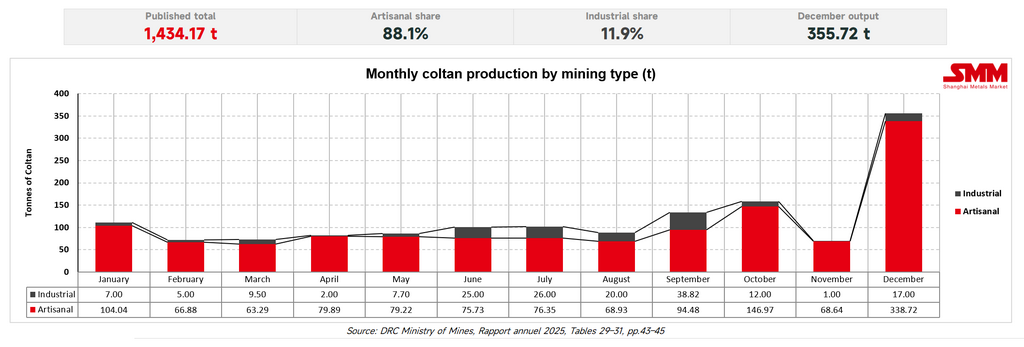
Production was also back-loaded. December alone contributed 355.72 tonnes, equal to 24.8% of the published annual total. The fourth quarter supplied 584.33 tonnes, or 40.7%, while the second half supplied 908.90 tonnes, or 63.4%. The jump may reflect stronger mine output, material accumulated earlier reaching the formal reporting chain, late submissions or a combination of these factors.
Artisanal does not automatically mean illegal or untraceable. It describes the production model. However, thousands of small transactions are harder to finance, inspect and record than output from a few large plants. That makes buying-centre coverage, transparent grading, site safety and reliable recordkeeping central to any formalisation policy.
Provincial and Company Concentration
Three provinces dominate the reported total. Tanganyika produced 600.75 tonnes, or 41.9%; Maniema produced 446.42 tonnes, or 31.1%; and Haut-Lomami produced 348.74 tonnes, or 24.3%. Together they supplied 97.3% of the national figure. South Kivu contributed 37.84 tonnes and North Kivu just 0.42 tonnes in this table set. [2]
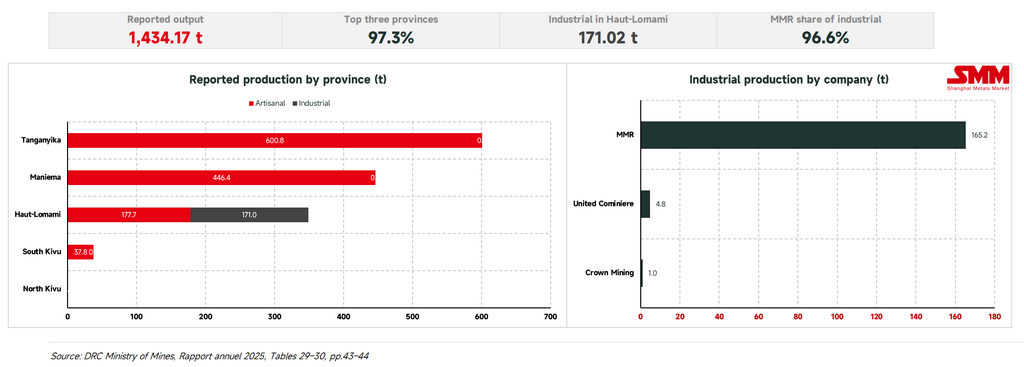
Industrial production was even more concentrated. Mining Mineral Resources, or MMR, accounted for 165.20 tonnes, equal to 96.6% of the industrial total. United Cominiere produced 4.82 tonnes and Crown Mining 1.00 tonne. All industrial output was reported in Haut-Lomami.
Concentration has two sides. It can make oversight more practical because regulators know where most volumes pass. It also means that disruption in a small number of provinces, roads, buying centres or companies can move the national total sharply. A province of export should not be assumed to be the province of mine origin: official reporting notes that some material from North and South Kivu is channelled through Maniema and Tanganyika. [3]
Export Volumes, Values, Destinations and Price Signals
The provincial exports record shows 1,018.11 tonnes worth US$23.70 million, implying an average value of about US$23,274 per tonne. That volume is roughly 71% of the 1,434.17-tonne production total. The difference should not be read automatically as missing exports. Production and shipments can fall in different periods, while inventories, losses, moisture, grade and reporting coverage can also separate the two series. [2]
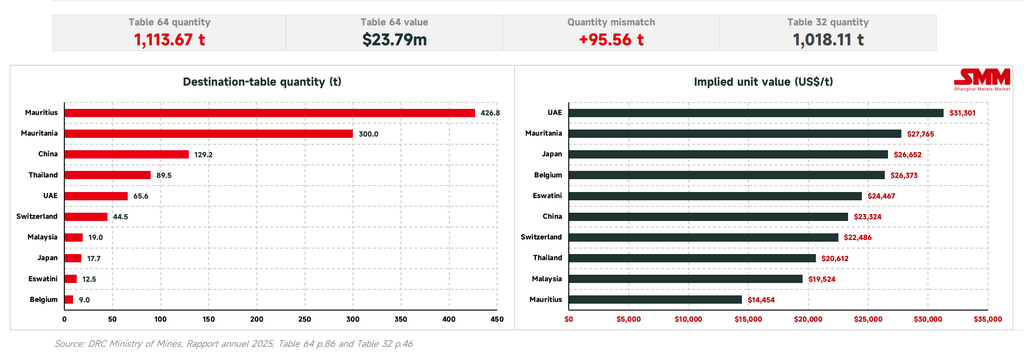
Haut-Katanga and Tanganyika together accounted for 941.88 tonnes, or 92.5% of the provincial export quantity. Mauritius and Mauritania received a combined 726.75 tonnes, or 65.3% of listed volume. A named destination is not necessarily the final consumer: trading, storage, transit and re-export can place an intermediary country in the data.
The implied unit values range from about US$14,454 per tonne for Mauritius to US$31,301 for the United Arab Emirates. This spread is a signal to investigate, not proof that one buyer paid twice as much for the same material. Coltan parcels can differ greatly in tantalum and niobium content. A tantalum metal benchmark is also not a direct price for concentrate.
Most importantly, the two export tables do not reconcile. The destination table totals 1,113.67 tonnes and US$23.79 million, which is 95.56 tonnes and US$98,526 above the provincial table. The gap may be attributed to decimal rounding and other errors.
Formalisation, Traceability and Better Statistics
Traceability is often discussed as a security or compliance issue. It is also basic market infrastructure. A buyer needs to know where a parcel came from, a regulator needs to know whether tax and export rules were followed and an analyst needs to know whether the same tonne appears once or more than once across production and export tables.
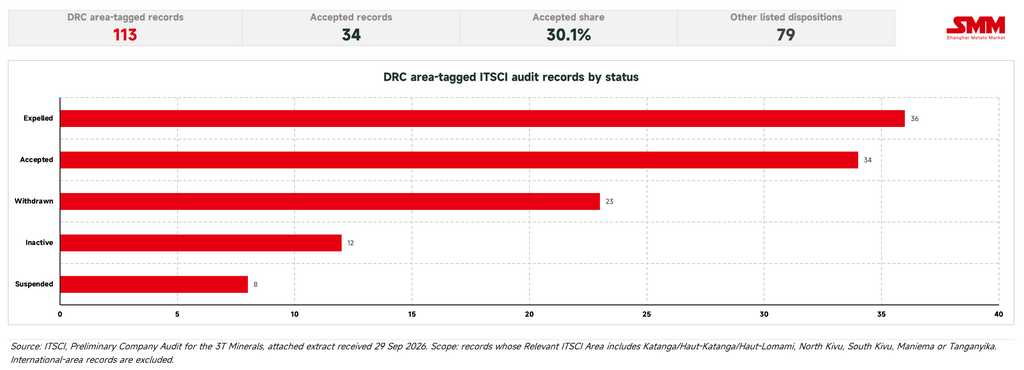
The traceability chart must be read narrowly. It describes the status distribution of DRC area-tagged records in the ITSCI participation list. It does not show what share of Congo’s 2025 coltan was traced. Company counts give every record the same weight, whether it handled one tonne or one hundred. The next useful disclosure would be verified tonnage by site, chain and audit status. [4]
The official production record also needs reconciliation. The harmonised tables used in the charts report 1,434.17 tonnes. The Secretariat-General of Mines’ 2025 annual activities report publishes 1,184.978 tonnes and classifies all of it as artisanal or semi-industrial. For exports, the harmonised provincial table reports 1,018.11 tonnes, the harmonised destination table 1,113.67 tonnes and the Secretariat-General report gives both 891.31 tonnes in its export table and 1,180.99 tonnes in a comparison table. The national statistics portal displays 1,018.112 tonnes for coltan in 2025, but labels the series as production. [2, 3, 5]
These differences do not by themselves prove smuggling, fraud or double counting. Possible causes include different cut-off dates, revisions, definitions, provincial coverage, routing and transcription. None has been verified for every gap. The practical answer is a single shipment identifier linking mine or buying site, trader, processor, province, export post and destination. Each revised release should carry a version number and a short reconciliation note.
Formalisation must also work for miners. Predictable licensing, competitive and transparent buying prices, access to finance and equipment and credible safety support can make legal channels more attractive. Enforcement matters, but a system that is costly or slow will keep creating incentives for side deals and off-record trade.
Conclusion and Outlook
The DRC’s place at the centre of the global tantalum market is not in doubt. The 2025 data shows why: artisanal miners supply most reported coltan and three provinces account for nearly all recorded production. It also shows where the market is fragile. Industrial output is dominated by one firm, export flows are concentrated through a few provinces and destinations and implied values vary too widely to treat them as a single market price.
The biggest analytical finding is not one production number. It is that several official numbers coexist for the same year. Congo will capture more value from coltan when formalisation improves both livelihoods and records. The test is simple to state, even if difficult to build: one tonne should be traceable from the mine or buying centre to the processor, export declaration and destination without changing identity or being counted twice. For 2026 and beyond, higher-quality statistics would make production trends, tax receipts, responsible-sourcing claims and investment decisions easier to trust.
References
[1] US Geological Survey, Congo (Kinshasa), country mineral-industry page, 26 June 2026. https://www.usgs.gov/centers/national-minerals-information-center/congo-kinshasa
[2] DRC Ministry of Mines, harmonised/consolidated Statistiques minières, exercice 2025, Tables 29–32, 61 and 64; source data used for the SMM charts. Official statistics portal: https://mines.gouv.cd/statistique/pdf
[3] Secretariat-General of Mines, Rapport annuel d’activités, exercice 2025, published 26 June 2026. https://sg-mines-rdc.cd/wp-content/uploads/simple-file-list/Statistiques/RAPPORT-ANNUEL-DACTIVITES-EXERCICE-2025.pdf
[4] ITSCI, Online Participation List, 22 September 2026. https://www.itsci.org/wp-content/uploads/2023/03/407-Online-Participation-List-22.09.26.xlsx
[5] Institut National de la Statistique, Mines & pétrole data portal, 2020–2025 series, version 13-03-26-vf. https://www.ins.gouv.cd/statistiques/mines-petrole
[6] Secretariat-General of Mines, Rapport analytique du Pool Statistiques, exercice 2025, published 26 June 2026. https://sg-mines-rdc.cd/wp-content/uploads/simple-file-list/Statistiques/RAPPORT-ANALYTIQUE-DU-POOL-STATISTIQUES-EXERCICE-2025.pdf
[7] US Geological Survey, Mineral Commodity Summaries 2026, Tantalum. https://pubs.usgs.gov/periodicals/mcs2026/mcs2026-tantalum.pdf
![[SMM Chromium Flash] Odisha Blockade Threat Over Mining Law Puts India's Chromite Hub at Risk](https://imgqn.smm.cn/usercenter/aNMzb20251217171724.jpg)
![[Flash | Antofagasta's Centinela Faces Strike Threat Over Labor Dispute]](https://imgqn.smm.cn/usercenter/wUnEn20251217171722.jpeg)
![[SMM Chromium Flash] Kazchrome Earns EcoVadis Silver Medal, Ranks in Top 15% Globally on Sustainability](https://imgqn.smm.cn/usercenter/eGQFu20251217171723.jpeg)