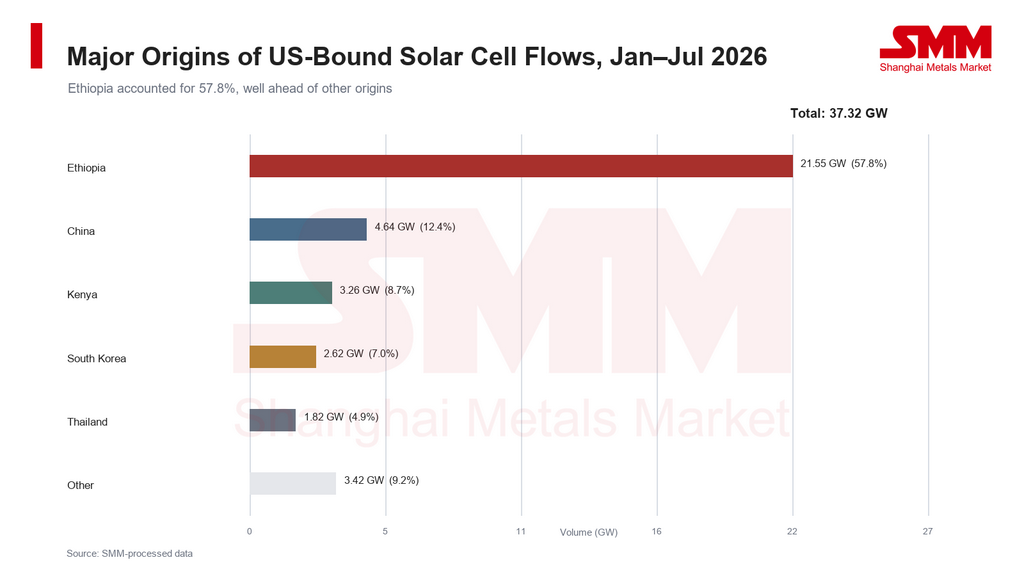
The origin mix of solar cell flows into the US shifted sharply in 2026. SMM analysis of global solar cell trade-flow data shows that approximately 37.32 GW of cells moved into the US market in January–July. Ethiopia supplied about 21.55 GW, or 57.8% of the total, far exceeding China, Kenya, South Korea and Thailand. On a cumulative basis, Ethiopia was therefore the largest origin in this dataset.
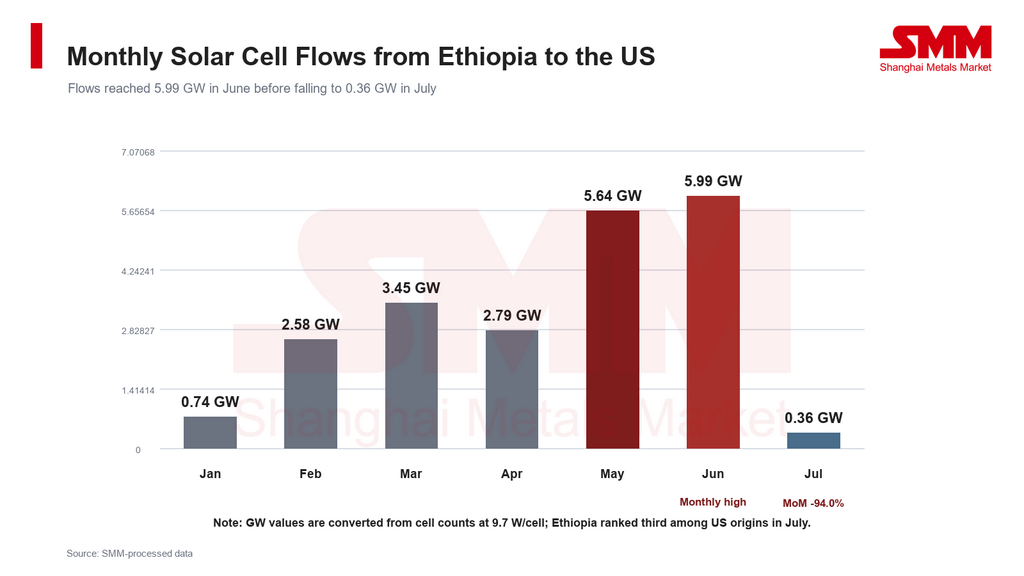
The latest monthly data, however, point to a different trend. Ethiopia-to-US flows reached 5.99 GW in June before plunging to 0.36 GW in July, a month-on-month decline of about 94.0%. Ethiopia consequently fell behind China and Kenya in the monthly ranking. Although Ethiopia has already reshaped the cumulative US solar cell sourcing mix, its supply advantage has yet to stabilize. Export schedules at individual suppliers and changes in US trade policy will be key variables for subsequent flows.
Ethiopia supplied nearly 60% of US-bound flows in January–July
Solar cell flows into the US totaled approximately 37.32 GW in January–July 2026. Ethiopia ranked first at 21.55 GW, accounting for 57.8% of the total. China, Kenya, South Korea and Thailand supplied approximately 4.64 GW, 3.26 GW, 2.62 GW and 1.82 GW, representing shares of 12.4%, 8.7%, 7.0% and 4.9%, respectively. The five leading origins together accounted for more than 90%, indicating that US solar cell sourcing remained highly concentrated.
 Ethiopia's rise was not driven by a single exceptional month. Monthly flows increased from around 0.74 GW in January to 2.58 GW in February and remained between 2.79 GW and 3.45 GW in March–April. They then climbed to 5.64 GW in May and 5.99 GW in June. Ethiopia was the largest monthly source for five consecutive months from February through June, and its share of US-bound flows reached 69.0% in June.
The release of local manufacturing capacity supported this growth. TOYO has disclosed that its Ethiopian solar cell facility has 4 GW of nameplate capacity and reached full production in October 2025. The company is also developing module manufacturing capacity in Texas, creating an increasingly integrated cross-regional supply chain linking Ethiopian cells with US module production. Trade data also identify Origin Solar, Lumintech Solar and Gobez Electric as Ethiopian exporters, showing that the country's US supply base is not wholly dependent on a single producer.
Supplier concentration amplified the July decline
Despite Ethiopia's strong cumulative lead, its July flow to the US fell rapidly to 0.36 GW, down by about 5.63 GW from June. In the same month, flows from China and Kenya were approximately 0.86 GW and 0.79 GW, placing them first and second, respectively. Ethiopia's share of monthly US-bound flows fell from 69.0% in June to 15.2% in July.
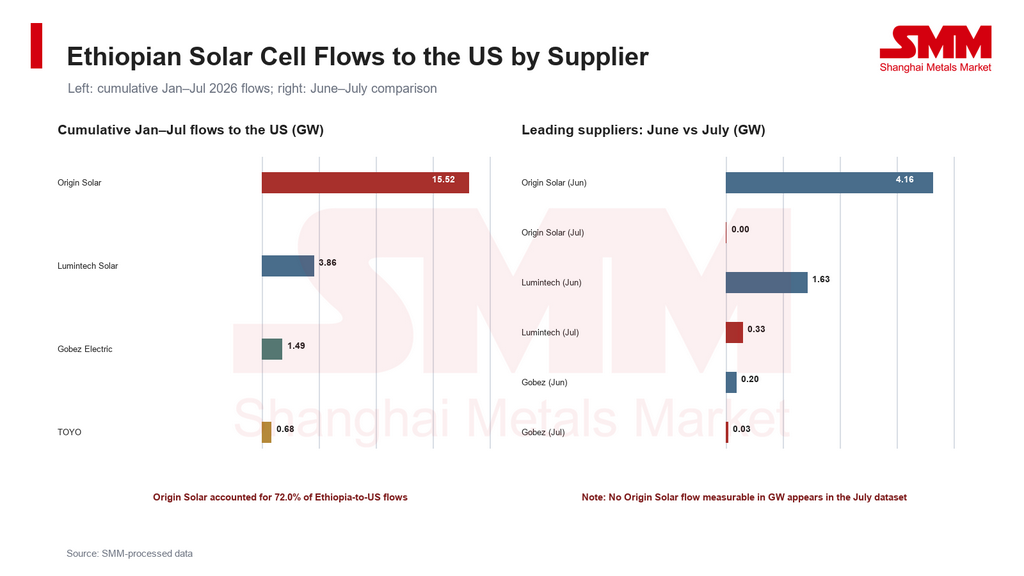
 Company-level data show that the decline was highly concentrated. Origin Solar supplied approximately 15.52 GW to the US in January–July, equal to about 72.0% of Ethiopia's total. Its June flow was about 4.16 GW, but no July flow measurable in GW appears in this dataset. Lumintech Solar fell from approximately 1.63 GW in June to 0.33 GW in July, while Gobez Electric declined from 0.20 GW to 0.03 GW. Lower flows from the leading suppliers therefore directly explain most of Ethiopia's overall July contraction.
 The July decrease should not automatically be interpreted as an equivalent drop in US end-market demand. Possible explanations include differences between order and shipping schedules, temporary production or inventory adjustments, and changes in importers' risk appetite after the start of the trade investigation. These factors still need to be tested against company production schedules, US arrival data and inventory levels.
US trade barriers are extending to new origins
Ethiopia's rapid entry into the US solar cell market coincided with a continuing shift in US sourcing. Solar products from China and Taiwan, China have long been subject to US antidumping and countervailing duty measures, and the US subsequently extended trade remedies to Southeast Asia. In September 2026, the US Department of Commerce also issued affirmative final antidumping and countervailing duty determinations covering solar cells from India, Indonesia and Laos. Higher policy costs for established origins have encouraged US module manufacturers to seek new sources of cells.
New origins are now facing scrutiny as well. On July 17, 2026, the US Department of Commerce initiated a country-wide anti-circumvention inquiry covering Ethiopia. The inquiry includes cells and modules completed in Ethiopia using Chinese parts or components and then exported directly to the US. It also covers cells completed in Ethiopia, assembled into modules in Vietnam and subsequently exported to the US.
Unless the inquiry is rescinded or extended, Commerce intends to issue a preliminary determination within 150 days of initiation and a final determination within 300 days. Ethiopia's future access to the US market will therefore depend partly on whether its production can demonstrate sufficient local processing and whether the origin of materials, investment scale, manufacturing steps and value added meet US origin-review requirements.
The initiation of an inquiry does not constitute a finding of circumvention, nor does it mean that all Ethiopian products immediately become subject to the duty rates applied to Chinese solar products. Before a decision is issued, however, US importers may tighten supply-chain due diligence, adjust purchasing schedules or diversify orders. Additional monthly data will be needed to determine whether Ethiopia's July decline was connected to this policy milestone.
Kenya may capture part of the redirected demand
While Ethiopia's flow declined in July, Kenya still supplied about 0.79 GW to the US, second only to China. Kenya's cumulative flow to the US reached approximately 3.26 GW in January–July, accounting for about 53.0% of its total solar cell exports. Monthly Kenya-to-US flows increased from 0.10 GW in April to 0.87 GW in May and 1.46 GW in June. Although the figure eased in July, it remained relatively high at 0.79 GW.
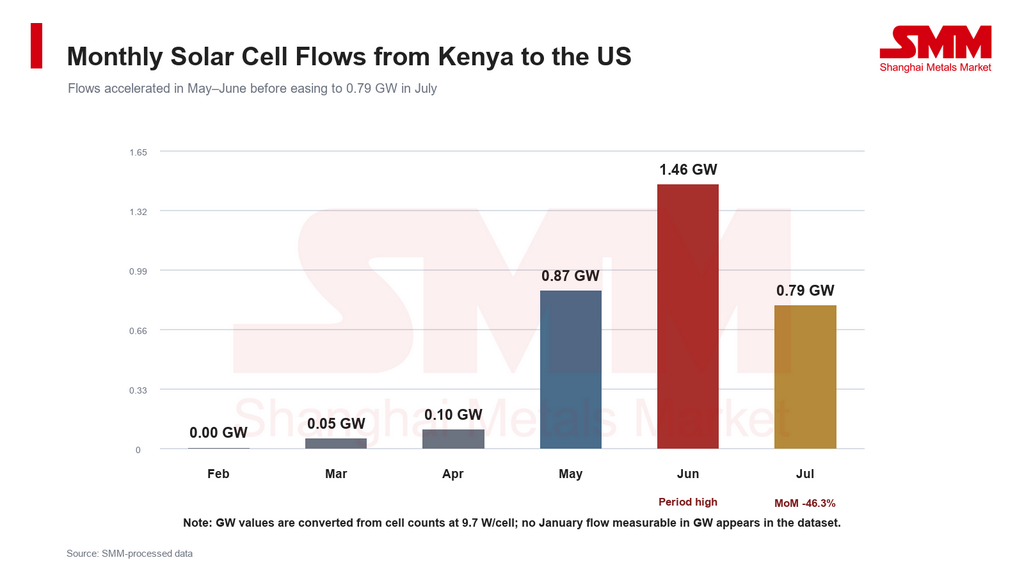 The data suggest that Africa's growing role in the US solar cell supply chain is not limited to Ethiopia. As importers seek to reduce concentration risk and US trade remedies expand, emerging production locations such as Kenya could receive part of the redirected demand. Moving production to another country, however, does not automatically eliminate trade risk. In an anti-circumvention inquiry, Commerce may examine the origin of upstream inputs, whether local processing constitutes substantial production, and whether participating companies are affiliated.
For Chinese cell and wafer producers, the shift in supply chains does not necessarily mean the underlying demand disappears. Demand may move from direct exports to the US toward sales of wafers, auxiliary materials and equipment to cell facilities in third countries. As US reviews increasingly extend to upstream materials and processing steps, overseas facilities may face stronger requirements for non-Chinese inputs, origin documentation and traceability. Their procurement structures could change accordingly.
Outlook: Ethiopia retains the cumulative lead, but monthly rankings may remain volatile
SMM expects Ethiopia to remain an important source of solar cells for the US in the short term, supported by installed cell capacity, established US customers and related module manufacturing. The July data nevertheless show that supply is concentrated among a small number of companies. Changes in one supplier's production, orders or customs clearance can therefore create significant fluctuations in the country's monthly flow.
Three variables merit close attention over the coming months: whether Origin Solar, Lumintech Solar and TOYO restore production and shipments to the US; the selection of respondents, preliminary determination and potential retroactive scope of the US anti-circumvention inquiry; and whether Kenya, China or other origins continue to capture demand from US module producers.
If Ethiopia-to-US flows recover in August–September, the July decline would be more consistent with shipping schedules or temporary company-level adjustments. If flows remain low while Kenya and other origins continue to grow, the data could point to a second shift in the US solar cell sourcing landscape. SMM will continue to monitor US trade policy, production schedules at major suppliers and cross-regional solar cell flows.
![[SMM Analysis] China Solar Settlement Prices Diverged in H1 2026 as Timing and Seasonality Reshaped Revenue](https://imgqn.smm.cn/usercenter/kuMAH20251217171739.jpg)
![Tariffs Mount, Market Access Tightens: Can US Solar Keep Growing? [SMM Analysis]](https://imgqn.smm.cn/usercenter/CpbPE20251217171736.jpg)
![High-Power Demand Improves, but Weak Orders Keep Global PV Module Prices Rangebound [SMM Analysis]](https://imgqn.smm.cn/production/admin/votes/imageswRRpR20260918163233.png)