SMM News, August 24, 2026:
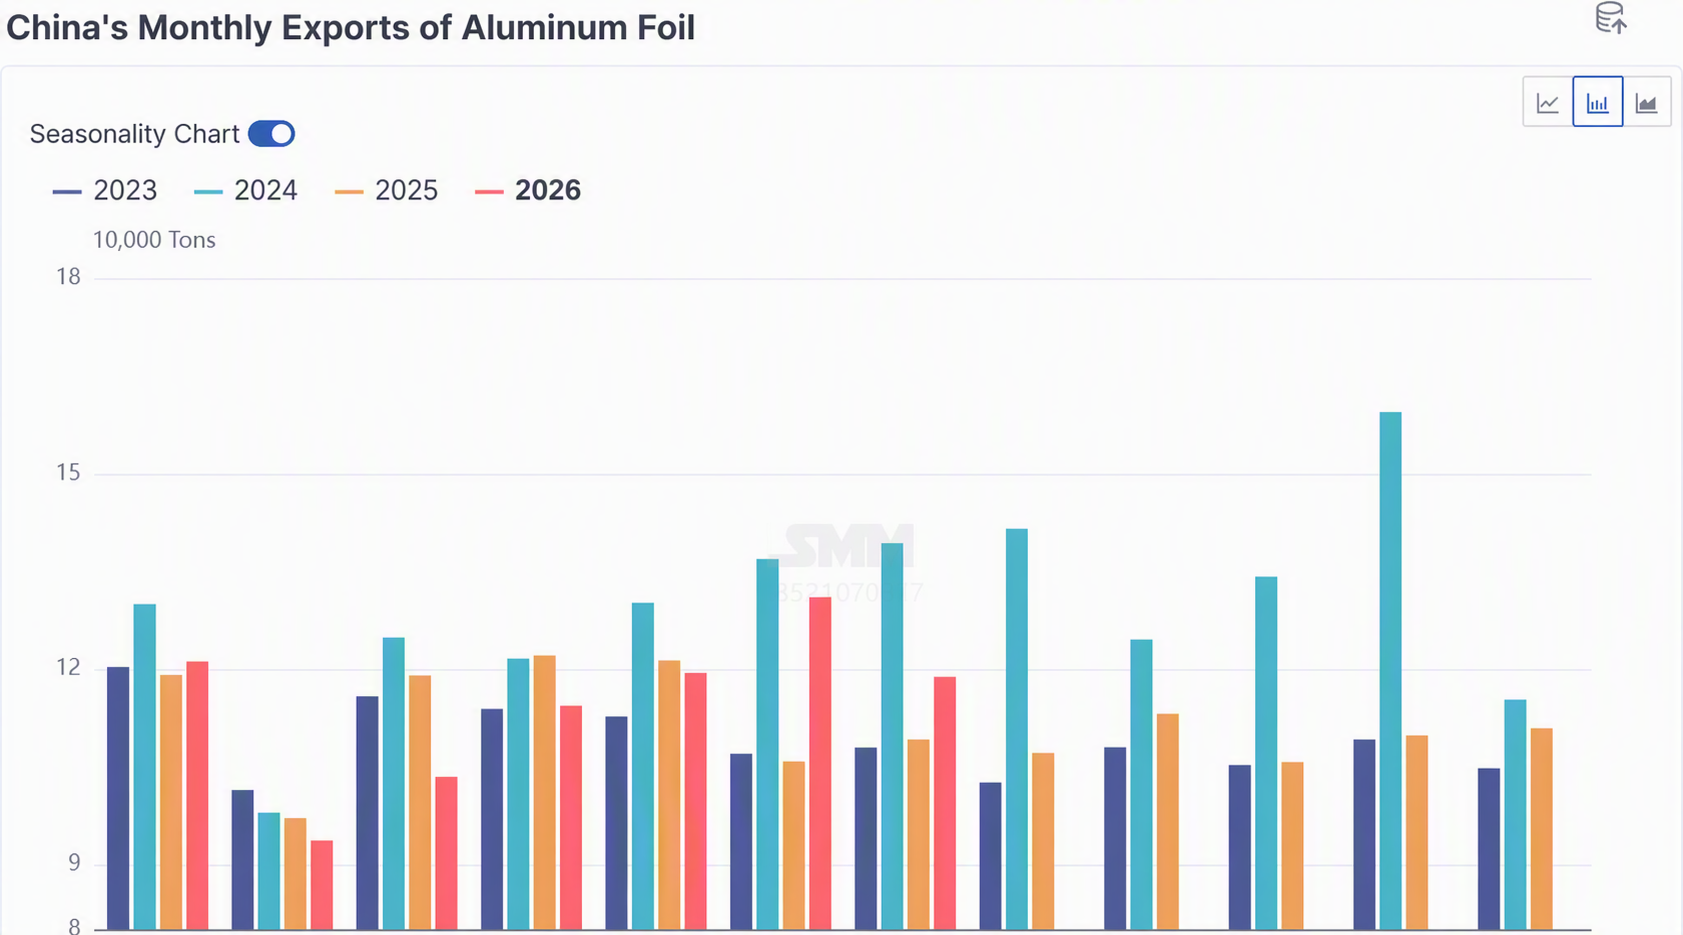
According to the latest data from the General Administration of Customs of China, cumulative exports of Chinese aluminum foil (HS code 7607 series) from January to July 2026 reached 802,000 mt, with July exports alone at 118,800 mt, down 9.3% from the June peak of 131,000 mt, clearly indicating a peak and pullback in the "export rush" pulse effect.
In July, all five major aluminum foil export varieties declined MoM. The main variety—rolled, not further worked, not backed aluminum foil (0.01mm < thickness ≤ 0.2mm)—saw exports of 46,800 mt, down 7.1% MoM, accounting for 39.4% of July's total exports. On a cumulative January-July basis, the product structure remained stable. The main variety (0.01mm < thickness ≤ 0.2mm) accounted for 38.7%, while ultra-thin aluminum foil (thickness ≤ 0.007mm) accounted for 20.9%, together representing nearly 60%.
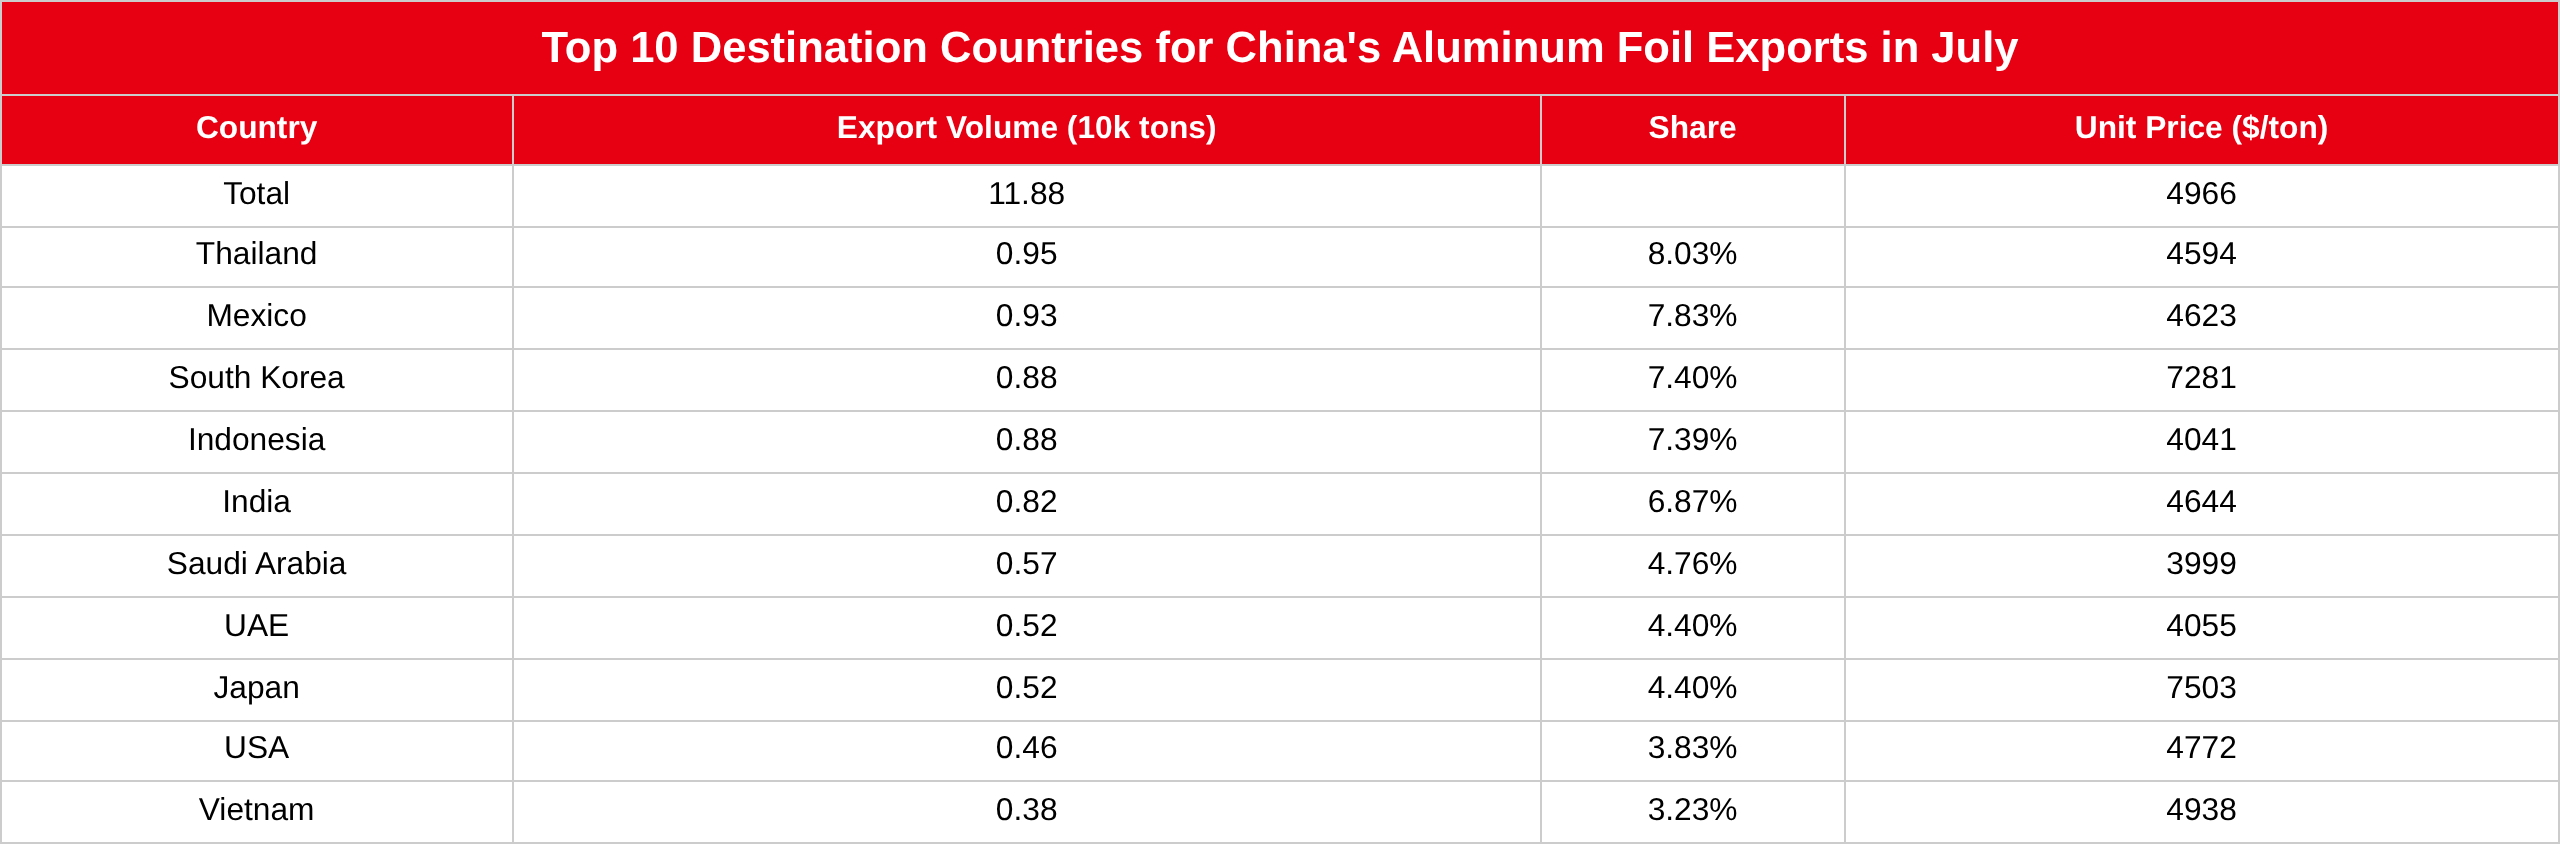
By country, Thailand ranked first with 9,500 mt, followed by Mexico (9,300 mt) and South Korea (8,800 mt). Notably, Indonesia, which topped exports in June (10,800 mt in June), saw a sharp pullback to 8,800 mt in July (-18.8% MoM), while Mexico bucked the trend with a 14.8% increase, replacing Indonesia as the second-largest destination. India fell from 10,200 mt in June to 8,200 mt in July (-20.2%).
The July export pattern showed three notable features: First, traditional Southeast Asian markets collectively pulled back—Thailand -13.1%, Indonesia -18.8%, Vietnam -24.2%, Malaysia -56.0%, reflecting weakening demand in the region; Second, the North American market diverged against the trend—Mexico +14.8% grew, Canada +1.2% edged up, but the US -10.9% continued to decline; Third, the Middle East market corrected sharply due to geopolitical fluctuations—Saudi Arabia -25.3%, UAE -2.8%.
In a comprehensive assessment, SMM maintains its full-year 2026 forecast for Chinese aluminum foil exports at 1.3-1.35 million mt, with cumulative exports from January to July at 802,000 mt, laying a solid foundation for achieving the subsequent target. To reach the forecast of 1.3 million mt for the full year, exports from August to December need to reach approximately 498,000 mt or more, translating to an average monthly export volume of about 99,600 mt or more—a target that is not difficult even under the current SHFE/LME price ratio environment, based on two judgments: First, orders on hand lock in future deliveries. According to the SMM survey, some aluminum foil enterprises currently have export orders scheduled for ex-factory delivery through mid-October, with order-taking not yet showing a significant slump. During the earlier period of widening price spread between Chinese and overseas markets, overseas clients locked in a large number of orders, creating execution momentum for concentrated delivery in the coming months; Second, outside China demand shows resilience, and seasonal patterns point to Q4 not being weak. Despite a MoM pullback in July, monthly exports of 118,800 mt remained in the medium-to-high historical range. A short-term pullback in Southeast Asia does not equate to a trend collapse, as the long-term logic of industrialization and consumption upgrade remains unchanged; the counter-trend growth in the Mexican market provides a new growth fulcrum for the North American market, and full-year exports are highly likely to fall in the 1.3-1.35 million mt range.