According to customs data, China's aluminum plate/sheet and strip (including aluminum plates, sheets, strips, and aluminum-plastic composite panels) exports in July 2026 reached 321,900 mt. On a MoM basis, July exports declined by 9.1% from June's 354,000 mt, a decrease of about 32,100 mt, ending three consecutive months of growth. On a YoY basis, July exports increased by 24%. Cumulative exports from January to July 2026 totaled 2.1113 million mt, up 19.5% YoY.
From a product structure perspective, July aluminum plate/sheet and strip exports were dominated by aluminum alloy sheet. Among these, exports of aluminum alloy rectangular plates with a thickness of 0.2-0.28mm (mainly used for can stock) reached 139,100 mt, accounting for 43.2% of total July exports. However, this was down 9.5% MoM (June: 153,700 mt), a decrease of about 14,600 mt. Cumulative exports of this product from January to July reached 916,400 mt, representing 43.4% of total exports, remaining the core product in aluminum plate/sheet and strip exports. The second-largest category was other aluminum alloy rectangular plates with a thickness of 0.35mm-4mm, with July exports of 62,500 mt, down 10.7% MoM; cumulative exports from January to July totaled 424,200 mt. The third category was other non-alloy aluminum rectangular plates (thickness > 0.2mm), with July exports of 32,600 mt, edging down only 1.5% MoM, showing relative resilience. The largest decline was seen in aluminum alloy rectangular plates with thickness greater than 4mm, with July exports of 27,800 mt, down 17.4% MoM, reflecting that thick-plate demand is more price-sensitive, and the narrowing arbitrage space after the SHFE/LME price ratio recovery had a greater impact on thick-plate exports. Overall, the broad-based pullback across all product categories confirmed the judgment that export demand has entered a contraction channel.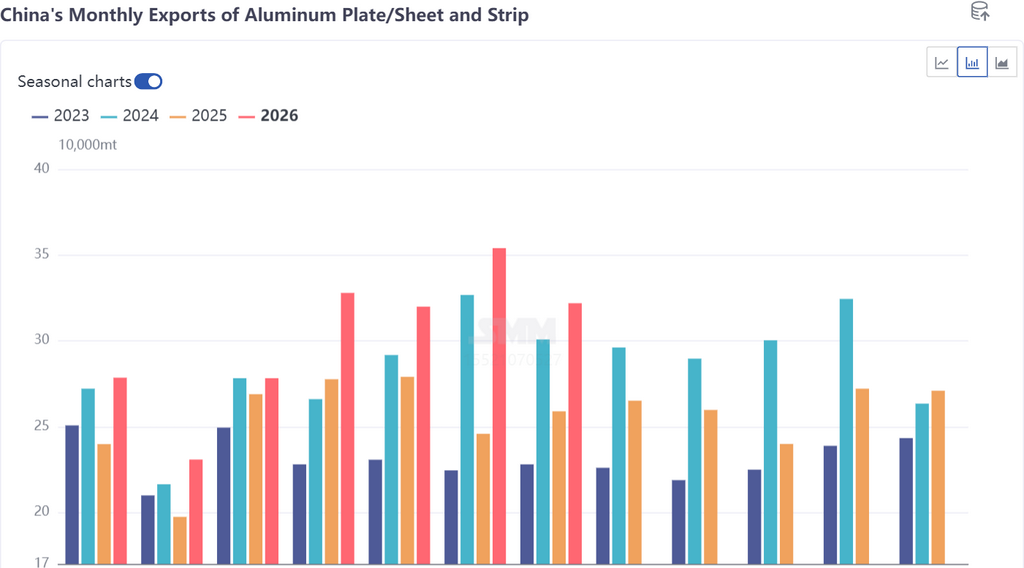
By country, Mexico continued to lead with 34,900 mt in July, but down 22.8% MoM (June: 45,300 mt), accounting for 10.8% of total July exports. Cumulative exports to Mexico from January to July reached 257,400 mt, firmly maintaining its position as the top destination. The US ranked fifth, with July exports of only 16,200 mt, plunging 37.8% MoM (June: 26,100 mt); cumulative exports to the US from January to July totaled 200,300 mt. The continued sharp pullback in exports to the US was directly due to a leading North American mill fully resuming production in July; can stock and automotive sheet orders previously transferred to China-based enterprises due to a fire have been fully reclaimed, with only about 2,000 mt of trailing volumes remaining in August. In H2, exports to the US will gradually pull back to a low level of 3,000-5,000 mt under the new tariff regime. Southeast Asian markets showed strong resilience: Vietnam (25,000 mt, -3.8% MoM), Thailand (17,300 mt, +0.3% MoM), and Indonesia (12,100 mt, +3.8% MoM) totaled 54,400 mt, accounting for 16.9% of July exports. As the traditional core market for aluminum plate/sheet and strip exports, demand in Southeast Asia remained steady. Among emerging markets, Nigeria (10,300 mt, +16.9% MoM), Turkey (9,500 mt, +12.8% MoM), and Kazakhstan (5,400 mt, +180.0% MoM) recorded significant MoM increases.
Previously, the SHFE/LME price ratio was in a range favorable for exports, driving sustained growth in Q2 exports. However, from the end of July to early August, the SHFE/LME price ratio widened significantly, sharply compressing export profit margins. Against this backdrop, if China’s alminum smelters want to maintain export competitiveness, they need to raie processing fees to compensate for loes from the price spread between Chinese and overseas markets. But raiing processing fees will further suppress the ordering intentions of clients outside China—this contradiction has already emerged in the thick plate category first. Looking ahead to H2, exports to the US are expected to pull back to low levels, with the ongoing preure from the widening SHFE/LME price ratio on new orders persisting. Exports are expected to further pull back starting from August, and average monthly exports in H2 will fall into the range of 260,000-300,000 mt. Taking into account the solid base of 2.11 million mt in January-July, and applying a neutral estimate for the remaining months of 2026 (average 270,000 mt per month, about 1.35 million mt for five months), full-year exports are still expected to reach 3.4-3.5 million mt, higher than 3.07 million mt in 2025. The 3.43 million mt level in 2024 is alo likely to be surpassed, but the export boom in Q2 will be difficult to replicate in H2.

![July aluminum foil exports pulled back 9.3% MoM, but the full-year target of 1.3 million mt remains achievable [SMM Analysis]](https://imgqn.smm.cn/usercenter/fFkYh20251217171651.jpg)
![Under the Dual Pressure of North American Capacity Recovery and a Widening SHFE/LME Price Ratio, July Aluminum Plate/Sheet and Strip Exports Peaked and Pulled Back [SMM Analysis]](https://imgqn.smm.cn/usercenter/SUuNM20251217171651.jpg)