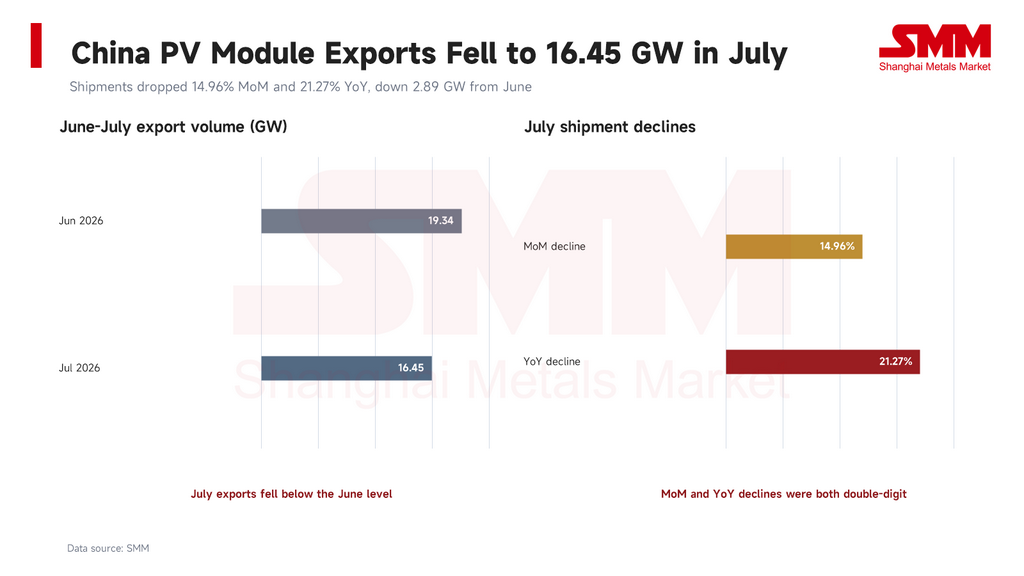
China exported an estimated 16.45 GW of solar modules in July 2026, down 14.96% from 19.34 GW in June and 21.27% from a year earlier, according to SMM data. The month-on-month decline amounted to 2.89 GW, but it was highly concentrated rather than broad-based across all major destinations.
July export value reached approximately $1.90 billion (RMB 12.81 billion). Based on export value divided by SMM’s GW-equivalent shipment estimate, the implied average export value was about $0.116/W (RMB 0.779/W). This is a blended customs-value indicator and should not be read as a transaction price for any specific module technology, incoterm or destination.
Asia-Pacific markets drove most of the decline
Pakistan was the largest drag on China’s July module exports. Shipments to the market fell to 0.96 GW from 2.15 GW in June, a 55.3% month-on-month decrease. The 1.19 GW reduction accounted for 41.2% of China’s total net decline in July.
Several other Asia-Pacific destinations also recorded lower volumes. Exports to the Philippines fell by 0.36 GW, Australia by 0.26 GW, Thailand by 0.21 GW, Malaysia by 0.18 GW and Vietnam by 0.09 GW. Together with Pakistan, these six markets contributed 2.29 GW, or 79.2%, of the month’s net decline.
The concentration of the drop suggests that July was shaped primarily by shipment timing, inventory adjustment and the normalisation of purchasing after stronger deliveries in June. It does not indicate a simultaneous deterioration across Europe, the Middle East, Africa and Latin America.
The Netherlands remained the largest destination
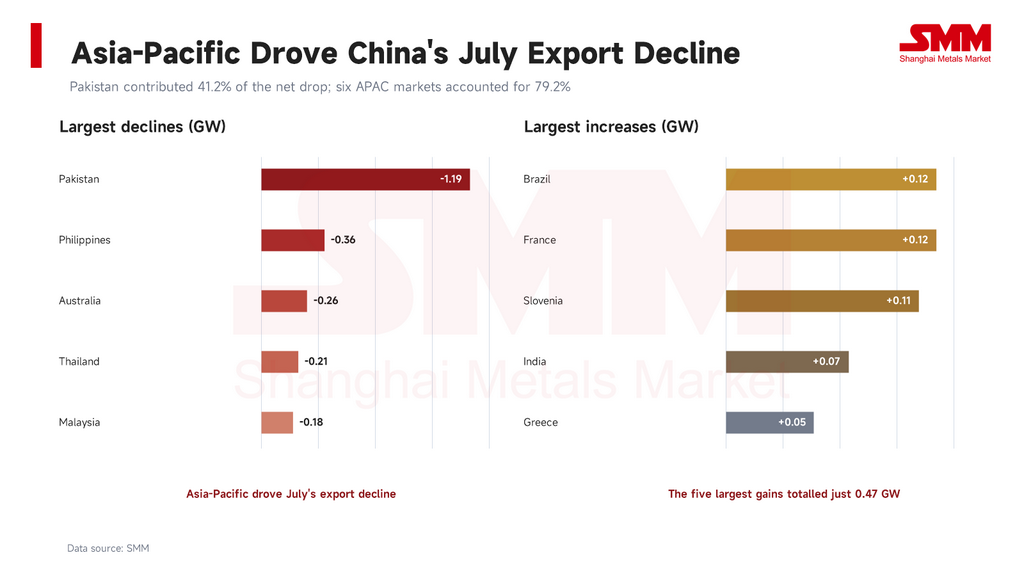
The Netherlands, Pakistan, Brazil, Saudi Arabia and Slovenia were China’s five largest module export destinations by volume in July. Their respective shipments were 2.73 GW, 0.96 GW, 0.87 GW, 0.72 GW and 0.64 GW, for a combined 5.92 GW and a 36.0% share of total exports.
The Netherlands remained China’s largest individual destination despite a 6.5% decline from June. As a major European import and distribution hub, it accounted for 16.6% of China’s July module exports. Pakistan retained second place after its steep monthly decline, while Brazil rose 16.0% to 0.87 GW and moved ahead of Saudi Arabia.
By value, exports to the Netherlands were approximately $342 million (RMB 2.31 billion), equivalent to 18.0% of China’s total. Pakistan, Brazil, Saudi Arabia and Slovenia followed at about $98 million (RMB 661 million), $86 million (RMB 581 million), $79 million (RMB 534 million) and $72 million (RMB 488 million), respectively. The top five destinations accounted for 35.7% of export value, broadly matching their combined volume share.
Europe remained the core value market, but demand was uneven
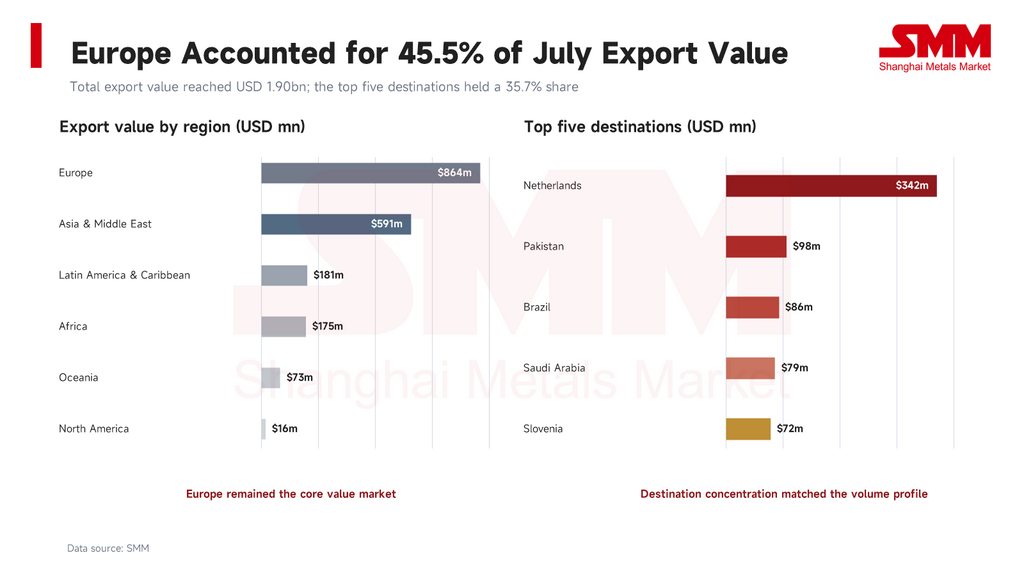
Europe generated approximately $864 million (RMB 5.82 billion) of China’s July module export value, or 45.5% of the total. This kept the region firmly in first place by value even as purchasing patterns diverged across individual markets.
Shipments to the Netherlands fell to 2.73 GW from 2.92 GW, while Belgium declined to 0.43 GW from 0.53 GW and Spain to 0.33 GW from 0.47 GW. Germany and the United Kingdom also recorded lower volumes, at 0.29 GW and 0.26 GW, respectively.
Other European markets provided a partial offset. France increased 33.3% month on month to 0.48 GW, Slovenia rose 20.8% to 0.64 GW and Greece advanced to 0.44 GW. Italy remained broadly stable at around 0.50 GW.
The divergence points to shifting procurement between European distribution hubs and project markets rather than a uniform regional expansion or contraction. Traditional gateways softened, while France, Slovenia and Greece benefited from stronger project deliveries or restocking activity.
Brazil led the pockets of growth outside Asia
Brazil and France each added around 0.12 GW in July, while Slovenia gained approximately 0.11 GW. India and Greece increased by about 0.07 GW and 0.05 GW, respectively. Together, the five largest positive contributors added only 0.47 GW, well below the decline recorded across Pakistan and the other major Asia-Pacific markets.
Brazil’s exports rose to 0.87 GW, with export value reaching approximately $86 million (RMB 581 million). Latin America and the Caribbean generated about $181 million (RMB 1.22 billion), or 9.5% of China’s total module export value. The regional increase remained concentrated in Brazil, as Chile declined to 0.09 GW and Colombia stayed near 0.11 GW.
The Middle East also showed mixed momentum. Shipments to Saudi Arabia were broadly stable at 0.72 GW, while exports to the United Arab Emirates fell to 0.20 GW from 0.36 GW. Monthly volumes in the region can be volatile because deliveries are often tied to the construction schedules and customs clearance windows of utility-scale projects.
Africa accounted for approximately $175 million (RMB 1.18 billion), or 9.2% of total export value. Nigeria held near 0.38 GW, while South Africa declined to 0.37 GW from 0.47 GW. Demand remained supported by power shortages and commercial, industrial and distributed-generation projects, although financing and delivery schedules continued to vary widely by country.
Outlook: recovery depends on Asia-Pacific restocking
SMM sees three key signals in the July data. First, the decline was unusually concentrated: Pakistan alone contributed more than 40% of the net drop, while six Asia-Pacific markets accounted for nearly 80%. Second, Europe remained China’s most important export market by value, with growth in France, Slovenia and Greece partially offsetting softer volumes through traditional entry points. Third, emerging-market growth offered some support but was not large enough to absorb the Asia-Pacific correction.
The near-term trajectory will depend on whether Pakistani buyers return after working through channel inventories, whether exports to the Philippines, Australia and Southeast Asia stabilise, and whether project deliveries in southern Europe and the Middle East continue. If Asia-Pacific shipments find a floor while Europe and Latin America retain their current resilience, China’s module exports could gradually recover. A prolonged inventory adjustment in Pakistan and Southeast Asia would keep monthly exports under pressure.
SMM will continue to track module demand, channel inventories, project delivery schedules and pricing conditions across China’s major export markets.
*Exchange rate used: 1 USD = 6.74 CNY as of August 21, 2026. Data source: SMM. Export volume is presented on an SMM GW-equivalent basis; USD figures are rounded.*
Written by:
Ryan Tey Tze Yang | SMM PV Analyst
+60 127179370 | ryan.tey@metal.com
![China Proposes Tighter Solar Technology Export Controls: What Next for the Ex-China Region? [SMM Analysis]](https://imgqn.smm.cn/usercenter/lBNjs20251217171740.jpg)
![[SMM Analysis] Silver Down Nearly 20% From Stage High: Why Are Solar Cell Prices Not Following?](https://imgqn.smm.cn/usercenter/FqtWa20251217171742.jpg)
![[SMM PV Flash] Sigenergy Named National-Level Specialized and Sophisticated "Little Giant" Enterprise!](https://imgqn.smm.cn/usercenter/JNxfy20251217171742.jpg)