August 6, 2026
The potential end of the gold price correction highlighted in our July 23 Chart Check is becoming increasingly evident. The technical signals that suggested a reversal several weeks ago have continued to strengthen.
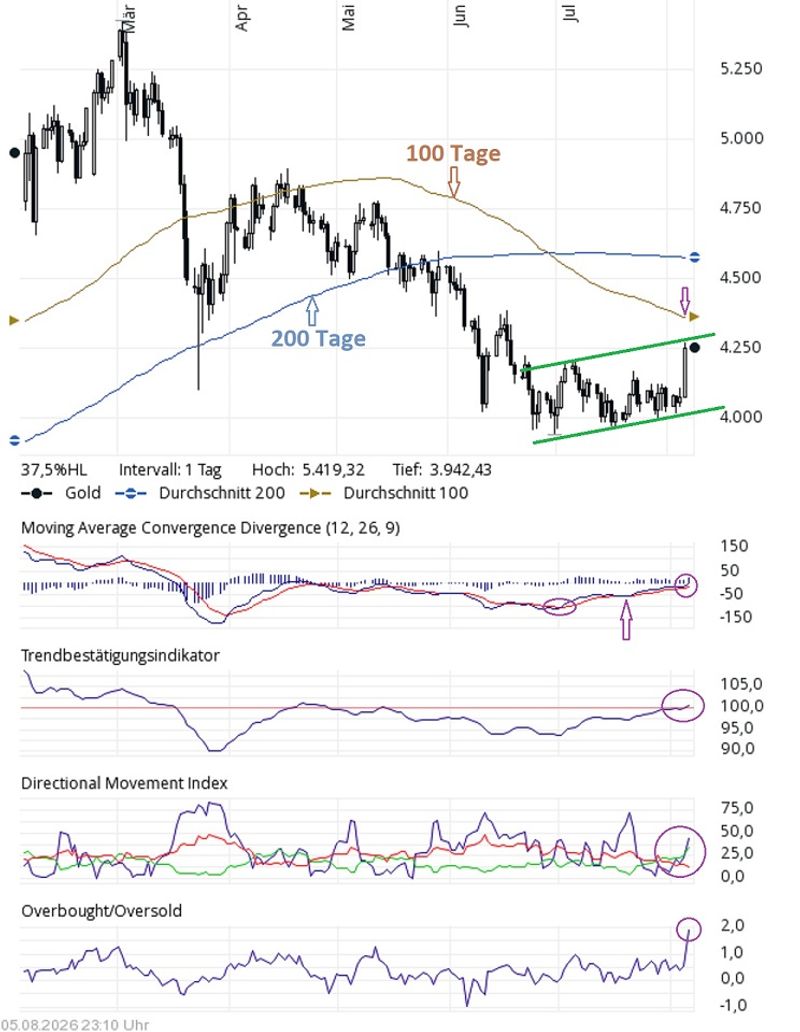
Since then, gold has held firmly above the key US$4,000 support level. Yesterday's rally of more than 4% also pushed the metal decisively through the resistance zone around US$4,200. During intraday trading, gold briefly climbed above US$4,250, providing another strong technical confirmation of improving market sentiment.
Rising Trend Channel Continues to Hold
The price action of the past six weeks has established a gently rising trend channel. Particularly encouraging is the lower boundary of this channel, which has repeatedly acted as reliable support and therefore reinforces the validity of the current short-term uptrend.
The moving averages are also beginning to paint a more constructive picture. The 200-day moving average continues to move sideways, indicating that the longer-term trend remains neutral for now.
The outlook for the 100-day moving average initially proved somewhat premature, as the line briefly continued its downward trajectory. However, the correction now appears to be losing momentum. As of today, the 100-day moving average has flattened for the first time, suggesting that downside pressure is easing.
Technical Indicators Continue to Improve
Momentum indicators also support the increasingly positive technical outlook.
The MACD continues to maintain its previously generated buy signal. Moreover, the widening separation between the MACD line and the signal line points to strengthening bullish momentum.
The trend confirmation indicator has developed largely as expected and has now moved back above the 100 level, returning to positive territory and confirming the improving trend.
A similar picture emerges from the Directional Movement Index (DMI). The positive DI line has crossed above the negative DI line, generating the anticipated buy signal. At the same time, the ADX continues to rise steadily, indicating that the strength of the emerging trend is increasing.
Short-Term Consolidation Remains Possible
One indicator still calls for caution. The Overbought/Oversold indicator has now reached a reading of 2.0, officially signaling overbought conditions for the first time since September 2024.
A similar reading at that time was followed by a brief consolidation before gold resumed its powerful advance. While history does not necessarily repeat itself, the current setup suggests that a short-term pause would not be unusual following the recent sharp rally.
Conclusion
Overall, the technical picture has improved significantly compared with late July. Although a short-term consolidation remains possible after the recent strong advance, the balance of technical evidence has shifted clearly in favor of the bulls. Most key indicators now point toward a continuation of the recovery rather than a resumption of the previous correction.
Source:https://goldinvest.de/en/gold-chart-check-the-bullish-reversal-is-gradually-taking-shape