September 21, 2026
As of September 18, 2026, by Florian Grummes
The price of gold initially continued to pull back from its summer high of $4,697 over the past two weeks and, shortly after the U.S. interest rate decision on Wednesday evening, briefly dropped to a new low of $4,235. However, this was immediately followed by a sharp rebound, which pushed prices back up to $4,400 shortly before the weekend.
As a result, the 50-day moving average has successfully fended off the bears’ attacks four times this week, and our primary scenario of a sideways trend between the 50- and 200-day moving averages remains intact.
Interest Rate Hike Comes as No Surprise
The decline in the gold price was due not only to the overbought conditions but primarily to the looming interest rate hike. On Wednesday evening, the U.S. Federal Reserve decided to raise interest rates by 25 basis points—its first rate hike under new Fed Chair Kevin Warsh. This decision had been gradually priced in by the markets and therefore came as little surprise.
The focus was less on the “what” and more on the “how”:
How would Warsh position himself in the face of political pressure from the White House, and what signals regarding monetary policy independence would he send?
After all, every further interest rate hike not only tightens financing conditions but also exacerbates tensions with President Trump, who views the central bank’s restrictive stance with a critical eye in the run-up to the U.S. midterm elections.
A Shift in the Monetary Policy Response
It is also interesting to compare the monetary policy decisions of 2024 and 2026, which reveal a remarkable asymmetry in the Federal Reserve’s reaction function.
While the Federal Reserve under Powell, in the 2024 election year, eased policy by 50 basis points—an expansionary move—two months before the presidential election when the core inflation rate stood at 3.3%, the Federal Reserve under the new leadership of Warsh decided in 2026—with a significantly lower core inflation rate of 2.4%—to tighten policy by 25 basis points—of all times, right ahead of the midterms.
This divergence raises the question of the extent to which political pressure or the Federal Reserve’s internal risk assessment has shifted, especially since current inflation dynamics are largely driven by exogenous shocks in the energy sector (the Iran conflict), over which traditional interest rate instruments have little influence.
Credibility versus Economic Reality
Fed Governor Kevin Warsh initially underscored the central bank’s institutional independence from the White House with the unanimously approved interest rate hike and his uncompromising rhetoric in the fight against inflation. In doing so, he ensured short-term stability in the bond markets. Following an initial sell-off, the stock markets also responded positively to this demonstration of monetary policy credibility.
Nevertheless, the economic logic behind the rate hike remains questionable: If a significant portion of the current price pressure stems from rising energy, diesel, and fertilizer costs—which in turn increase production costs in agriculture and logistics—a rate hike is likely to be counterproductive. It makes financing more expensive in the affected sectors without expanding the supply of energy or food. There are therefore many indications that the Fed is primarily seeking to anchor inflation expectations—even if its policy tools are only of very limited effectiveness against the current supply-side inflation.
Volatility Ahead of the Midterms
At the same time, the prospect of further rate hikes in October or December and the approaching U.S. midterm elections could also lead to increased uncertainty in the financial markets in the coming weeks. This phase is not expected to gradually ease until mid-October. Until then, investors should expect heightened volatility and abrupt price pullbacks, which could spill over into the precious metals sector at any time.
Since sentiment among institutional investors, hedge funds, and retail investors is already noticeably subdued, we remain cautiously optimistic for the fourth quarter. In the long term, however, the discrepancy between monetary tightening and developments in the real economy represents a potential weak point that calls into question the sustainability of the Fed’s current course.
Gold in U.S. Dollars – Potential for Recovery Up to the 200-Day Moving Average
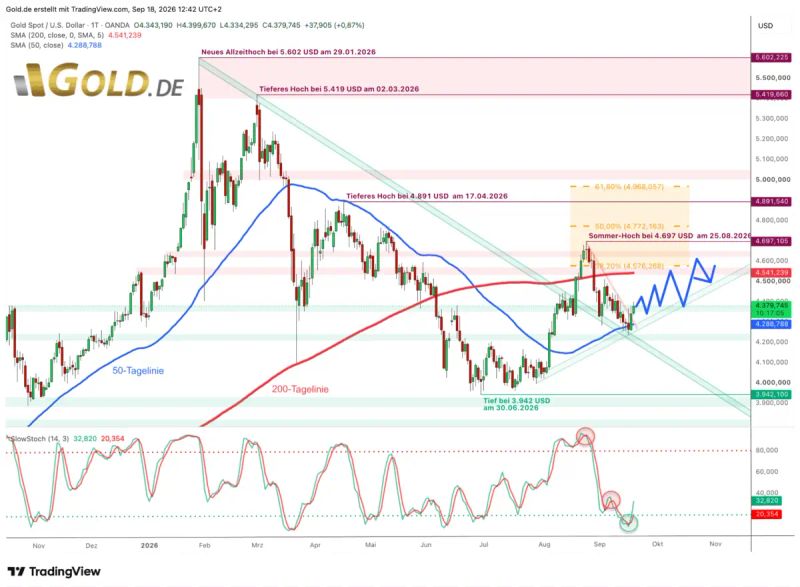
Gold in U.S. dollars, daily chart as of September 18, 2026. © GOLD.DE
Starting from its August high of $4,697, the price of gold corrected its spectacular summer rally over the past three weeks, falling by about 10%. The central bank meeting in Jackson Hole at the end of August had already triggered two sharp waves of selling, pushing the price down to $4,282. Afterward, however, the bears made only slow progress, and their momentum waned. Although the gold price hit a new correction low of $4,235 immediately after the Fed’s interest rate decision, the bears were unable to close the day significantly below the slowly rising 50-day moving average of $4,288 this week.
Unsurprisingly, the bulls have been taking advantage of the significantly oversold conditions on the daily chart since Wednesday evening to stage a recovery. On Friday morning, the price also broke out above the short-term downtrend, causing the technical picture to brighten rapidly once again. A continuation of the rally toward the 200-day moving average (currently $4,541) therefore appears realistic in the coming weeks.
Only if weakness resurfaces and the 50-day moving average fails to withstand another test this time would the technical picture darken significantly.
A sustained slide below $4,250 could then trigger a pullback toward $4,000.
However, our projected sideways scenario between the 50- and 200-day moving averages remains more likely. This consolidation phase could serve as a foundation for a further rise in the fourth quarter. If a sustained breakout above the 200-day moving average subsequently occurs, prices around and above $5,000 would also be conceivable in the first quarter of 2027.
Conclusion: Gold – Setback Over for Now
The gold market is currently caught in a classic tug-of-war: The Fed is tightening monetary policy to stabilize inflation expectations, even though a significant portion of the price pressure is caused by external energy and geopolitical shocks. In the short term, higher interest rates are weighing on the gold price, but the oversold market conditions, strong support at the 50-day moving average, and pronounced short positioning point to a technical rebound.
As long as the price does not sustainably fall below $4,250, a recovery toward $4,550 remains the more likely scenario.
Overall, gold is likely to consolidate between the 50-day and 200-day moving averages for the time being. However, this pause could prove to be a prelude to a new upward move later this year—with the possibility of targeting the $5,000 mark again for the first time in the first quarter of 2027.
As of: September 18, 2026
Written by:Florian Grummes
Technical Analyst, Precious Metals Expert
Source:https://goldinvest.de/en/gold-price-turning-higher-is-usd4-550-now-within-reach