In H1 2026, China’s exports of copper plate/sheet and strip extended the high-growth trend seen since 2025, maintaining double-digit positive YoY growth each month and generally following a pattern of “strong start before Chinese New Year, accelerated growth after the holiday, and sustained high volumes in Q2.” According to General Administration of Customs data, China’s cumulative exports of copper plate/sheet and strip from January to June reached 71,316.9 mt, up 18.02% YoY. Single-month exports in June reached a record high of 13,423.84 mt, up 8.21% MoM and up 29.87% YoY, bringing H1 to a strong close.
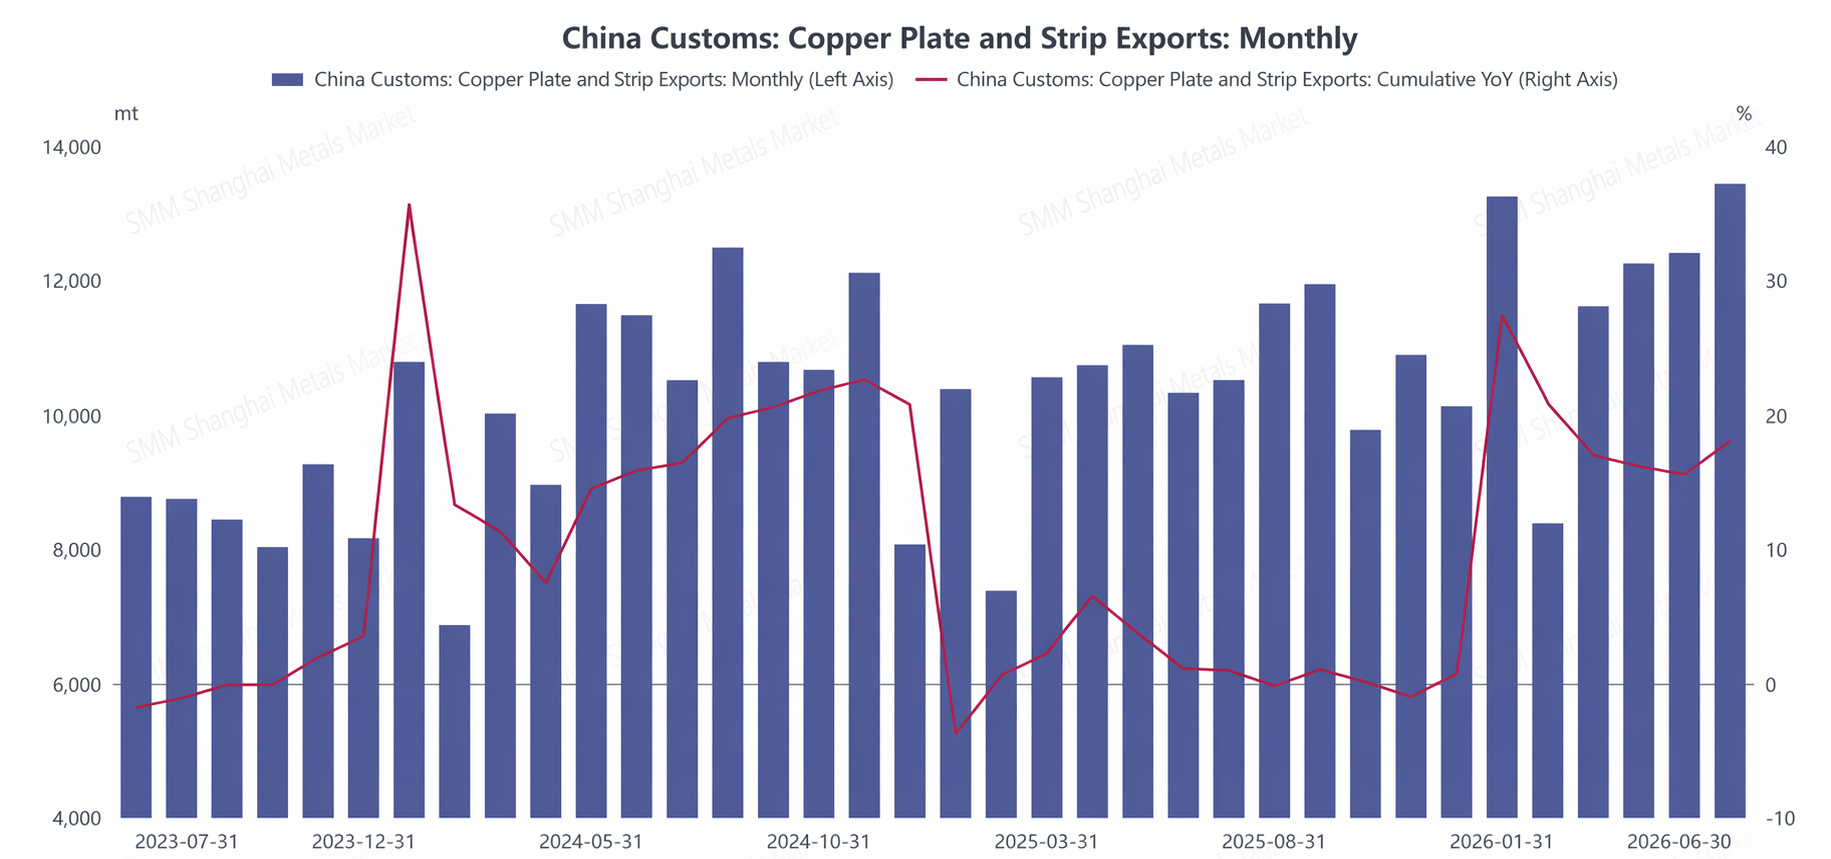
In terms of pace, exports were high in January (13,233.73 mt) and lower in February (8,395.28 mt) due to the Chinese New Year holiday disruption. Production resumptions accelerated from March, with monthly exports staying above 11,600 mt for four consecutive months. Q2 average monthly exports reached 12,700 mt, with overseas demand staying high.
The export market showed a broadly diversified pattern. South Korea, Vietnam, and Taiwan, China remained the top three destinations, though their shares shifted. Vietnam’s performance was the most outstanding in H1, with exports up 40.8% and 79.5% YoY in March and June, respectively; exports to Taiwan, China surged 103% YoY in June; and the South Korean market also maintained steady growth. Among emerging markets, North America contributed the largest growth—June exports to Mexico skyrocketed 236% YoY, becoming the core source of incremental volume for that month, while Canada recorded a 247.8% YoY increase in May. Some traditional markets like India, Japan, Germany, and Thailand experienced pullbacks in certain periods, showing an overall divergence.
The trade mode structure has undergone a policy-driven shift. Since the cancellation of export tax rebates for copper plate/sheet and strip in December 2024, the industry’s export structure has largely completed its transition from ordinary trade to processing trade. In H1, processing trade with imported materials stabilized at a dominant share of 65–69%; processing and assembling accounted for about 15–19%; and ordinary trade’s share had fallen below 10%.
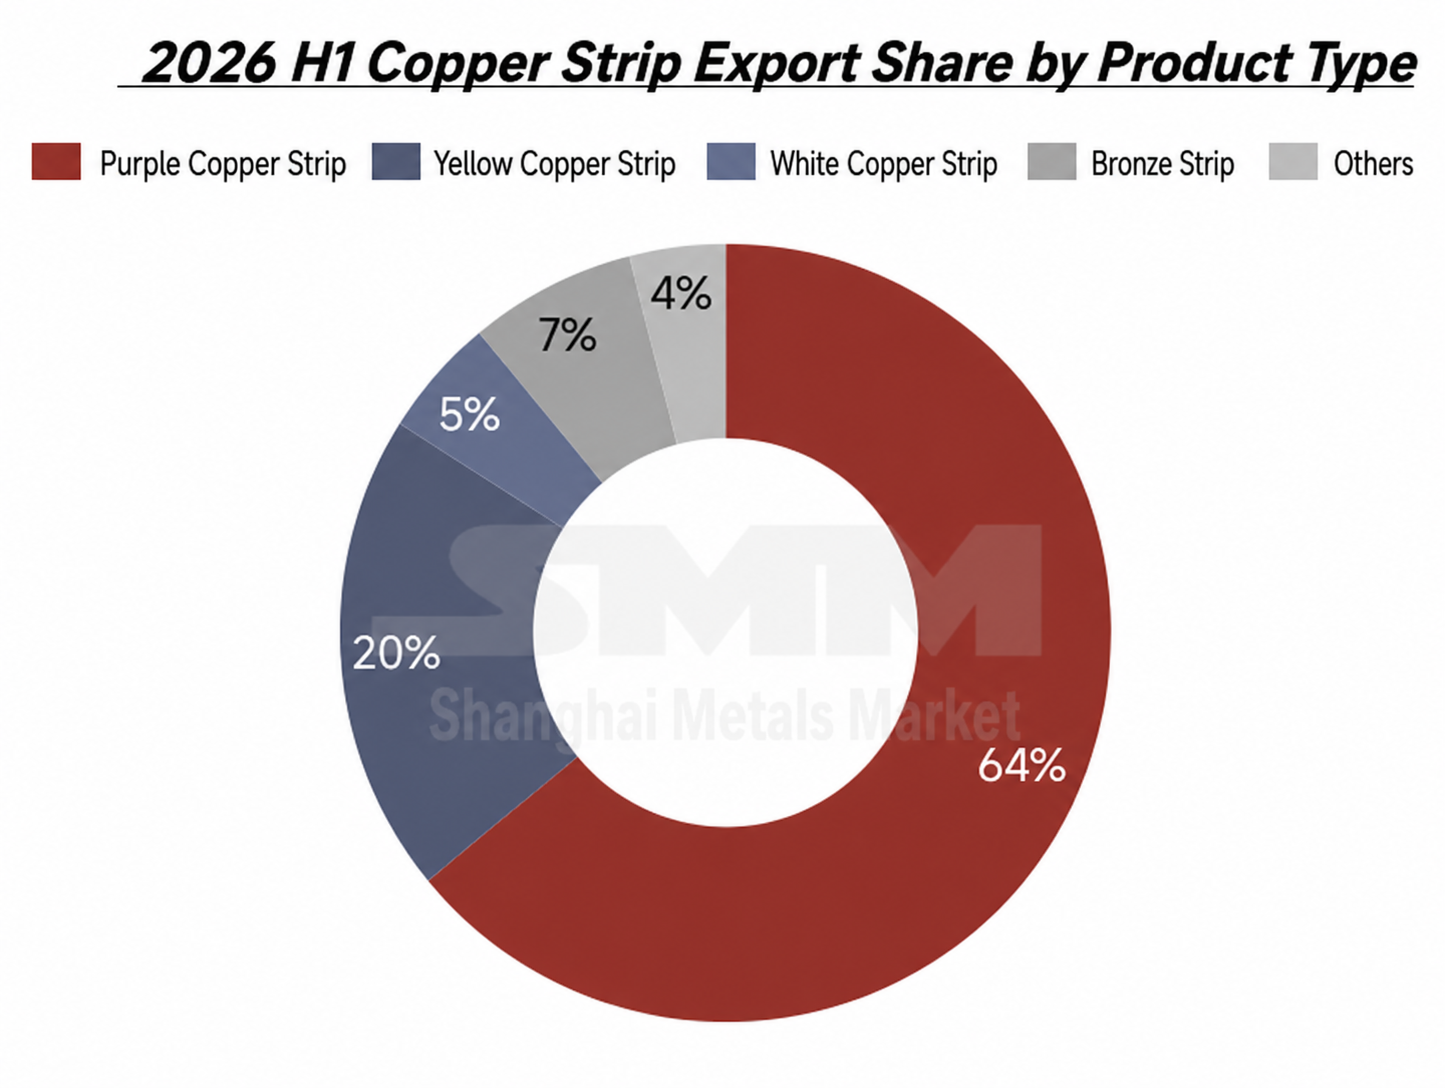
The product mix continued the pattern of "copper strip up, brass strip down." Copper strip remained the absolute mainstay of exports, maintaining a share of 65–70% in H1. Single-month exports in June reached 9,341 mt, up sharply by 48.4% YoY—the largest incremental contribution among all product categories. Exports of copper-nickel strip maintained remarkable growth, up 32.1% YoY in June. Brass strip exports pulled back, affected by demand adjustments and homogenized competition. Domestic sales and exports of bronze strip were generally stable, with limited fluctuations.
Looking back at H1 2026, the copper plate/sheet and strip industry achieved 18.02% cumulative YoY growth, laying a solid foundation for high growth throughout the year. Chinese copper plate/sheet and strip products offer both quality and cost advantages, and their international market recognition has continued to rise. The expansion of new energy installations and power grid infrastructure investment outside China has maintained momentum, supporting the high-level performance of copper plate/sheet and strip exports. At the segment-demand level, three high-growth tracks—AI computing hardware, energy storage equipment, and new energy vehicles—are generating significant demand for supporting copper plate/sheet and strip, serving as the core support sustaining the industry’s export resilience. Meanwhile, the long-term trends of high-end transformation and market share concentration among leading players are likely to strengthen further in H2.
Data source: General Administration of Customs
(HS code 74091110, 74091190, 74091900, 74092100, 74092900, 74093100, 74093900, 74094000, 74099000)

![DRC to Enforce Miner Local Employee Shareholding Regulation at July Month-End [SMM Analysis]](https://imgqn.smm.cn/usercenter/eFYDl20251217171712.jpg)
![This week, copper social inventories saw a slight buildup, as off-season high prices dragged on downstream demand [SMM Weekly Data].](https://imgqn.smm.cn/usercenter/HhNHP20251217171708.jpg)