
Off-Season Slows End-User Finished Goods Pickup Pace, July Wire and Cable Operating Rate Upside Room Limited [SMM Analysis]

Published: Jul 7, 2026 14:28
[SMM Analysis: Off-season Slows End-User Finished Product Pick-up Pace, Limited Upside Room for July Wire and Cable Operating Rate] According to SMM, the June operating rate of the copper wire and cable industry was 72.22%, down 0.11 percentage points MoM and 0.19 percentage points YoY, with large enterprises at 77.62%, medium-sized enterprises at 50.4%, and small enterprises at 47.54%...


In June, the operating rate in the copper wire and cable industry was recorded at 72.22%, down 0.11 percentage points MoM and down 0.19 percentage points YoY. Among them, the operating rate for large enterprises was recorded at 77.62%, for medium-sized enterprises at 50.4%, and for small enterprises at 47.54%.
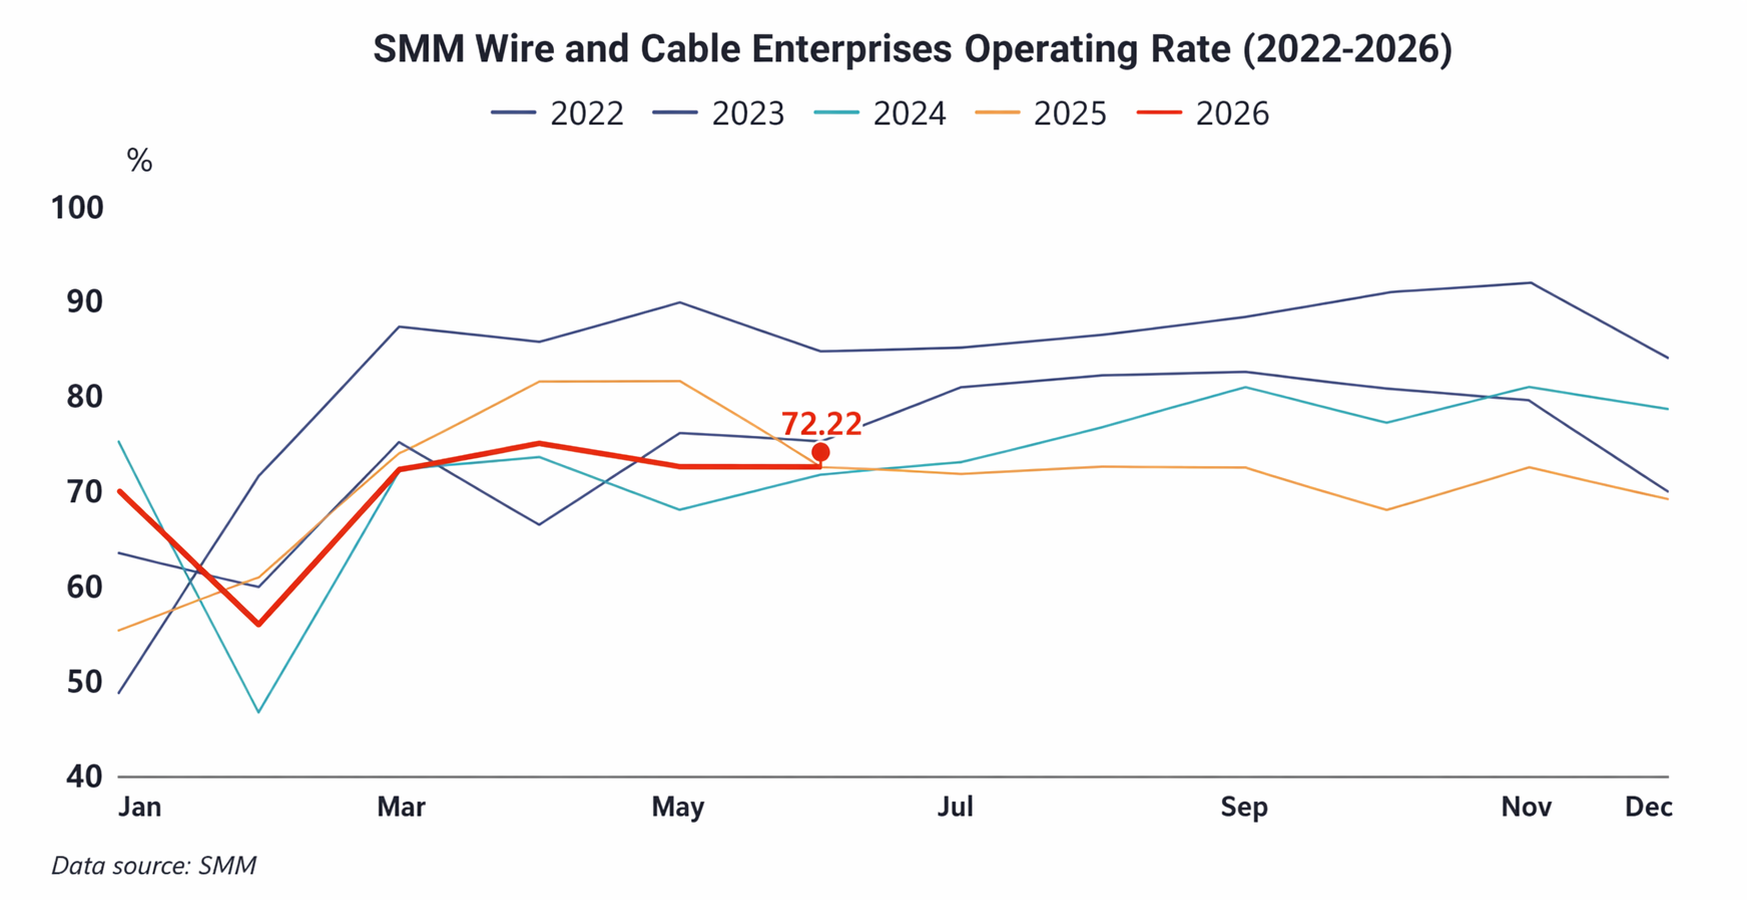
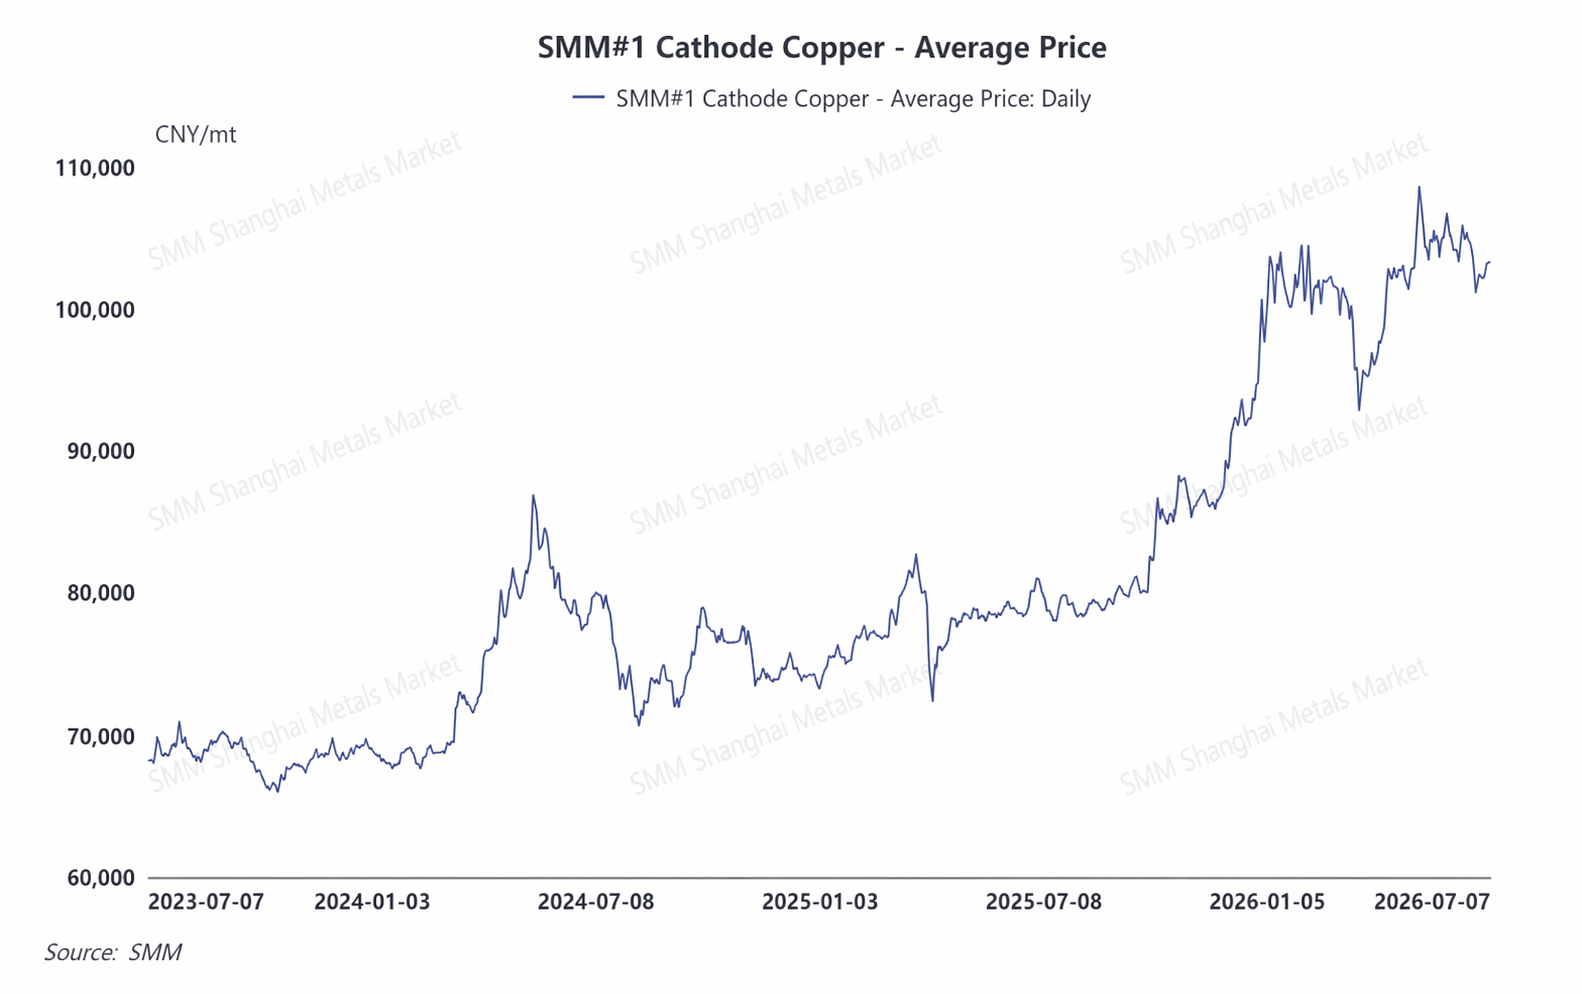
In June, copper prices overall exhibited wild swings. During the downward phase, end-user purchase willingness heated up, with concentrated copper lock-in stockpiling, briefly boosting order increases; but as copper prices rebounded and the industry entered the traditional consumption off-season, the overall new order scale contracted again. End-user demand by segment polarized, with orders for State Grid projects, offshore wind power, new energy support facilities, and AI computing power cables being well received, providing demand support; while demand in other downstream sectors such as real estate and civilian use remained mediocre with no clear improvement signals.

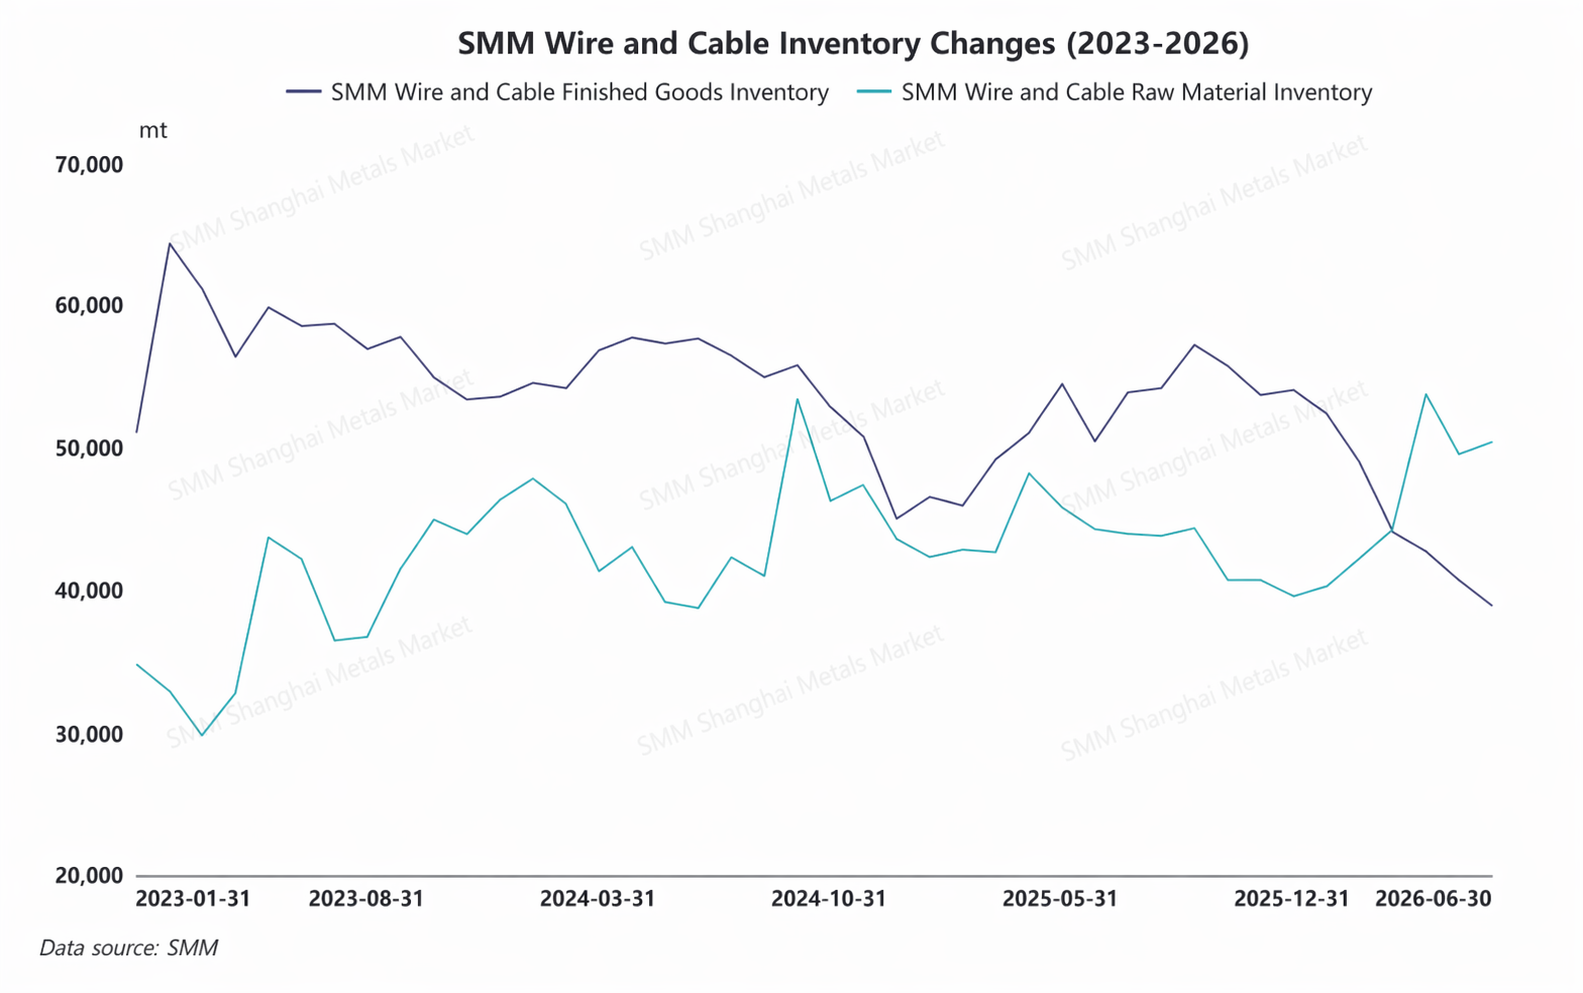
In June, days of raw material inventories for copper wire and cable decreased by 0.1 days MoM, while days of finished product inventories decreased by 0.42 days MoM. After adjusting for day differences, the actual absolute raw material inventory increased by 0.42% MoM, and finished product inventory decreased by 0.79%. During the copper price correction phase, enterprises cautiously engaged in essential stockpiling, driving growth in raw material inventory. However, with sluggish off-season market demand, the pace of end-user cargo pick-up slowed, and finished product warehouse withdrawal efficiency was low, so finished product inventories edged down.
The operating rate in July is expected to increase by 0.43 percentage points MoM to 72.45%, and up 0.61 percentage points YoY. New orders secured in June and earlier low-price copper lock-in orders will gradually enter the production schedule, providing effective support for the industry's operating rate. However, as July remains in the traditional demand off-season, with insufficient real market essentials demand, end-user new orders will likely weaken MoM. Constrained by multiple factors, the overall industry operating rate rebound will be limited.
Data Source Statement: Except for publicly available information, all other data are processed by SMM based on publicly available information, market communication, and relying on SMM's internal database model. They are for reference only and do not constitute decision-making recommendations.

Images in this article contain AI-translated captions for reference only.

For any inquiries or for more information, please contact: lemonzhao@smm.cn
For more information on how to access our research reports, please contact:service.en@smm.cn
Related News
[SMM Analysis] H1 2026 Review of the Copper Scrap Market Outside China: Copper Prices Surged, Tight Raw Material Supply Supported Firm Discounts
1 hour ago
[SMM Analysis] H1 2026 Review of the Copper Scrap Market Outside China: Copper Prices Surged, Tight Raw Material Supply Supported Firm Discounts
Read More
[SMM Analysis] H1 2026 Review of the Copper Scrap Market Outside China: Copper Prices Surged, Tight Raw Material Supply Supported Firm Discounts
[SMM Analysis] H1 2026 Review of the Copper Scrap Market Outside China: Copper Prices Surged, Tight Raw Material Supply Supported Firm Discounts
[SMM Analysis: H1 2026 Review of the Overseas Copper Scrap Market: Copper Prices Surge, Tight Raw Material Supply Supports Firm Discount] In Q1 2026, copper prices stayed high and consolidated around $13,000/mt. It was not until late Q1 that a short-term correction emerged, but prices resumed their uptrend in Q2 and continued to hit new record highs. Behind this, tight copper ore supply provided support on one hand; on the other, the siphon effect on global copper resources triggered by US tariff expectations further amplified market concerns over the supply side. At the same time, rapid growth in new copper-consuming sectors such as NEVs, new energy power, power grid construction, and data centers fueled rising expectations for copper demand. Against the backdrop of supply growth failing to match demand growth, copper prices received strong support. The tight supply of copper units also prompted enterprises to shift their focus from the ore side to supplementary sources beyond mine supply, with copper scrap gaining noticeably in importance. As copper prices continued to surge, copper scrap prices rose in tandem, while structural changes arising from copper resource scarcity began to alter the pricing logic of the copper scrap market, which had previously been dominated by consumption and price differentials.
1 hour ago
[SMM Analysis] Indonesia's May Sulphur and Sulphuric Acid Import and Export Data
1 hour ago
[SMM Analysis] Indonesia's May Sulphur and Sulphuric Acid Import and Export Data
Read More
[SMM Analysis] Indonesia's May Sulphur and Sulphuric Acid Import and Export Data
[SMM Analysis] Indonesia's May Sulphur and Sulphuric Acid Import and Export Data
[SMM Analysis] Indonesia's May Sulphur and Sulphuric Acid Import and Export Data
1 hour ago
[SMM Analysis] May Indonesia Sulphur and Sulphuric Acid Import and Export Data
1 hour ago
[SMM Analysis] May Indonesia Sulphur and Sulphuric Acid Import and Export Data
Read More
[SMM Analysis] May Indonesia Sulphur and Sulphuric Acid Import and Export Data
[SMM Analysis] May Indonesia Sulphur and Sulphuric Acid Import and Export Data
In May 2026, Indonesia's monthly total sulphur imports stood at 277,834.30 mt in physical content, up 3.9% MoM and down 55.80% YoY, with the main importing countries being China, Vietnam, the UK, India, Singapore, Spain, Turkmenistan, Turkey, Saudi Arabia and Japan; Indonesia's monthly total sulphur exports reached 24.08 mt in physical content, with the main export destinations being Germany, Hong Kong, China and the US; Indonesia's monthly total sulphuric acid imports amounted to 55,296.994 mt in physical content, down 68.1% MoM and up 236.6% YoY, mainly from China, India and South Korea; Indonesia's monthly total sulphuric acid exports were 0.
1 hour ago
Off-Season Slows End-User Finished Goods Pickup Pace, July Wire and Cable Operating Rate Upside Room Limited [SMM Analysis] - Shanghai Metals Market (SMM)