Data from the National Bureau of Statistics (NBS) showed that in April 2026, the national consumer prices rose 1.2% YoY. Specifically, urban areas rose 1.2% and rural areas rose 1.0%; food prices fell 1.6%, while non-food prices rose 1.8%; consumer goods prices rose 1.4%, and service prices rose 0.9%. On average from January to April, national consumer prices rose 0.9% compared with the same period last year. In April, national consumer prices rose 0.3% MoM. Specifically, urban areas rose 0.3% and rural areas rose 0.1%; food prices fell 1.6%, while non-food prices rose 0.7%; consumer goods prices rose 0.1%, and service prices rose 0.5%. In April 2026, ex-factory prices of industrial producers rose 2.8% YoY and 1.7% MoM. Purchase prices of industrial producers rose 3.5% YoY and 2.1% MoM. On average from January to April, ex-factory prices of industrial producers rose 0.2% compared with the same period last year, and purchase prices of industrial producers rose 0.5%.
Consumer Prices Rose 1.2% YoY in April 2026
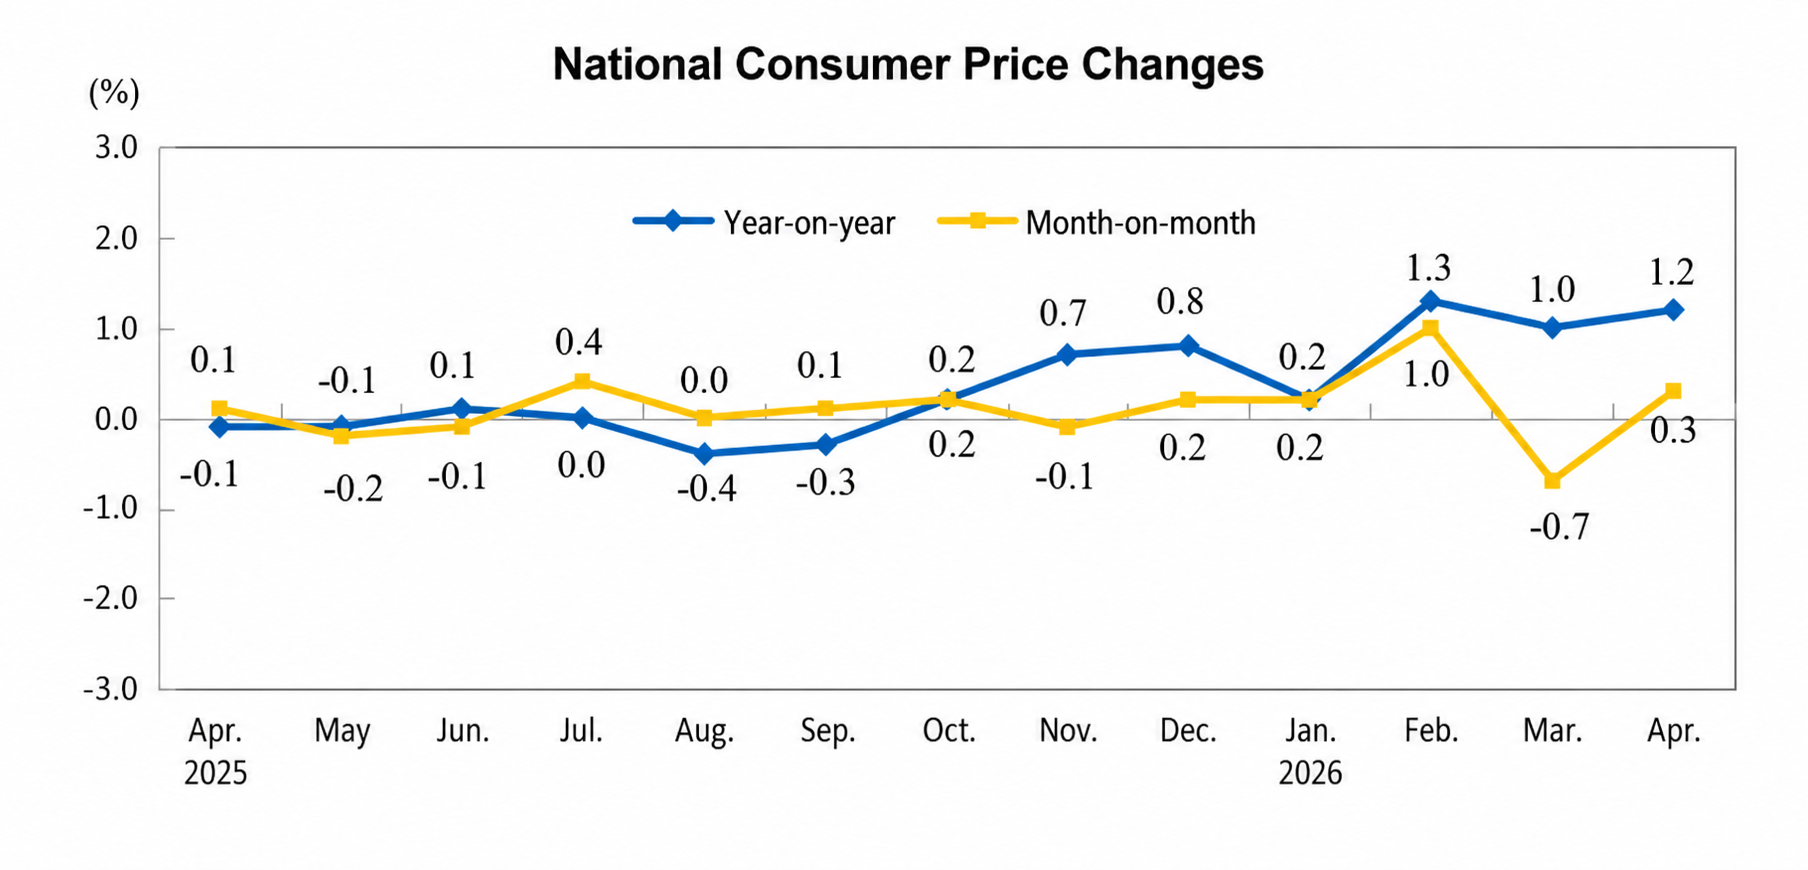
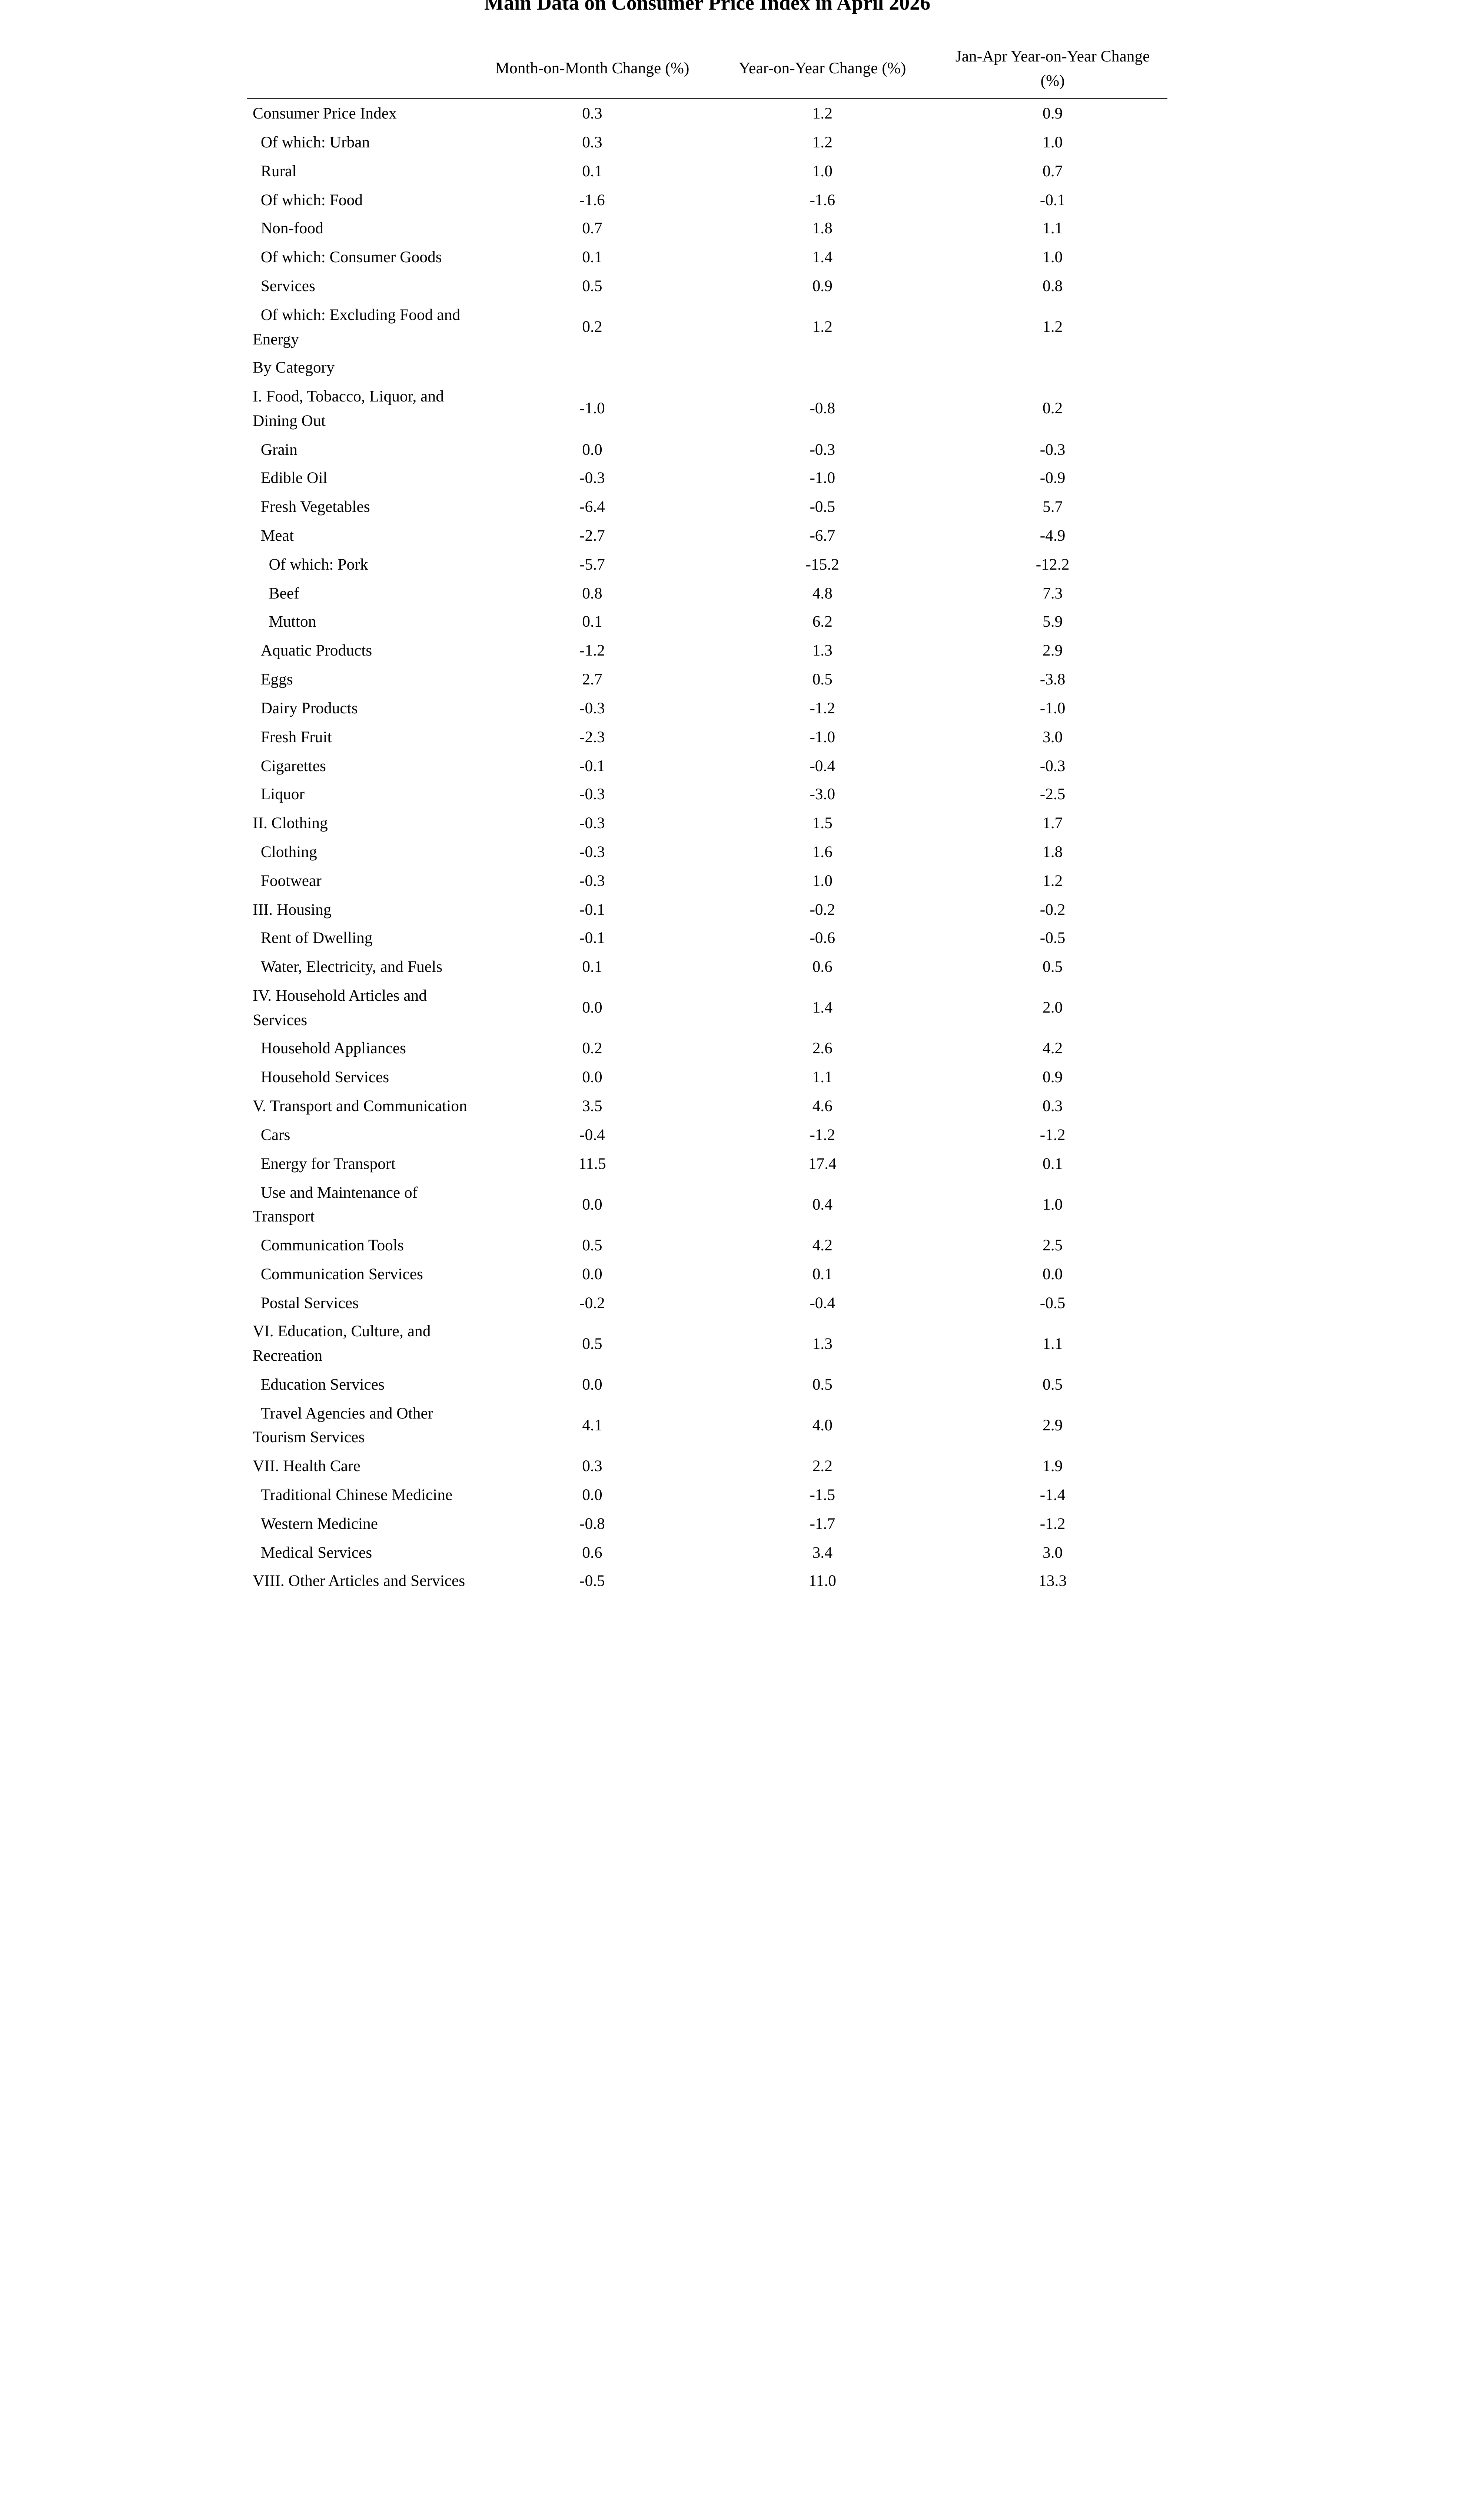
In April 2026, national consumer prices rose 1.2% YoY. Specifically, urban areas rose 1.2% and rural areas rose 1.0%; food prices fell 1.6%, while non-food prices rose 1.8%; consumer goods prices rose 1.4%, and service prices rose 0.9%. On average from January to April, national consumer prices rose 0.9% compared with the same period last year.
In April, national consumer prices rose 0.3% MoM. Specifically, urban areas rose 0.3% and rural areas rose 0.1%; food prices fell 1.6%, while non-food prices rose 0.7%; consumer goods prices rose 0.1%, and service prices rose 0.5%.
I. YoY Changes in Prices of Various Categories of Goods and Services
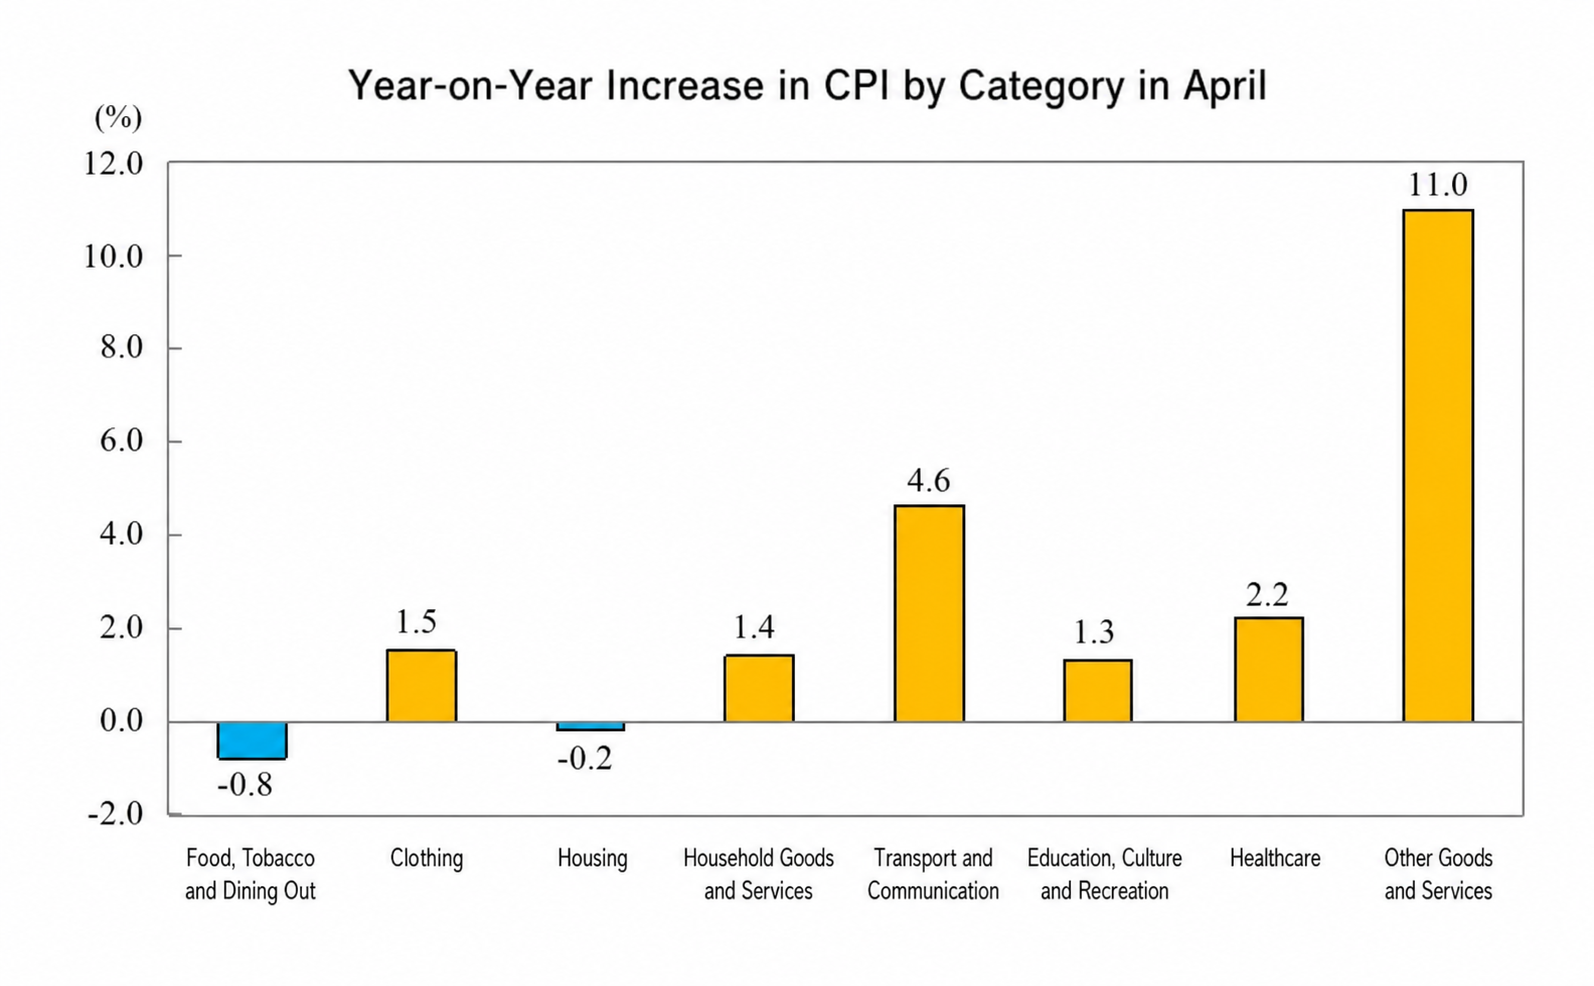
In April, prices of food, tobacco, alcohol, and dining out fell 0.8% YoY, dragging down the CPI by approximately 0.24 percentage points. Among food items, livestock meat prices fell 6.7%, dragging down the CPI by approximately 0.28 percentage points, of which pork prices fell 15.2%, dragging down the CPI by approximately 0.29 percentage points; fresh fruit prices fell 1.0%, dragging down the CPI by approximately 0.02 percentage points; fresh vegetable prices fell 0.5%, dragging down the CPI by approximately 0.01 percentage points; aquatic product prices rose 1.3%, pushing up the CPI by approximately 0.02 percentage points.
Among the other seven major categories, six saw YoY increases and one saw a decline. Specifically, prices of other supplies and services, transportation and communication, and healthcare rose 11.0%, 4.6%, and 2.2%, respectively; prices of clothing, household goods and services, and education, culture, and entertainment rose 1.5%, 1.4%, and 1.3%, respectively; housing prices fell 0.2%.
II. MoM Changes in Prices of Various Categories of Goods and Services
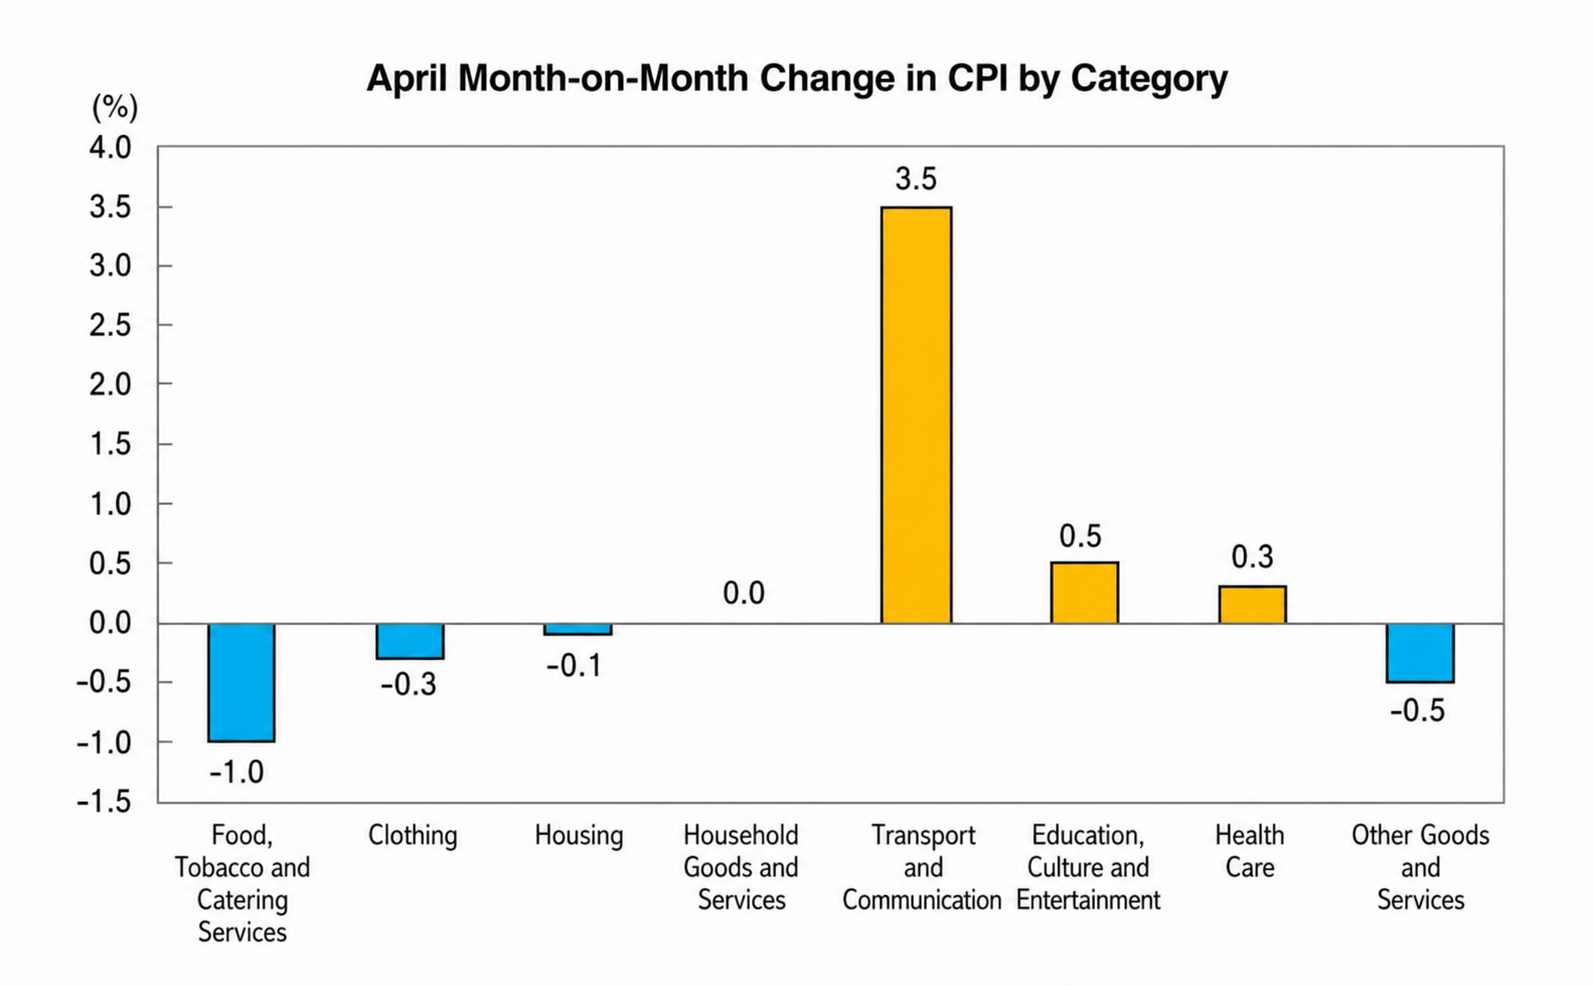
In April, prices of food, tobacco, alcohol, and dining out fell 1.0% MoM, dragging down CPI by approximately 0.28 percentage points. Among food items, fresh vegetable prices fell 6.4%, dragging down CPI by approximately 0.11 percentage points; livestock meat prices fell 2.7%, dragging down CPI by approximately 0.11 percentage points, of which pork prices fell 5.7%, dragging down CPI by approximately 0.10 percentage points; fresh fruit prices fell 2.3%, dragging down CPI by approximately 0.05 percentage points; aquatic product prices fell 1.2%, dragging down CPI by approximately 0.02 percentage points; egg prices rose 2.7%, pushing up CPI by approximately 0.01 percentage points.
Among the other seven major categories, prices rose in three, remained flat in one, and fell in three on a MoM basis. Specifically, prices of transportation and communication, education, culture and recreation, and healthcare rose 3.5%, 0.5%, and 0.3%, respectively; prices of household goods and services remained flat; prices of other goods and services, clothing, and housing fell 0.5%, 0.3%, and 0.1%, respectively.
Industrial Producer Ex-factory Prices Up 2.8% YoY and Up 1.7% MoM in April 2026
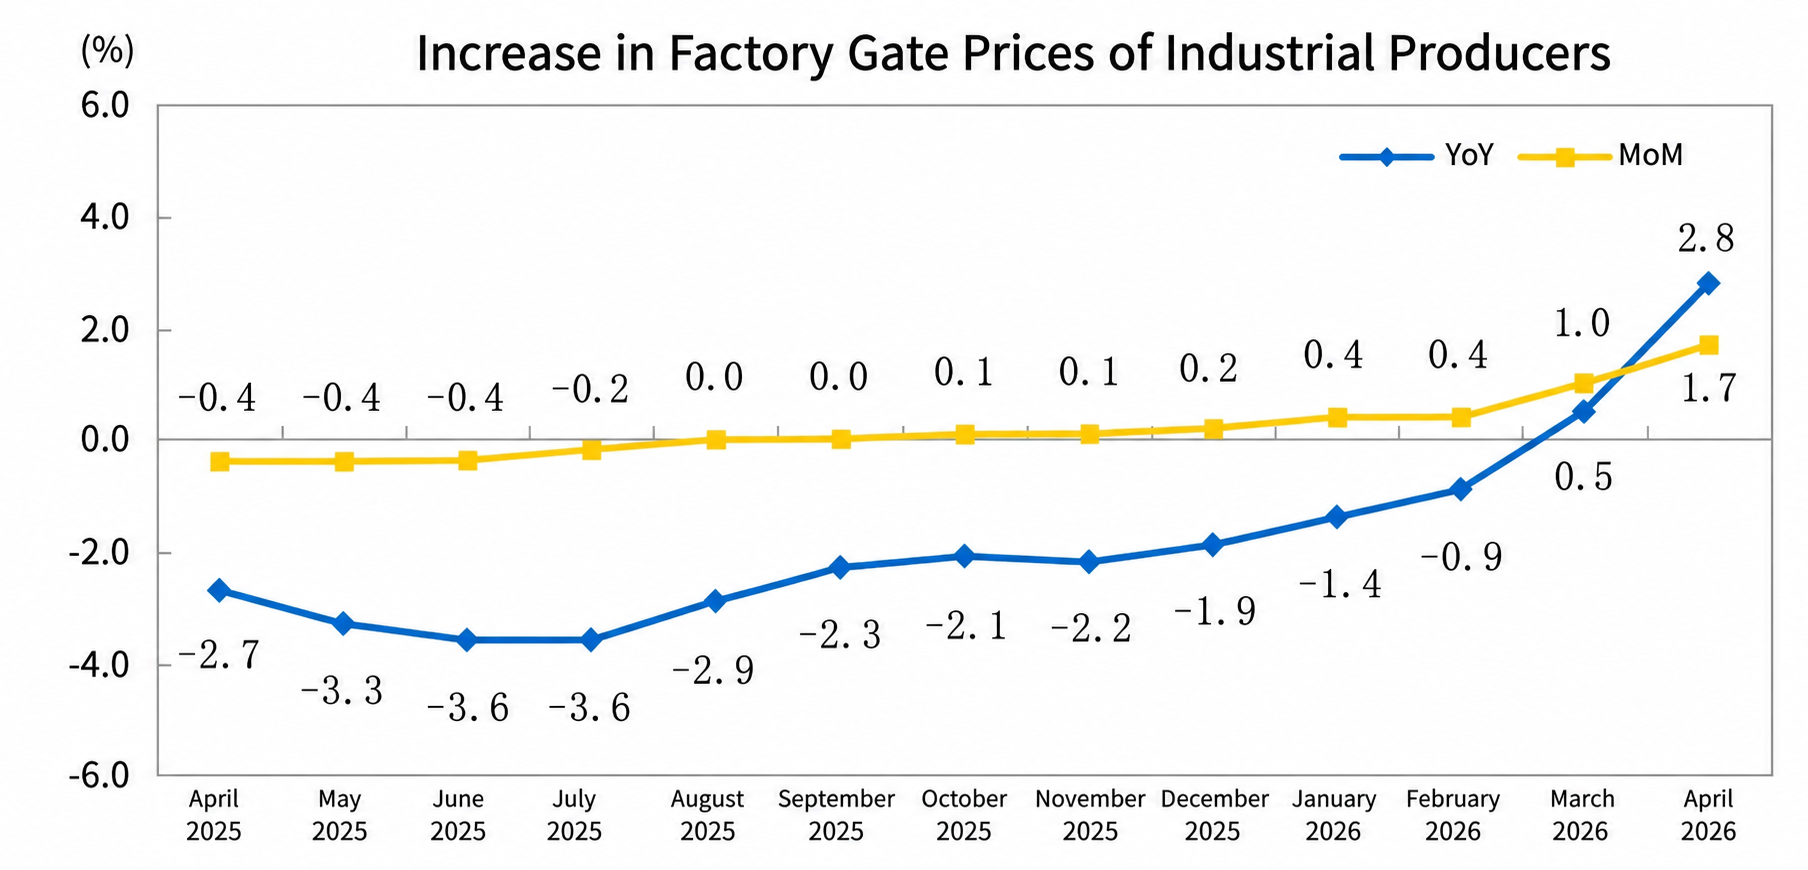
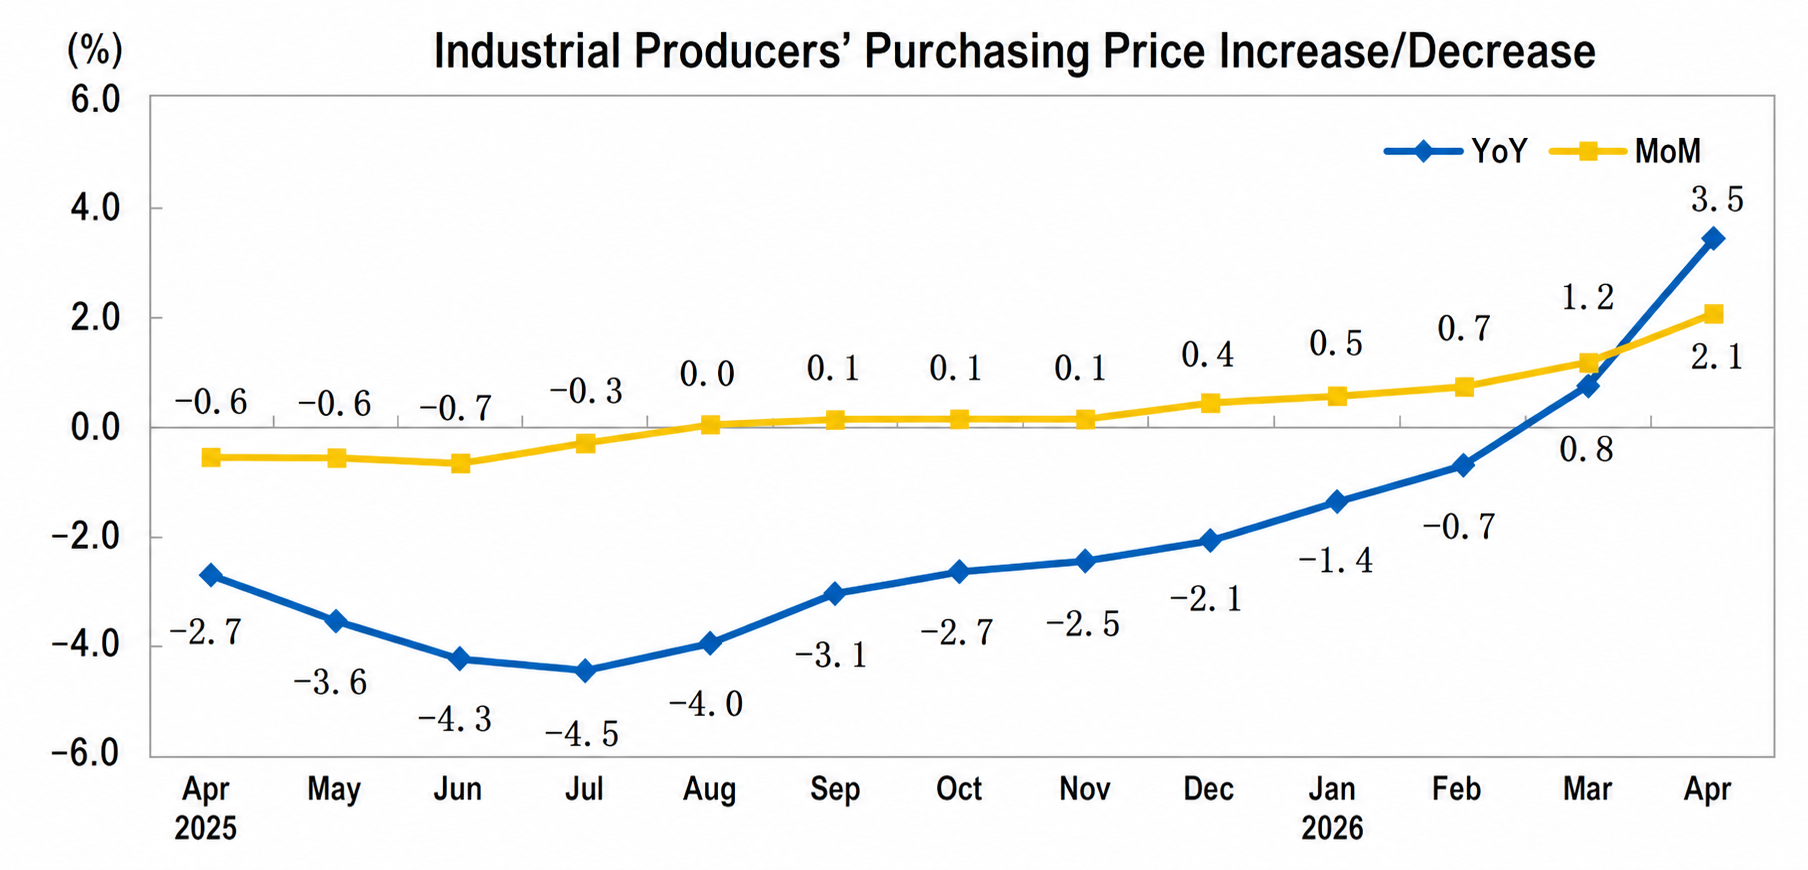
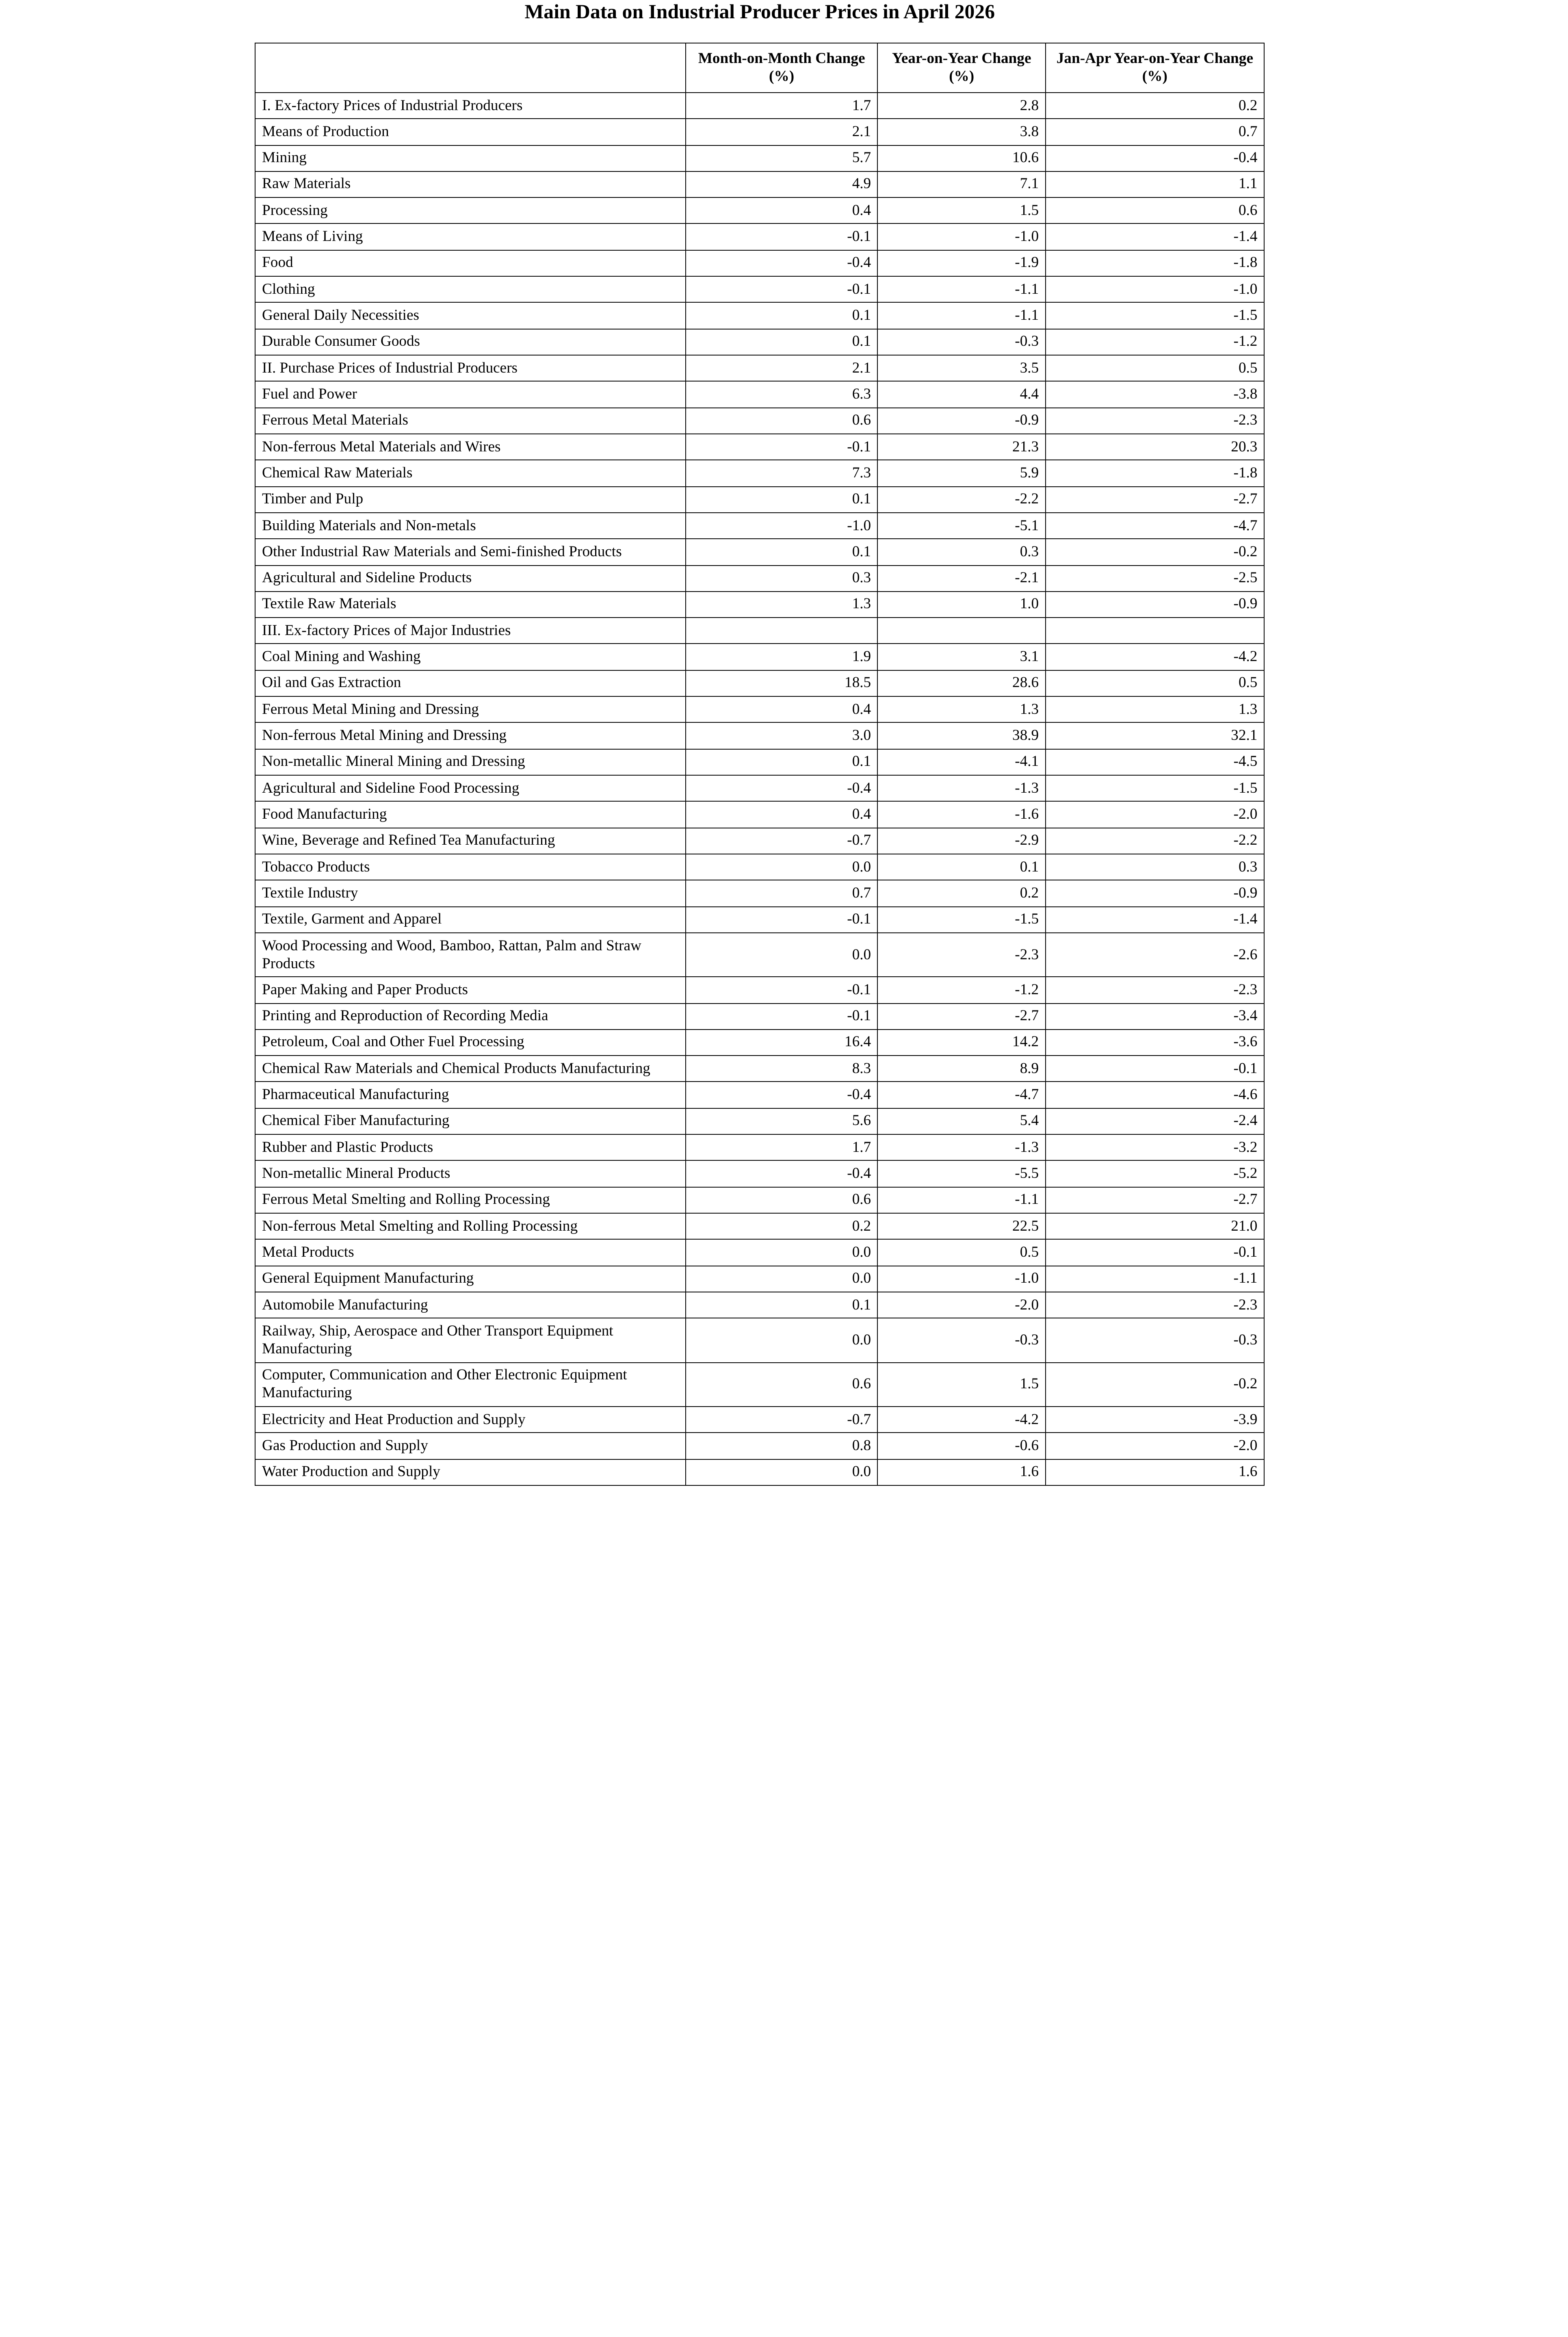
In April 2026, national industrial producer ex-factory prices rose 2.8% YoY and 1.7% MoM. Industrial producer purchase prices rose 3.5% YoY and 2.1% MoM. For the January–April average, industrial producer ex-factory prices rose 0.2% compared with the same period last year, and industrial producer purchase prices rose 0.5%.
I. YoY Changes in Industrial Producer Prices
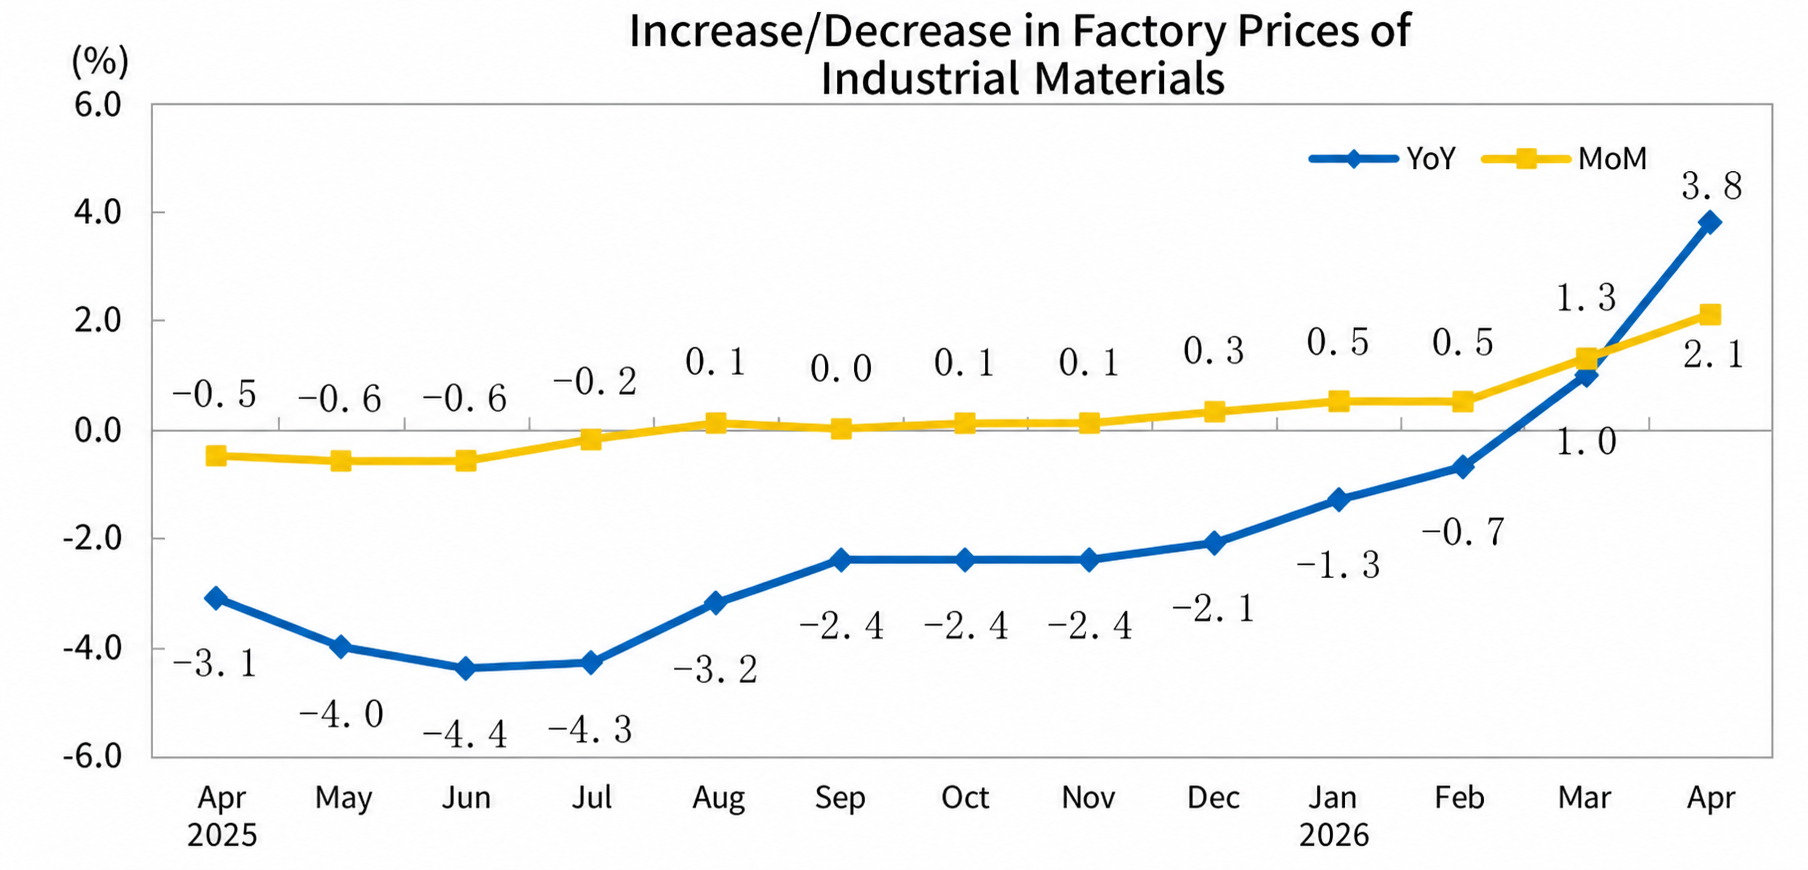
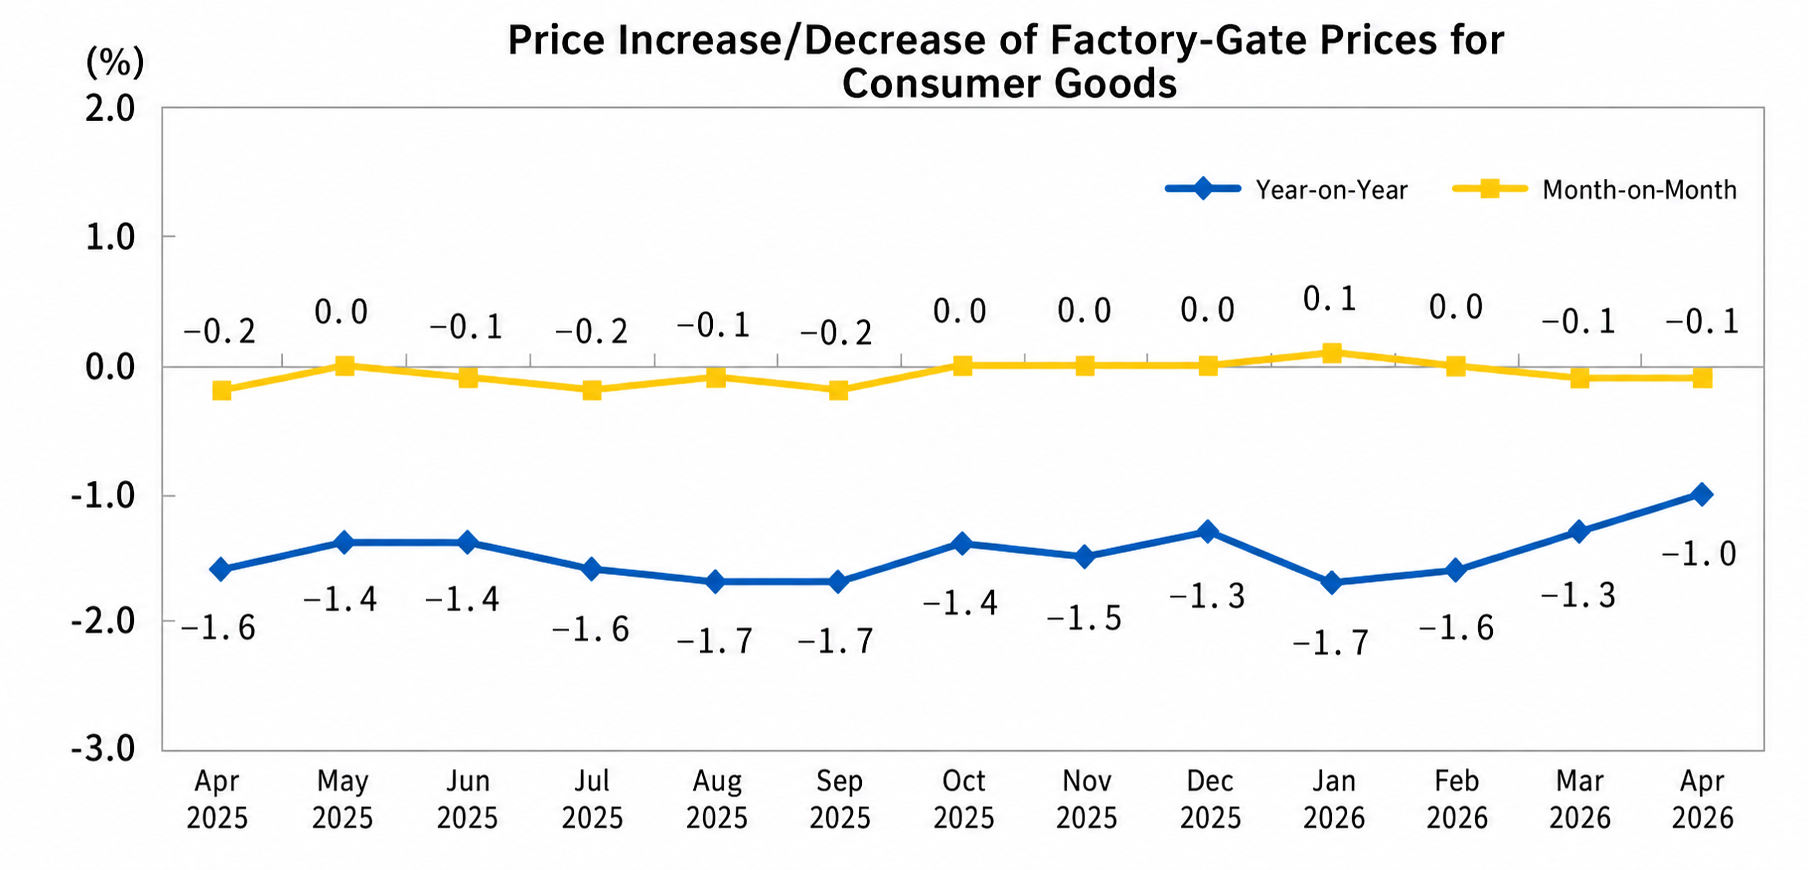
In April, among industrial producer ex-factory prices, prices of production materials rose 3.8%, pushing up the overall industrial producer ex-factory price level by approximately 2.98 percentage points. Specifically, prices of extractive industries rose 10.6%, raw material industries rose 7.1%, and processing industries rose 1.5%. Prices of consumer goods fell 1.0%, dragging down the overall industrial producer ex-factory price level by approximately 0.23 percentage points. Specifically, food prices fell 1.9%, clothing and general daily necessities prices both fell 1.1%, and durable consumer goods prices fell 0.3%.
Among industrial producer purchase prices, prices of non-ferrous metal materials and wire rose 21.3%, chemical raw materials rose 5.9%, fuel and power rose 4.4%, and textile raw materials rose 1.0%; prices of building materials and non-metallic minerals fell 5.1%, agricultural by-products fell 2.1%, and ferrous metals materials fell 0.9%.
II. MoM Changes in Industrial Producer Prices
In April, among industrial producer ex-factory prices, prices of producer goods rose 2.1%, contributing approximately 1.68 percentage points to the overall increase in industrial producer ex-factory prices. Specifically, prices of extractive industries rose 5.7%, raw material industries rose 4.9%, and processing industries rose 0.4%. Prices of consumer goods fell 0.1%, dragging down the overall industrial producer ex-factory price level by approximately 0.02 percentage points. Specifically, food prices fell 0.4%, clothing prices fell 0.1%, and prices of both general daily necessities and durable consumer goods rose 0.1%.
Among industrial producer purchase prices, prices of chemical raw materials rose 7.3%, fuel and power rose 6.3%, textile raw materials rose 1.3%, ferrous metals rose 0.6%, and agricultural by-products rose 0.3%; prices of building materials and non-metallic minerals fell 1.0%, and non-ferrous metals and wires fell 0.1%.
April 2026: CPI Mildly Rebounded, PPI Growth Expanded
— Interpretation of April 2026 CPI and PPI Data by Dong Lijuan, Chief Statistician of the Urban Division, National Bureau of Statistics (NBS)
In April, influenced by changes in international crude oil prices and increased travel demand during holidays, the Consumer Price Index (CPI) rose 0.3% MoM and 1.2% YoY. Core CPI, excluding food and energy prices, rose 1.2% YoY, maintaining a mild rebound. Influenced by the rapid rise in international commodity prices, increased demand in some domestic industries, and continuous optimization of market competition order, the Producer Price Index (PPI) rose 1.7% MoM and 2.8% YoY, with growth rates expanding from the previous month.
I. CPI Mildly Rebounded
On a MoM basis, the national CPI shifted from a 0.7% decline in the previous month to a 0.3% increase, 0.4 percentage points above the seasonal level, mainly driven by rising energy and travel service prices. Affected by fluctuations in international crude oil prices, China's energy prices rose 5.7%, with the increase expanding 0.9 percentage points from the previous month, contributing approximately 0.39 percentage points to the MoM CPI increase. Among them, gasoline prices rose 12.6%. Service prices shifted from a 1.1% decline in the previous month to a 0.5% increase, 0.2 percentage points above the seasonal level, contributing approximately 0.22 percentage points to the MoM CPI increase. Specifically, driven by the Qingming Festival holiday, Labour Day holiday, and spring breaks in some regions, travel service demand increased significantly, with prices of airfares, vehicle rentals, travel agency fees, and hotel accommodation rising 29.2%, 8.6%, 4.5%, and 3.9% respectively, all exceeding seasonal levels. These four items combined contributed approximately 0.17 percentage points to the MoM CPI increase; medical service prices rose 0.6%, contributing approximately 0.04 percentage points to the MoM CPI increase. Food prices fell 1.6%, with the decline narrowing by 1.1 percentage points from the previous month, dragging CPI down by approximately 0.28 percentage points MoM. Within food, as the weather warmed up, large quantities of fresh vegetables and fresh fruits came to market, with prices falling 6.4% and 2.3% respectively; pork and aquatic products were in ample supply, with prices falling 5.7% and 1.2% respectively. These four items combined dragged CPI down by approximately 0.28 percentage points MoM. Egg prices rose 3.4%, contributing approximately 0.01 percentage points to MoM CPI growth. Excluding energy, industrial consumer goods prices fell 0.2%, remaining largely stable.
On a YoY basis, the national CPI rose 1.2%, with the increase expanding by 0.2 percentage points from the previous month. Industrial consumer goods prices rose 3.5% this month, with the increase expanding by 1.3 percentage points from the previous month, contributing approximately 1.06 percentage points to YoY CPI growth. Within industrial consumer goods, affected by fluctuations in international commodity prices, China's gasoline and gold jewellery prices saw significant changes. Specifically, gasoline price growth expanded to 19.3%, contributing approximately 0.56 percentage points to YoY CPI growth; gold jewellery price growth pulled back to 46.9%, contributing approximately 0.2 percentage points to YoY CPI growth; household appliances and clothing prices rose 2.6% and 1.6% respectively, together contributing approximately 0.11 percentage points to YoY CPI growth. Services prices rose 0.9%, with the increase expanding by 0.1 percentage points from the previous month, contributing approximately 0.44 percentage points to YoY CPI growth. Within services, prices of basic public service items remained generally stable, with medical services and education services prices rising 3.4% and 0.5% respectively, together contributing approximately 0.25 percentage points to YoY CPI growth; travel services price growth expanded somewhat, rising 3.7% this month, contributing approximately 0.13 percentage points to YoY CPI growth; labour services prices edged up, with pet services, dining out, domestic services, and vehicle repair and maintenance prices rising between 1.1% and 1.4%, together contributing approximately 0.1 percentage points to YoY CPI growth. Food prices shifted from a 0.3% increase in the previous month to a 1.6% decline. Within food, pork prices fell 15.2%, with the decline expanding by 3.7 percentage points from the previous month, dragging YoY CPI down by approximately 0.29 percentage points; fresh vegetables and fresh fruits prices fell 0.5% and 1.0% respectively; beef, mutton, aquatic products, and egg prices all rose, with increases ranging between 1.0% and 6.2%.
II. PPI Growth Expanded
On a MoM basis, the national PPI rose 1.7%, with the increase expanding by 0.7 percentage points from the previous month. The main characteristics of PPI MoM movements this month were: first, international imported factors drove up prices in China's petroleum-related industries. Rising international crude oil prices drove up prices in China's petroleum-related industries. Specifically, prices in the petroleum and natural gas extraction industry rose 18.5% MoM, the petroleum, coal, and other fuel processing industry rose 16.4%, the chemical raw materials and chemical products manufacturing industry rose 8.3%, the chemical fiber manufacturing industry rose 5.6%, and the rubber and plastics products industry rose 1.7%. Second, increased demand in some domestic industries drove prices up. Rapid growth in computing power demand and accelerated electrification drove optical fiber manufacturing prices up 22.5% MoM, external storage devices and components prices up 3.2%, and non-ferrous metal smelting and rolling processing industry prices up 0.2%; thermal coal restocking demand was released, combined with increased non-power coal demand from chemical and metallurgical industries, driving coal mining and washing industry prices up 1.9%; continued advancement of manufacturing equipment upgrades drove increased steel demand, with ferrous metals smelting and rolling processing industry prices up 0.6%. Third, the competitive order in the Chinese market continued to improve, with related industry prices rising or declines narrowing. The in-depth rectification of involution-style competition continued to show results, with lithium-ion battery manufacturing prices up 1.6% MoM, new energy vehicle manufacturing prices down 0.1%, with the decline narrowing by 0.7 percentage points from the previous month.
On a YoY basis, the national PPI rose 2.8%, with the increase expanding by 2.3 percentage points from the previous month. Among the major industries with price increases, non-ferrous metal ore mining and dressing rose 38.9%, non-ferrous metal smelting and rolling processing rose 22.5%, together contributing approximately 1.58 percentage points to the YoY PPI increase; petroleum and natural gas extraction rose 28.6%, petroleum, coal, and other fuel processing rose 14.2%, chemical raw materials and chemical products manufacturing rose 8.9%, together contributing approximately 1.5 percentage points to the YoY PPI increase; electrical machinery and equipment manufacturing rose 3.6%, computer, communication, and other electronic equipment manufacturing rose 1.5%, together contributing approximately 0.46 percentage points to the YoY PPI increase. Among the major industries with price declines, non-metallic mineral products fell 5.5%, electricity and heat production and supply fell 4.2%, automobile manufacturing fell 2.0%, and ferrous metals smelting and rolling processing fell 1.1%, together contributing approximately 0.75 percentage points to the YoY PPI decline.
![US Dollar Weakens on Weekly Chart, Metals Broadly Rise, LME Tin Up Nearly 5%, LME Zinc and COMEX Silver Up Over 2%, Gold, Silver End Week Higher [Overnight Market]](https://imgqn.smm.cn/usercenter/tSwaX20251217171735.jpg)
![In the short term, ferrous metals are consolidating at lows, and close attention should be paid to steel mill maintenance situations [SMM Steel Industry Chain Weekly Report]](https://imgqn.smm.cn/usercenter/nDTpN20251217171748.jpg)
![[SMM Analysis]Aluminum Billet Inventory Falls to 130,000 mt, Warehouse Withdrawals Rebound, Processing Fees Soften](https://imgqn.smm.cn/usercenter/DRlGu20251217171652.jpg)