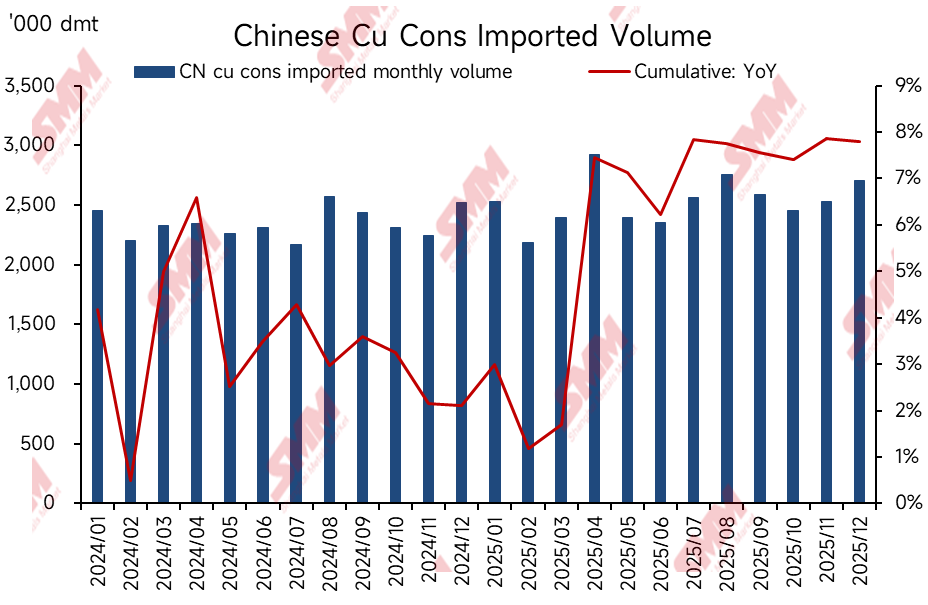
According to data from the General Administration of Customs, China imported 2.704 million dmt of copper ore and concentrates in December 2025, a month-on-month increase of 7% and a year-on-year increase of 7.2%. From January to December, China’s cumulative imports of copper ore and concentrates reached 30.365 million dmt, a cumulative year-on-year increase of 7.8%.
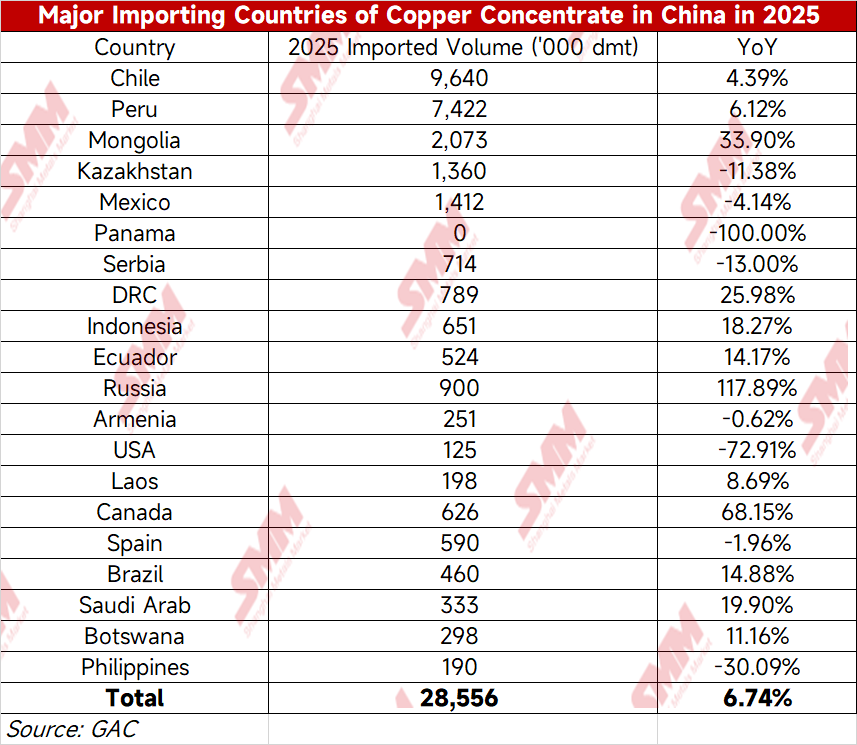
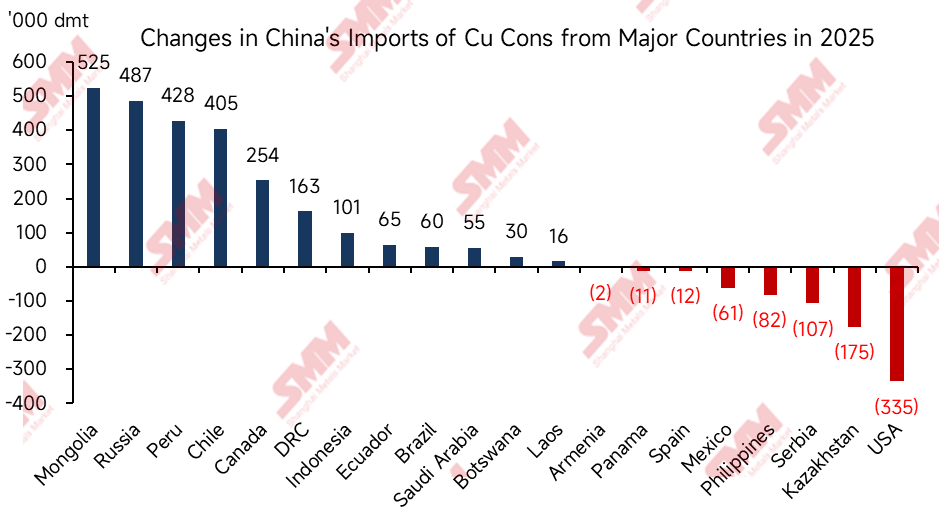
In terms of imports by country from January to December this year, Mongolia, the Russian Federation, Chile, Peru, and Canada were the main sources of import growth. Decreases in imports mainly occurred in the United States, Kazakhstan, Serbia, and other countries.
Mongolia: Benefiting from the production growth of the Oyu Tolgoi copper mine this year, according to Rio Tinto's 2025 production report, the incremental copper production of the OT mine reached 130,000 metric tons in 2025. As China's demand for copper concentrate increases, Mongolia's copper concentrate has also been flowing into the Chinese market via land transportation to supply smelters in northwestern China. The incremental copper concentrate from Mongolia in 2025 amounted to 520,000 dmt.
Chile: China's imports of copper concentrate from Chile increased by 410,000 dmt year-on-year in 2025. Based on the 2025 production data released by BHP and Antofagasta, this was mainly driven by production increments from copper mines such as Escondida (up 73,000 metric tons of metal content year-on-year) and Centinela (up 58,000 metric tons of metal content year-on-year).
Peru: China's imports of copper concentrate from Peru increased by 430,000 dmt year-on-year in 2025. According to the 2025 production data released by MMG, this was mainly driven by production increments from copper mines such as Las Bambas (up 88,000 metric tons of metal content year-on-year).
Russia: Due to geopolitical and international political factors, China is the largest customer of electrolytic copper and copper concentrate for the Russian Federation. Naturally, Russia’s surplus copper concentrate has been increasingly exported to China, supplying smelters in northern and northeastern China. The incremental production from the Udokan copper mine in the Far East continues to be released, with further increases in exports to China. In 2025, China’s imports of copper concentrate from the Russian Federation increased by 490,000 dmt.
Indonesia:Although China's total imports of cu cons from Indonesia in 2025 were impacted by production accidents at Indonesian copper mines—according to SMM estimates, the Grasberg mine accident alone reduced Indonesia's cu cons production by approximately 442,000 metal tons—actual imports increased instead, rising by 100,000 dmt year-on-year. This phenomenon was primarily driven by the Indonesian government's continuous support through export license policies: in March 2025, the Indonesian government issued a six-month cu cons export license to Freeport Indonesia, and in October of the same year, it granted a new export license to Amman Mineral International. Against the backdrop of relaxed export policies, accumulated cu cons inventories in Indonesia were able to flow more toward China, the world's largest cu cons consumer. This helped offset part of the supply gap caused by local production reductions and contributed to the counter-trend growth in exports to China.
United States: Affected by the Sino-US tariff war, China imposed tariffs on copper concentrate originating from the United States. As a result, Chinese smelters reduced their demand for copper concentrate from the US. This portion of the supply mainly shifted to countries like Japan and South Korea. In 2025, China’s imports of copper concentrate from the United States decreased by 340,000 dmt year-on-year.
Kazakhstan: China’s imports of copper concentrate from Kazakhstan decreased by 170,000 dmt year-on-year in 2025. SMM believes this may be due to a safety incident at a Kaz Minerals copper mine earlier this year, which created a supply gap at the Kazakhmys PLC smelter. Consequently, copper concentrate produced by Kaz Minerals needed to be prioritized for its affiliate, Kazakhmys PLC, leading to reduced copper ore imports from Kazakhstan by China.
In the process of dynamic restructuring of the global copper resource landscape, the changes in China’s copper concentrate import pattern in 2025 profoundly reflect the interplay of regional supply, geopolitical relations, and market choices. Import growth from countries such as Mongolia, Russia, Chile, and Peru not only benefits from production releases at major local copper mines but also reflects China’s strategic efforts to strengthen resource connections through land transportation and traditional trade routes. Meanwhile, import declines from countries like the United States and Kazakhstan are constrained by factors such as tariff policies and internal supply adjustments, highlighting the geopolitical sensitivity and elasticity of supply chains. It is particularly noteworthy that even as Indonesia’s overall production suffered setbacks, China still increased its imports of Indonesian copper concentrate. This underscores the pragmatism and flexibility displayed by smelting enterprises in raw material selection to ensure supply amid the current tightening raw material environment. These shifts are not merely numerical changes in market supply and demand but a vivid portrayal of the global industrial chain seeking new balance amid fluctuations.
![2026 China's Copper Anode Market H1: Supply Contraction Reverses the Pattern [SMM Analysis]](https://imgqn.smm.cn/usercenter/YIaMU20251217171711.jpg)
![2026 China Copper Foil Industry Half-Year Summary and Outlook [SMM Analysis]](https://imgqn.smm.cn/usercenter/kvwSZ20251217171710.jpg)
![[SMM Analysis] H1 2026 Review of the Copper Scrap Market Outside China: Copper Prices Surged, Tight Raw Material Supply Supported Firm Discounts](https://imgqn.smm.cn/usercenter/pJSbE20251217171713.jpeg)