According to data from the National Bureau of Statistics (NBS), in September 2025, the national consumer price index decreased by 0.3% YoY. Specifically, prices in urban areas fell by 0.2%, while those in rural areas dropped by 0.5%; food prices decreased by 4.4%, while non-food prices increased by 0.7%; prices of consumer goods fell by 0.8%, while prices of services rose by 0.6%. On average from January to September, the national consumer price index decreased by 0.1% compared to the same period last year. In September, the national consumer price index increased by 0.1% MoM. Specifically, prices in urban areas remained flat, while those in rural areas rose by 0.2%; food prices increased by 0.7%, while non-food prices decreased by 0.1%; prices of consumer goods rose by 0.3%, while prices of services fell by 0.3%.
Consumer Prices in September 2025: Down 0.3% YoY, Up 0.1% MoM
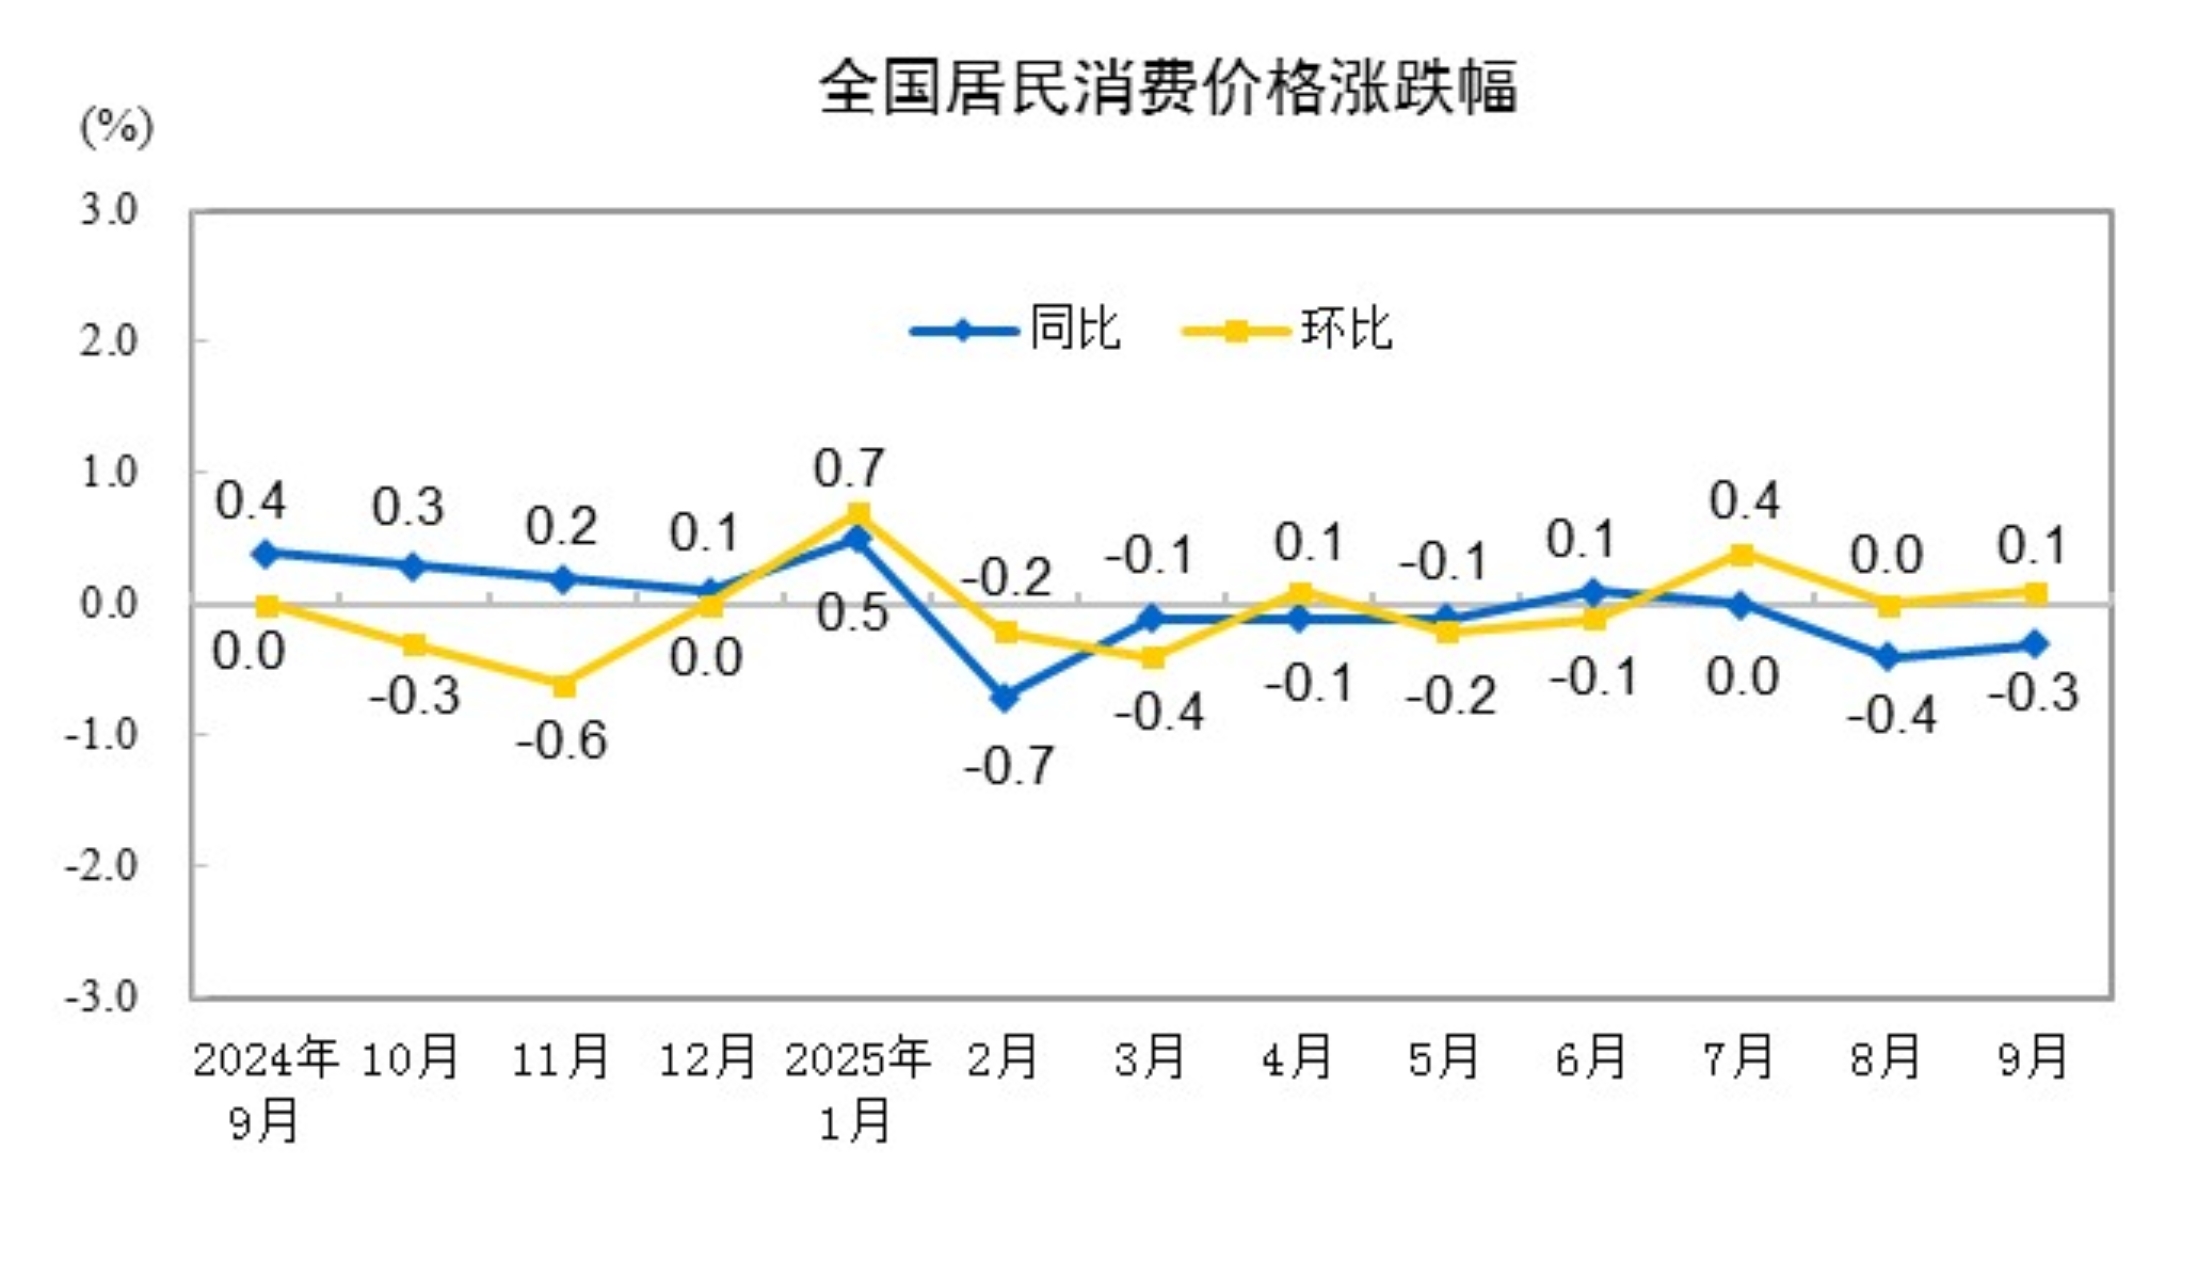
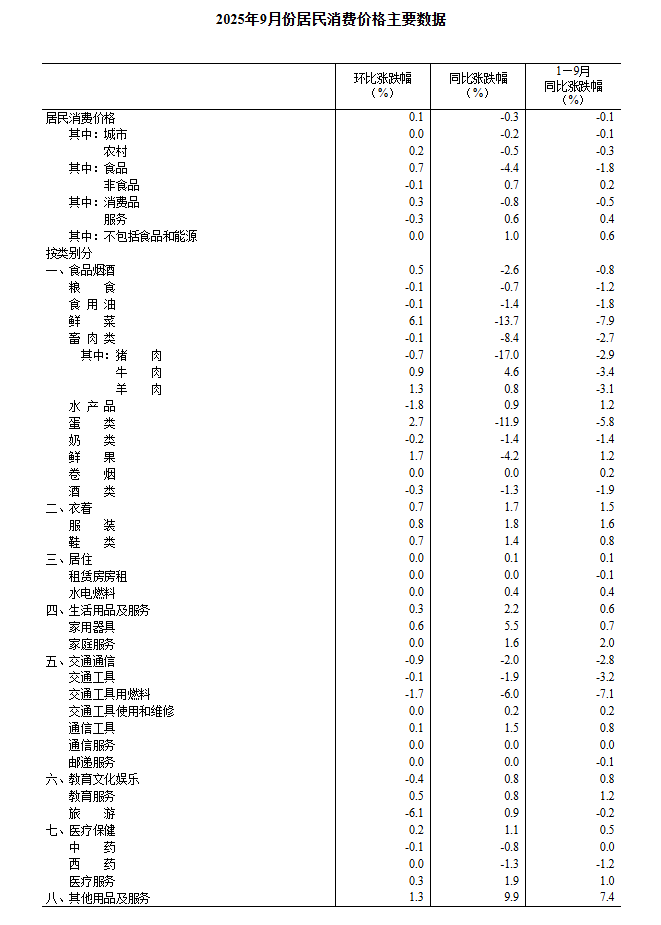
In September 2025, the national consumer price index decreased by 0.3% YoY. Specifically, prices in urban areas fell by 0.2%, while those in rural areas dropped by 0.5%; food prices decreased by 4.4%, while non-food prices increased by 0.7%; prices of consumer goods fell by 0.8%, while prices of services rose by 0.6%. On average from January to September, the national consumer price index decreased by 0.1% compared to the same period last year.
In September, the national consumer price index increased by 0.1% MoM. Specifically, prices in urban areas remained flat, while those in rural areas rose by 0.2%; food prices increased by 0.7%, while non-food prices decreased by 0.1%; prices of consumer goods rose by 0.3%, while prices of services fell by 0.3%.
I. Year-over-Year Changes in Prices of Various Goods and Services
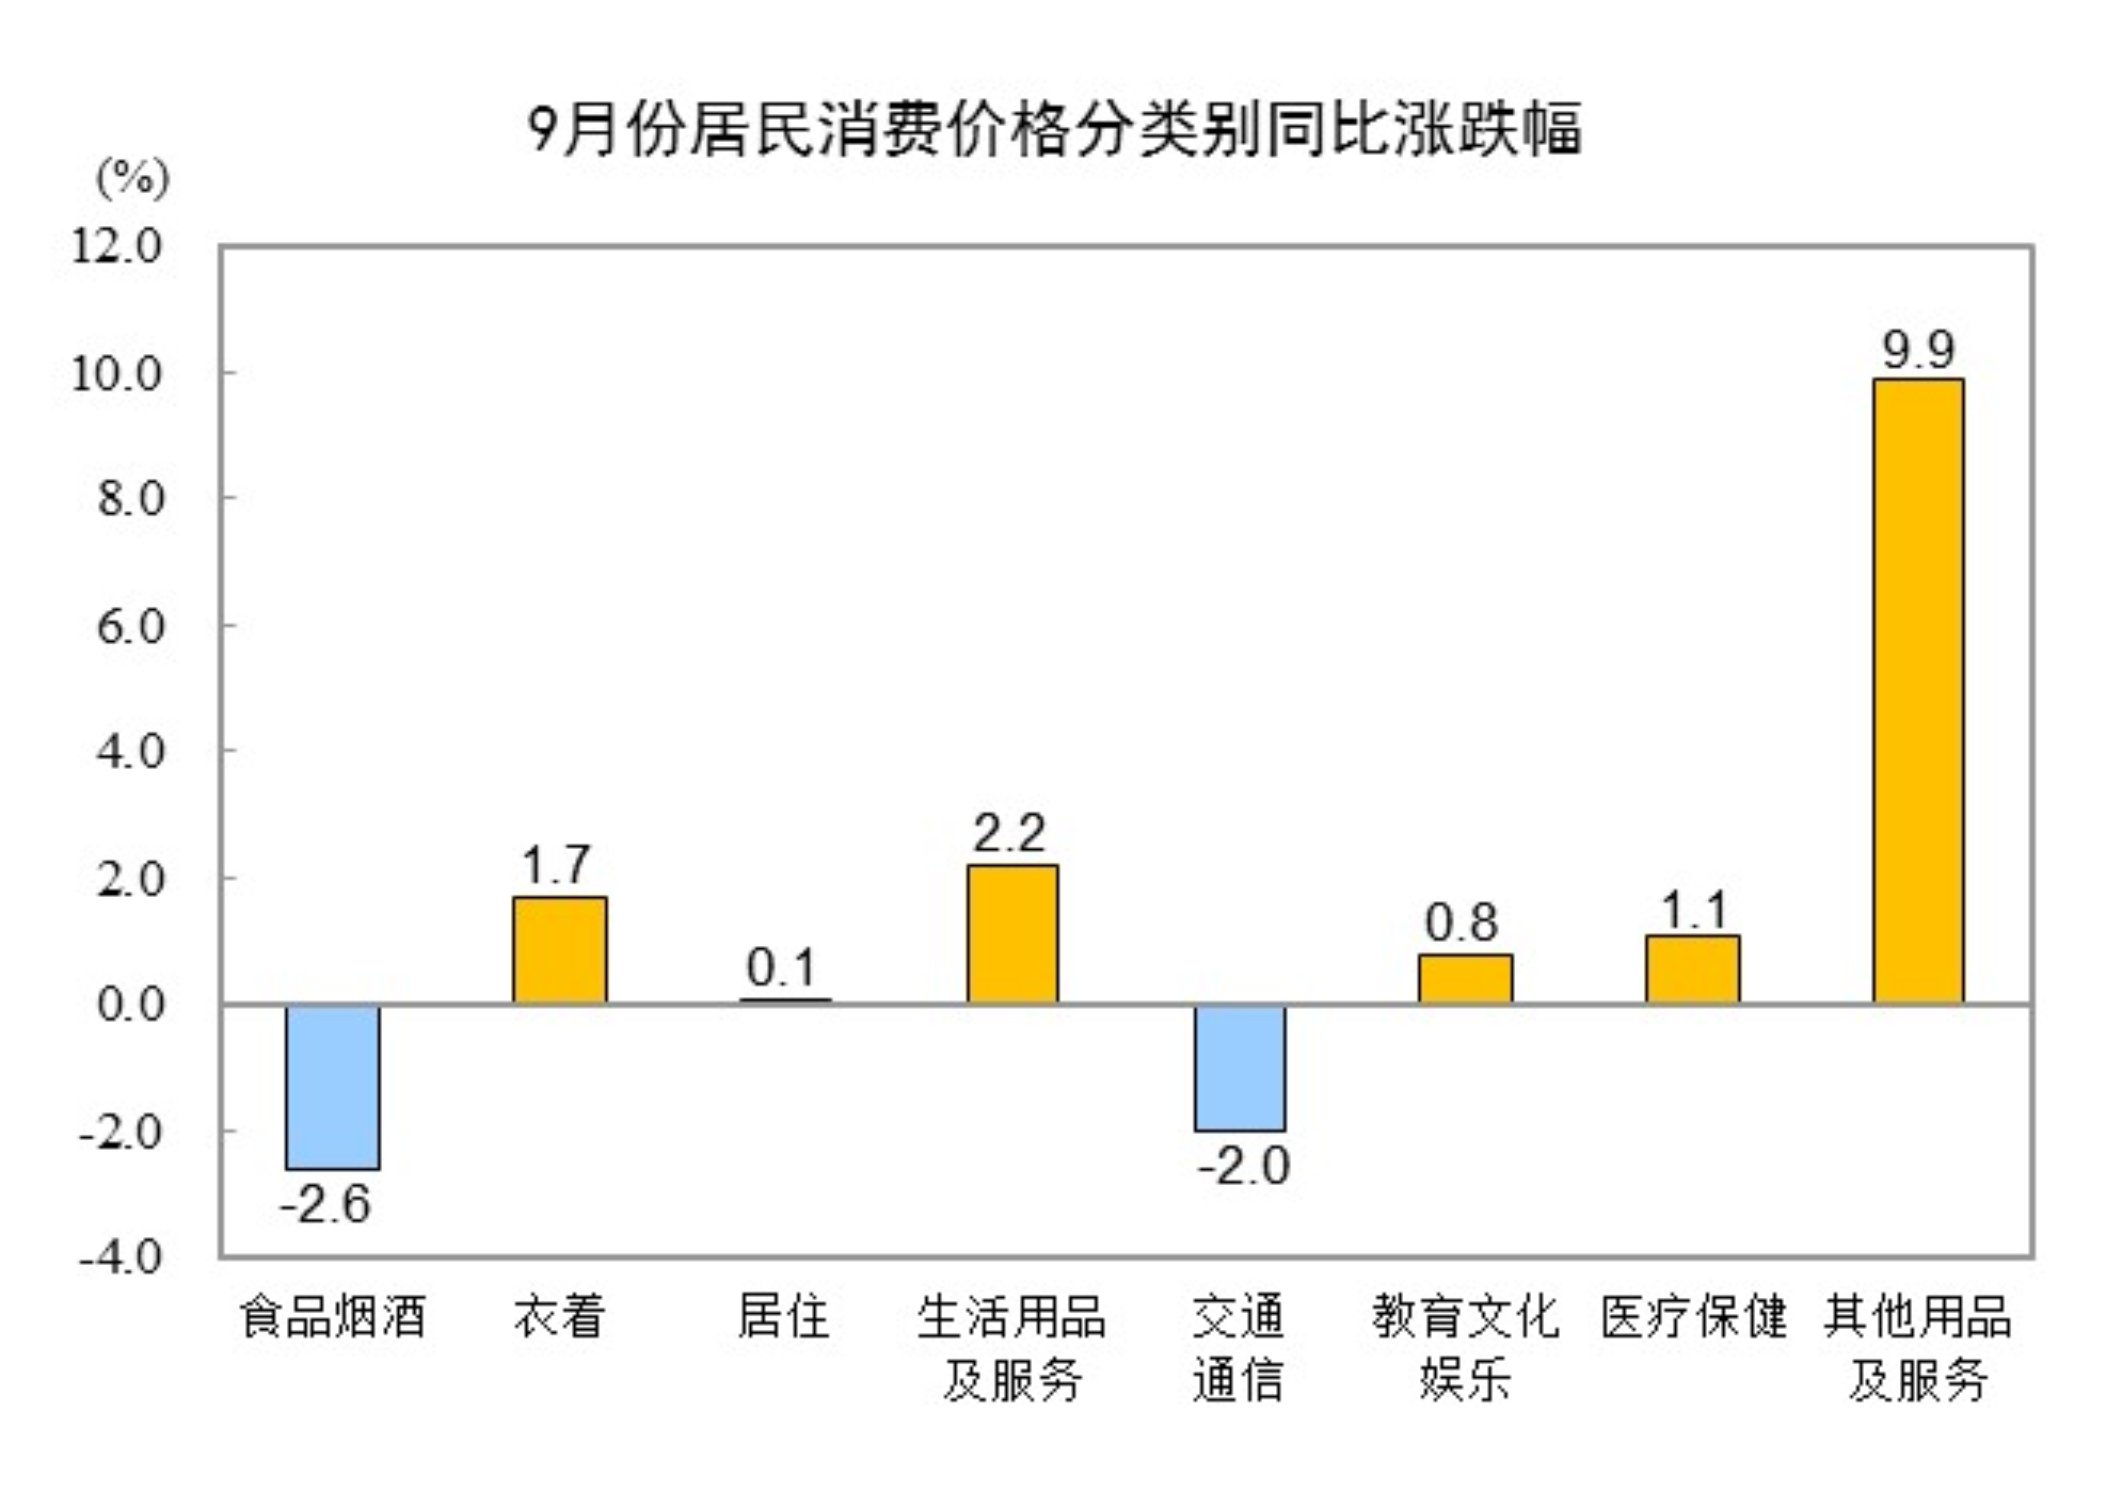
In September, prices for food, tobacco, and alcohol decreased by 2.6% YoY, dragging down the CPI (Consumer Price Index) by approximately 0.74 percentage points. Within the food category, fresh vegetable prices fell by 13.7%, pulling down the CPI by about 0.35 percentage points; egg prices decreased by 11.9%, dragging down the CPI by about 0.08 percentage points; prices of livestock meat dropped by 8.4%, pulling down the CPI by approximately 0.27 percentage points, among which pork prices fell by 17.0%, dragging down the CPI by about 0.26 percentage points; fresh fruit prices decreased by 4.2%, pulling down the CPI by about 0.09 percentage points; grain prices fell by 0.7%, dragging down the CPI by about 0.01 percentage points; prices of aquatic products increased by 0.9%, pushing up the CPI by approximately 0.02 percentage points.
Among the other seven major categories, six saw year-over-year price increases, while one decreased. Specifically, prices for other supplies and services, household goods and services, and clothing increased by 9.9%, 2.2%, and 1.7%, respectively; prices for health care, education, culture and entertainment, and housing rose by 1.1%, 0.8%, and 0.1%, respectively; while prices for transportation and communication decreased by 2.0%.
II. Month-over-Month Price Changes for Various Goods and Services
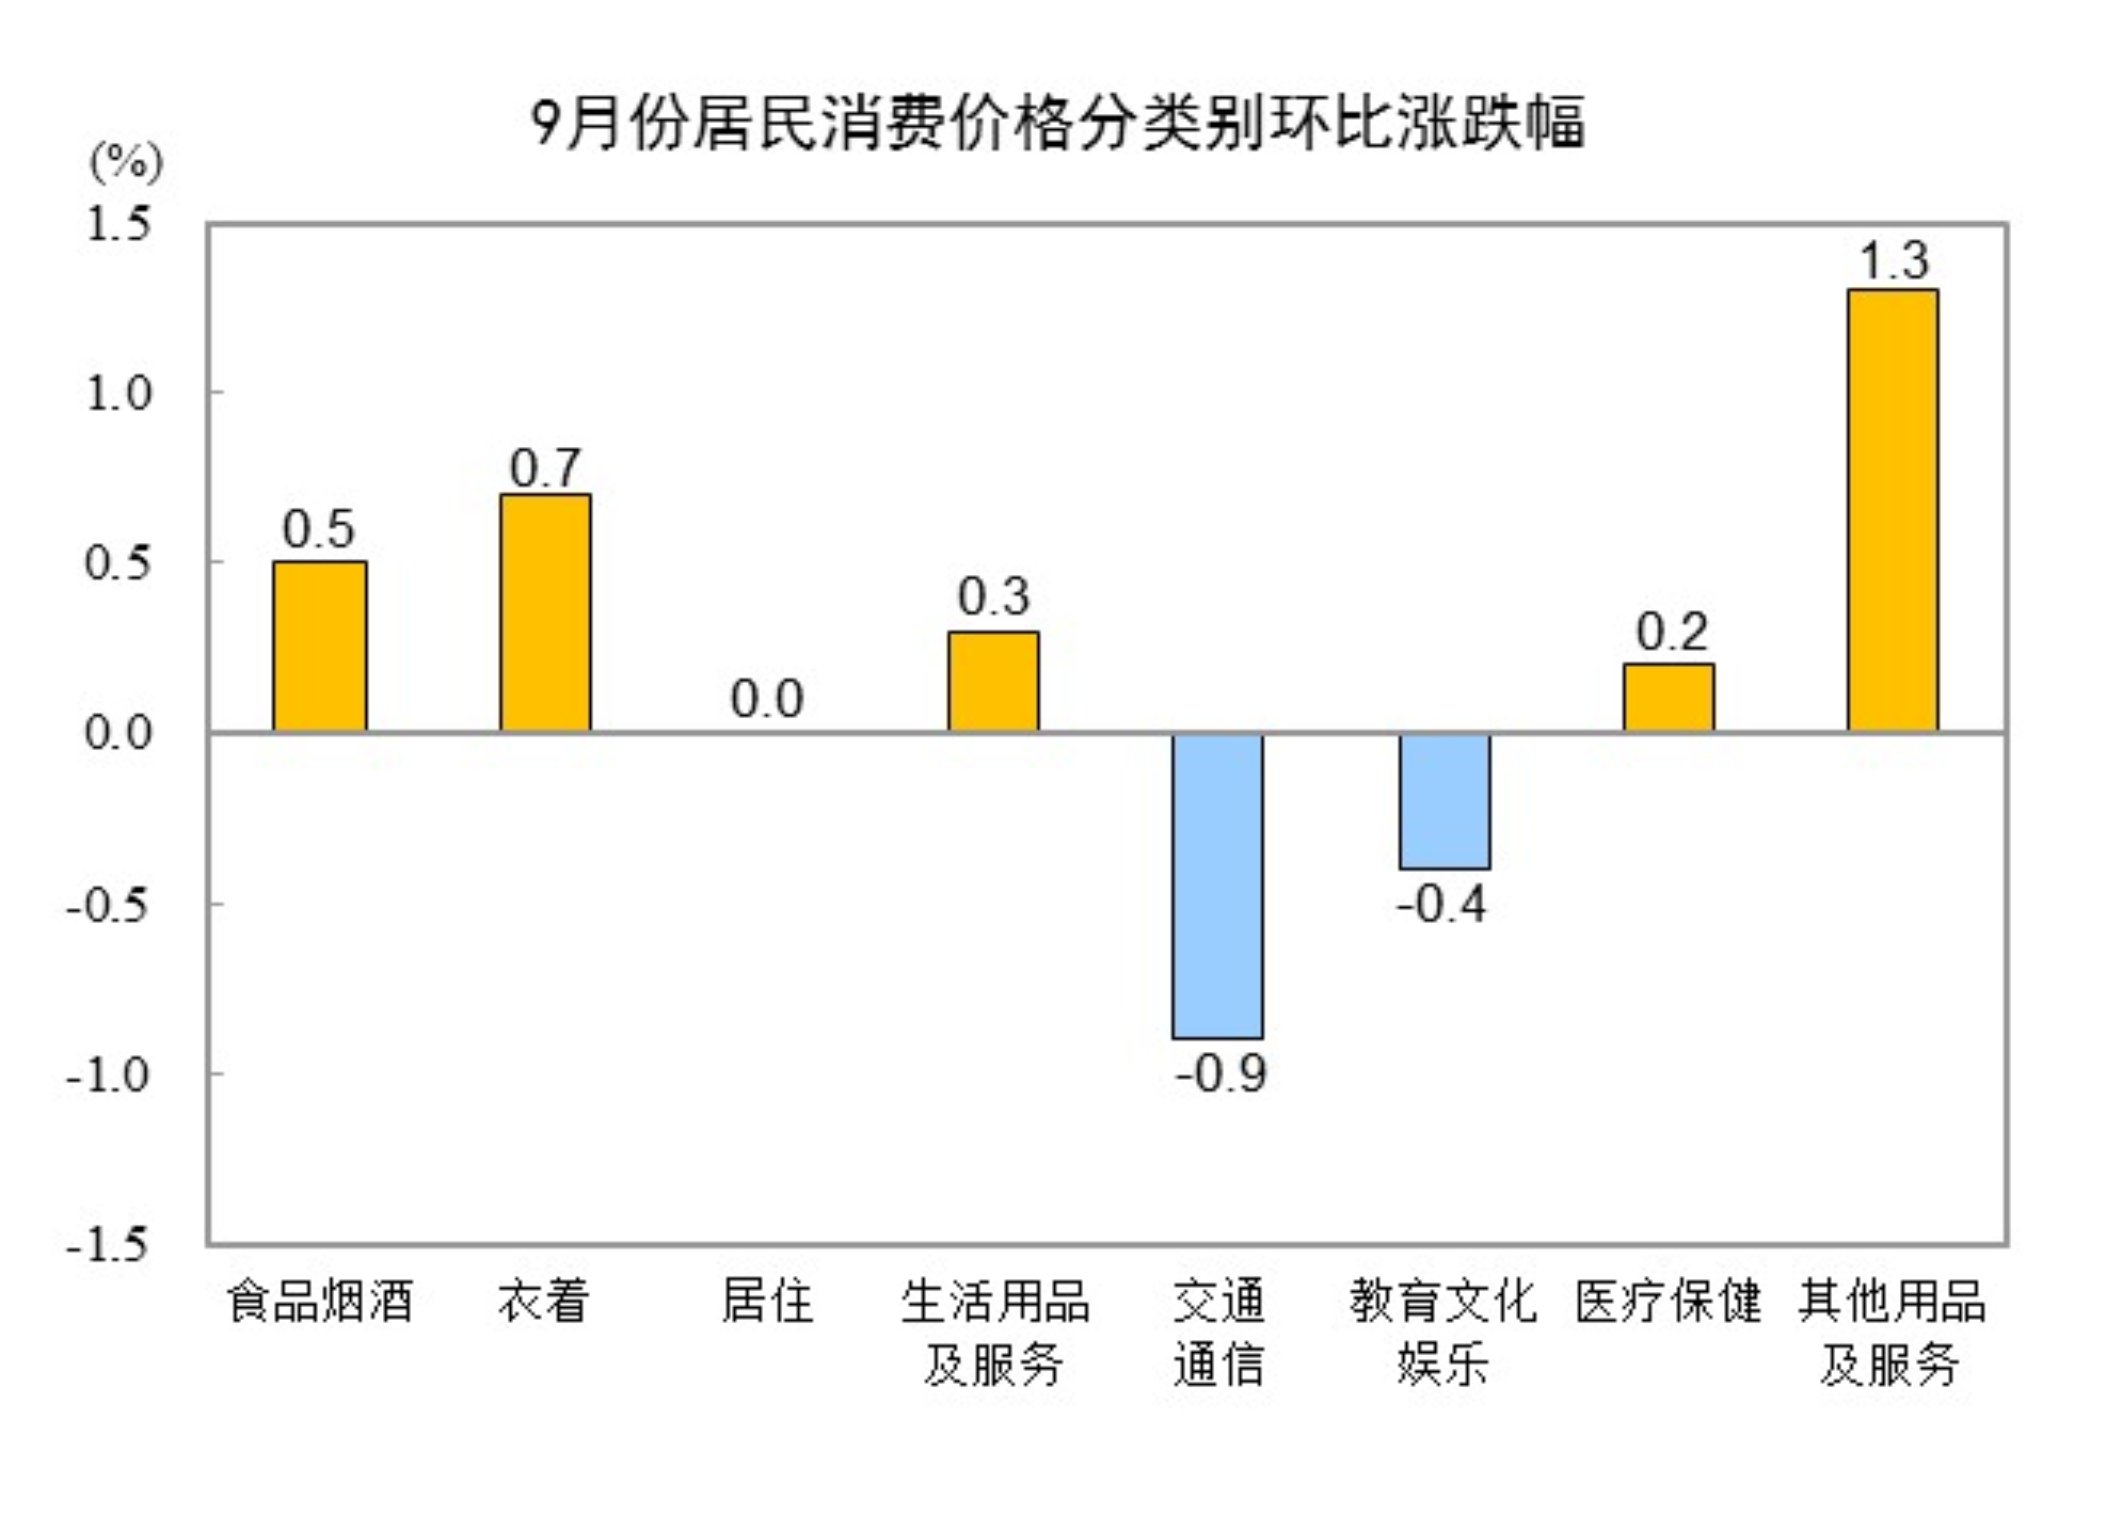
In September, prices for food, tobacco, and alcohol rose 0.5% MoM, contributing approximately 0.13 percentage points to the CPI increase. Within food, fresh vegetable prices increased 6.1%, contributing about 0.13 percentage points to the CPI rise; egg prices rose 2.7%, contributing about 0.02 percentage points; fresh fruit prices increased 1.7%, contributing about 0.03 percentage points; aquatic product prices fell 1.8%, dragging down the CPI by about 0.04 percentage points; and pork prices dropped 0.7%, dragging down the CPI by about 0.01 percentage points.
Among the other seven major categories, four experienced price increases, one remained flat, and two declined on a monthly basis. Specifically, prices for other goods and services and clothing rose 1.3% and 0.7%, respectively; prices for household goods and services and health care increased 0.3% and 0.2%, respectively; housing prices were flat; while prices for transportation and communication and education, culture, and recreation fell 0.9% and 0.4%, respectively.
Core CPI YoY Growth Continued to Expand in September 2025
PPI YoY Decline Narrowed Further
—Dong Lijuan, Chief Statistician of the Urban Department of the National Bureau of Statistics (NBS), Interprets CPI and PPI Data for September 2025
In September, the consumer market operated steadily overall. The Consumer Price Index (CPI) rose 0.1% MoM but fell 0.3% YoY. Core CPI, which excludes food and energy prices, increased 1.0% YoY, marking the fifth consecutive month of expanding growth. As the development of a unified national market advanced and market competition order continued to improve, the Industrial Producer Price Index (PPI) remained flat MoM; it declined 2.3% YoY, with the rate of decline narrowing by 0.6 percentage points compared to the previous month.
I. CPI Turned from Flat to an Increase MoM, Core CPI YoY Growth Rebounded to 1%
CPI showed a rebound MoM, shifting from being flat in the previous month to an increase of 0.1%. Food prices rose 0.7% MoM, with the growth rate widening by 0.2 percentage points from the previous month, contributing approximately 0.13 percentage points to the MoM CPI increase. Within food, prices for fresh vegetables, eggs, fresh fruit, mutton, and beef all showed seasonal increases, ranging between 0.9% and 6.1%; meanwhile, pork and aquatic products were in ample supply, with their prices falling 0.7% and 1.8%, respectively. Prices of industrial consumer goods excluding energy rose 0.5% MoM, contributing about 0.12 percentage points to the MoM CPI increase. Among these, domestic gold jewelry prices rose 6.5%, influenced by rising international gold prices; clothing prices increased 0.8% due to new autumn season stock; and prices for recreational durable goods, household appliances, and daily household articles rose 0.9%, 0.6%, and 0.6%, respectively. Affected by declines in service and energy prices, the CPI increase MoM was slightly lower than the seasonal level. Service prices fell 0.3%, contributing to a decrease of about 0.12 percentage points in the CPI MoM. Among them, due to the end of the summer travel season and the Mid-Autumn Festival falling in a different month compared to previous years, prices for air tickets, hotel accommodation, and tourism dropped 13.8%, 7.4%, and 6.1%, respectively, collectively contributing to a decrease of about 0.17 percentage points in the CPI MoM. Energy prices fell 0.8%, with domestic gasoline prices declining 1.7% due to changes in international oil prices.
The CPI fell 0.3% YoY, with the decline narrowing by 0.1 percentage points from the previous month. The YoY decline in CPI was mainly due to the carryover effect. Of the 0.3% YoY change in CPI this month, the carryover effect was approximately -0.8 percentage points, while the new impact from this year's price changes was about 0.5 percentage points. By category, food and energy prices declined. Food prices fell 4.4%, with the decline widening by 0.1 percentage points from the previous month, contributing to a decrease of about 0.83 percentage points in the CPI YoY, making it the main factor driving the YoY decline in CPI. Among food items, prices for pork, fresh vegetables, eggs, and fresh fruit dropped 17.0%, 13.7%, 13.5%, and 4.2%, respectively, collectively contributing to a decrease of about 0.78 percentage points in the CPI YoY; prices for beef and mutton rose 4.6% and 0.8%, respectively, with mutton prices increasing for the first time after 44 consecutive months of decline. Energy prices fell 2.7%, contributing to a decrease of about 0.2 percentage points in the CPI YoY. Core CPI, which excludes food and energy prices, rose 1.0% YoY, marking the fifth consecutive month of expansion in the growth rate and the first time in nearly 19 months that the growth rate returned to 1%. Among these, prices of industrial consumer goods excluding energy increased 1.8%, with the growth rate expanding for the fifth consecutive month. Among industrial consumer goods, prices of gold jewelry and platinum jewelry rose 42.1% and 33.6%, respectively, while prices of household appliances, daily household necessities, and communication tools increased 5.5%, 3.2%, and 1.5%, respectively, with all growth rates expanding. Service prices rose 0.6%, remaining relatively stable, with prices for medical services and household services increasing 1.9% and 1.6%, respectively, while prices for hotel accommodation and air tickets fell 1.5% and 1.7%, respectively.
II. PPI Was Flat MoM, YoY Decline Continued to Narrow
PPI was flat MoM for the second consecutive month. The main characteristics of PPI's MoM performance this month were: First, improvements in the supply-demand structure drove a noticeable stabilization of prices in some industries. Coal processing prices rose 3.8% MoM, coal mining and washing prices increased 2.5% MoM, and ferrous metals smelting and rolling processing prices rose 0.2% MoM, all rising for two consecutive months; prices for PV equipment and components manufacturing shifted from a 0.2% decline last month to a 0.8% increase MoM. Prices for non-metallic mineral products and lithium-ion battery manufacturing fell 0.4% and 0.2% MoM, respectively, with the declines narrowing by 0.6 and 0.3 percentage points from the previous month. Second, imported factors led to a MoM decline in domestic petroleum-related industry prices. Falling international oil prices drove down domestic petroleum-related industry prices MoM. Specifically, petroleum extraction prices fell 2.7%, refined petroleum product manufacturing prices dropped 1.5%, organic chemical raw material manufacturing prices decreased 0.6%, and chemical fiber manufacturing prices declined 0.2%.
The PPI fell 2.3% YoY, with the decline narrowing by 0.6 percentage points from the previous month. In addition to the lower comparison base from the same period last year, the effects of China's macro policies continued to manifest, with some industries showing positive price changes. First, the deepening advancement of the national unified market contributed to a narrowing of the YoY decline in prices for related industries. Capacity management in some sectors showed results, market competition order continued to improve, and YoY price declines narrowed. The price declines for coal processing, ferrous metals smelting and pressing, coal mining and washing, PV equipment and components manufacturing, battery manufacturing, and non-metallic mineral products narrowed by 8.3, 3.4, 3.0, 2.4, 0.5, and 0.4 percentage points, respectively, from the previous month. These six industries reduced the downward drag on the YoY PPI by approximately 0.34 percentage points compared to the previous month. Second, industrial structure upgrading and the release of consumption potential drove YoY price increases in related industries. The accelerated construction of a modern industrial system, positive trends in high-end, intelligent, and green development of manufacturing, and steady expansion of market demand led to a 1.4% YoY increase in aircraft manufacturing prices, a 1.2% rise in electronic specialty material manufacturing prices, a 0.9% increase in waste resource comprehensive utilization industry prices, and a 0.1% gain in wearable smart device manufacturing prices. The effects of policies to boost consumption continued to appear, with quality and upgrading consumption demand being released, leading to a 14.7% YoY increase in arts, crafts, and ceremonial product manufacturing prices, a 4.0% rise in sports ball manufacturing prices, and a 1.8% increase in nutritional food manufacturing prices.