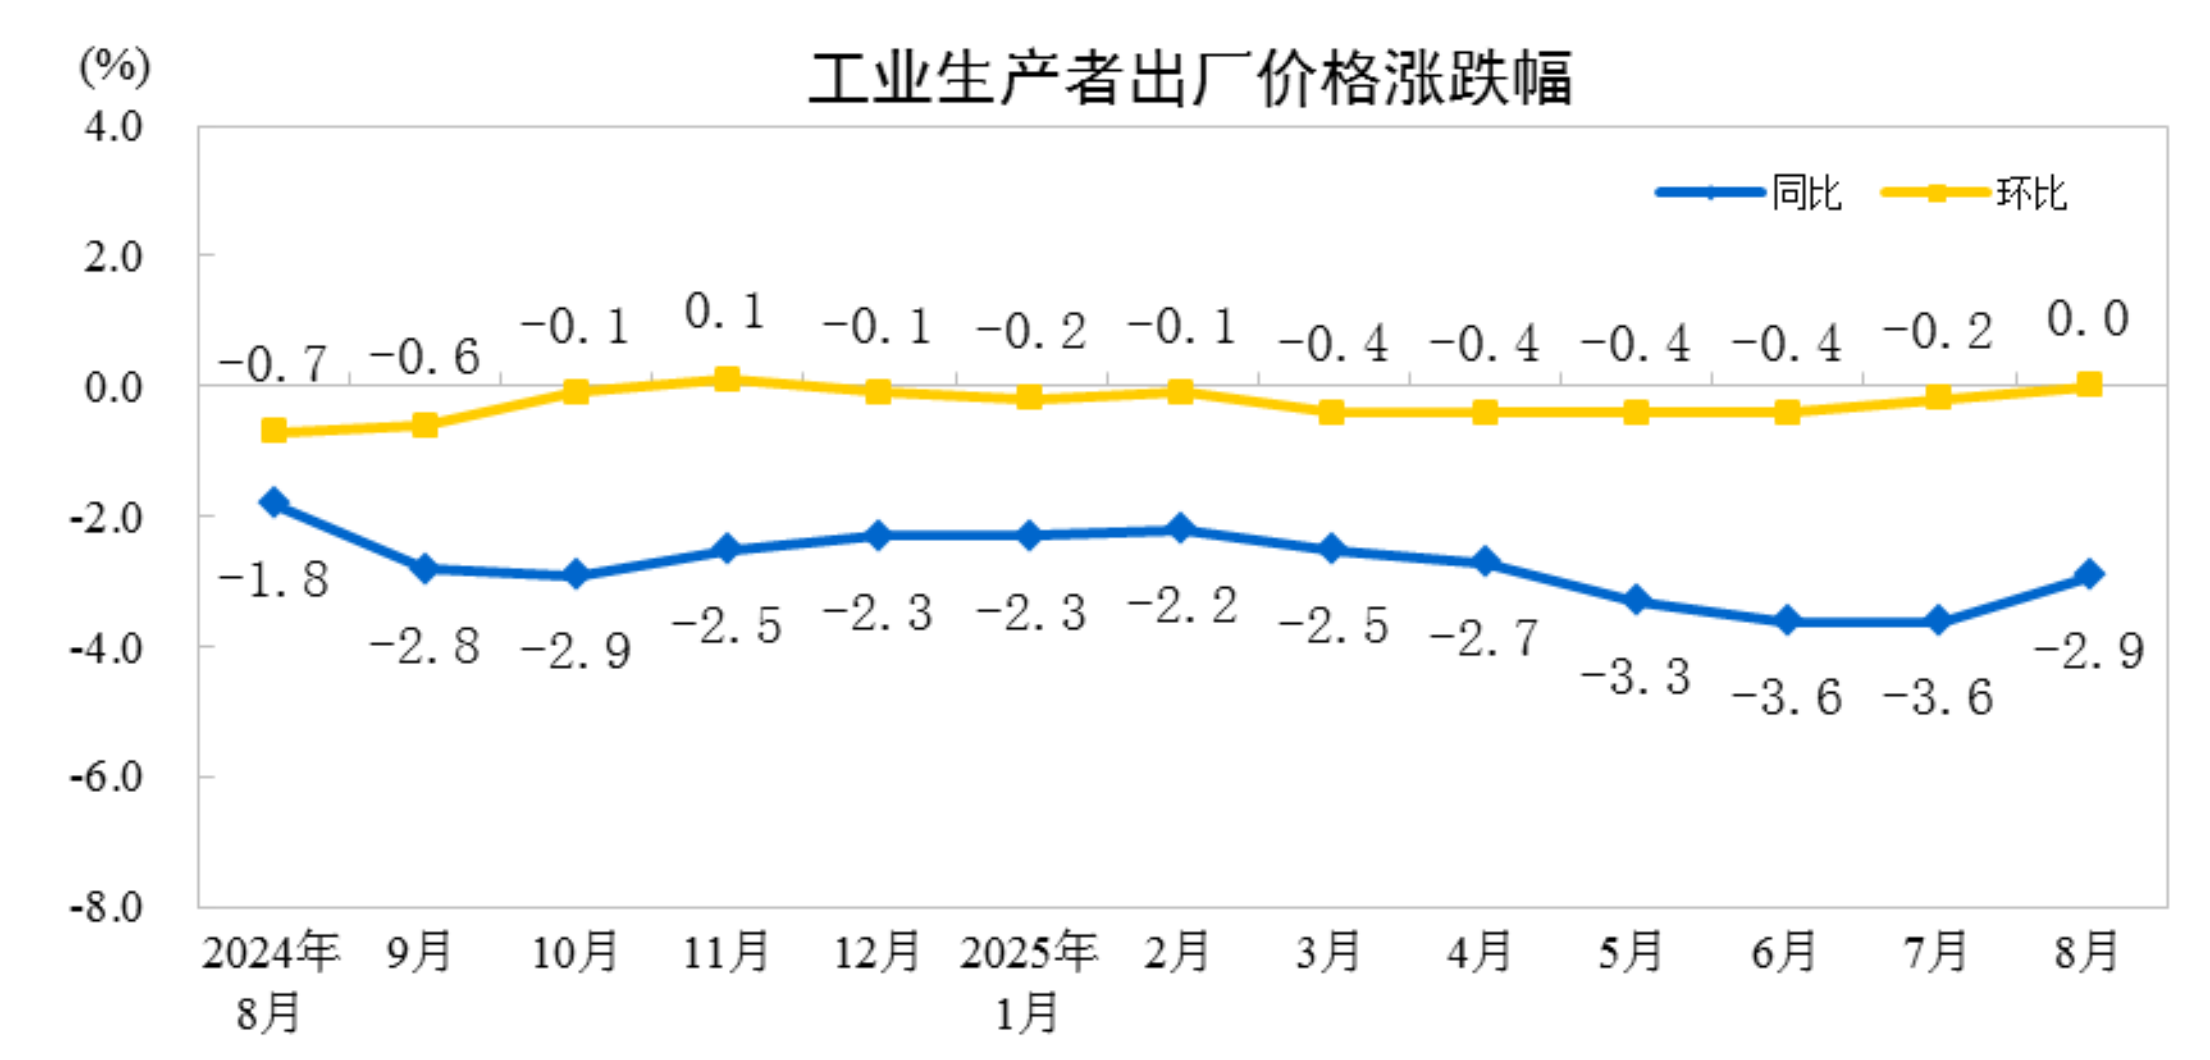
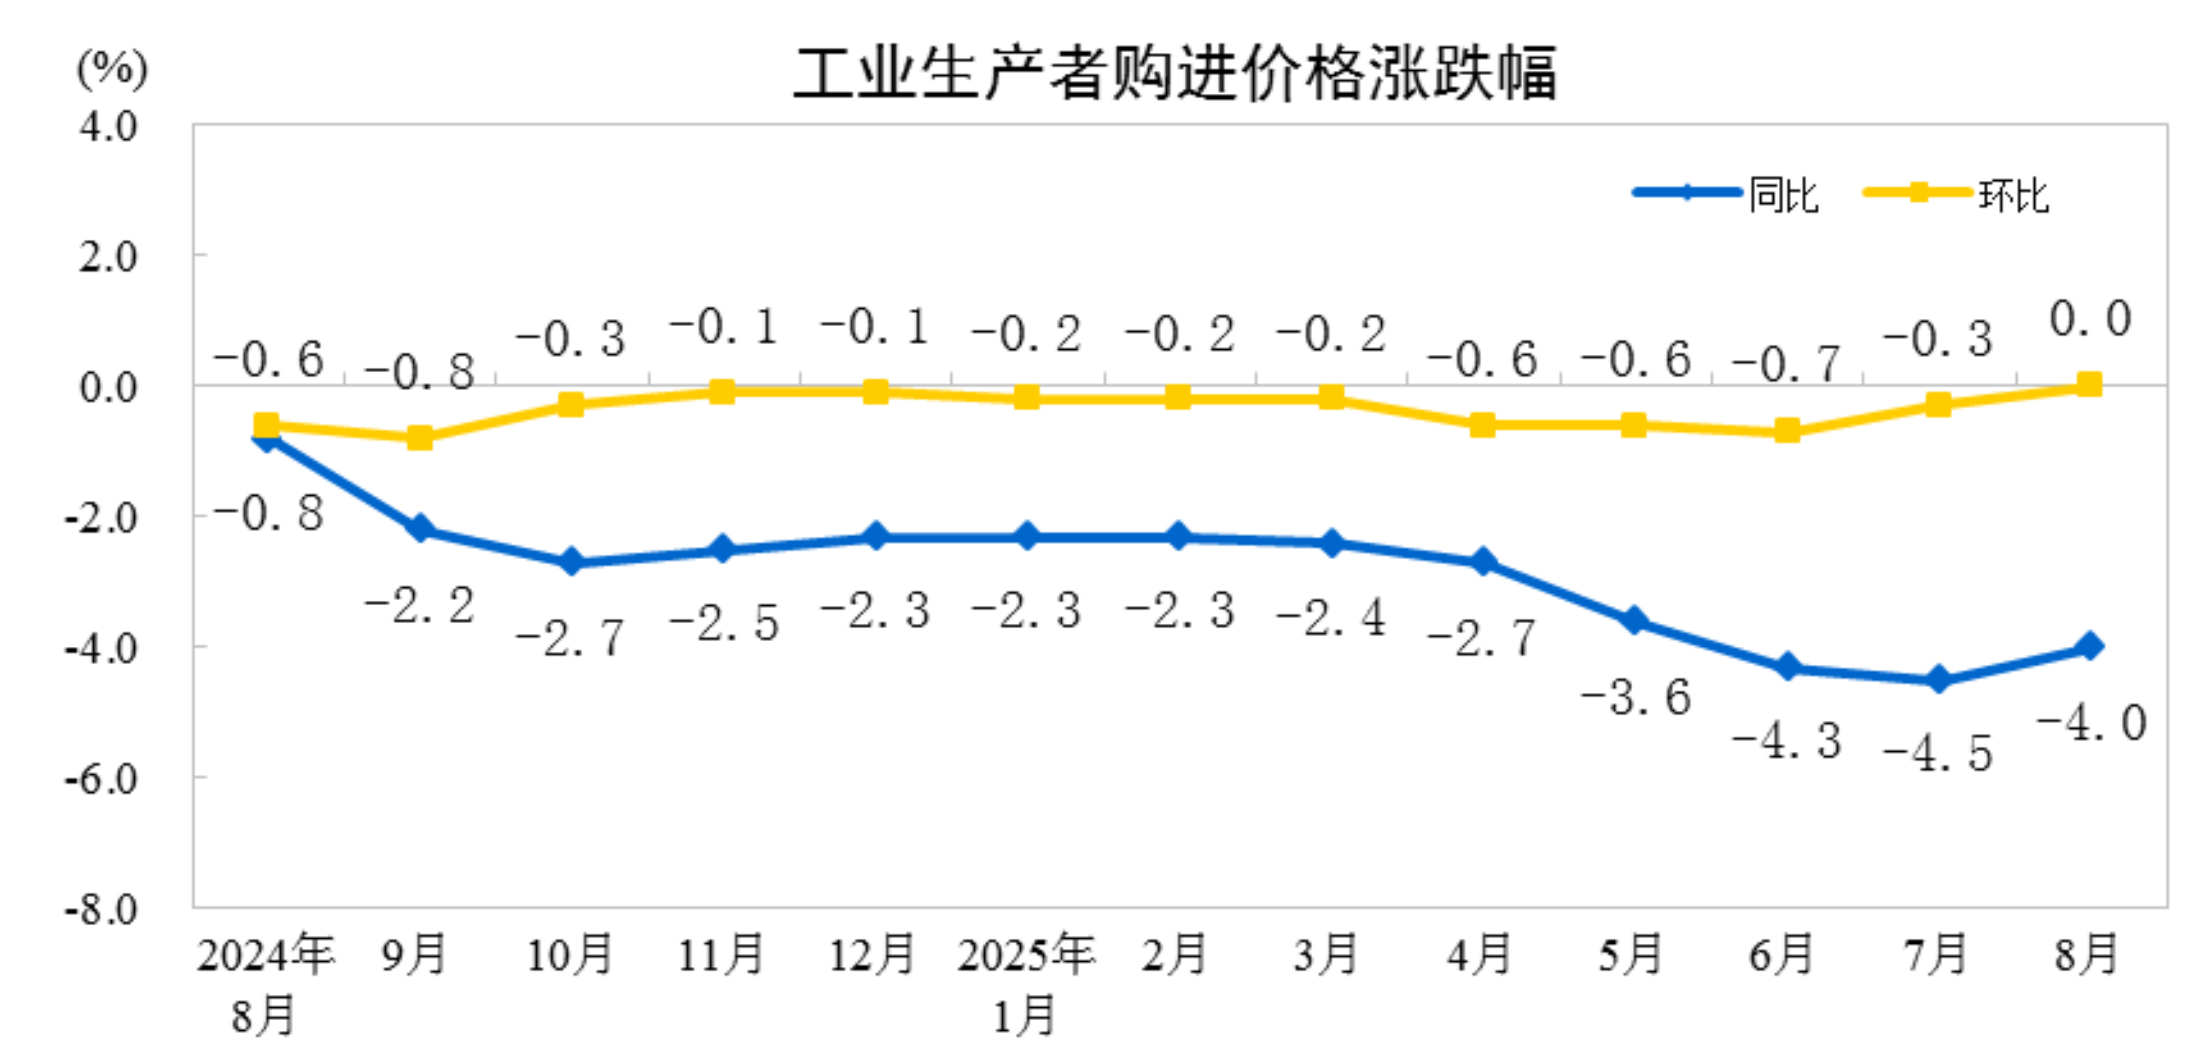
According to data from the National Bureau of Statistics (NBS), in August 2025, the ex-factory prices of industrial producers nationwide fell 2.9% YoY, with the decline narrowing by 0.7 percentage points from the previous month, while turning from a 0.2% MoM drop to flat. The purchasing prices of industrial producers dropped 4.0% YoY and remained flat MoM. From January to August, the average ex-factory prices of industrial producers fell 2.9% compared with the same period last year, while the purchasing prices declined 3.3%.
YoY Decline in Ex-Factory Prices of Industrial Producers Narrowed in August 2025, Turning From Drop to Flat MoM
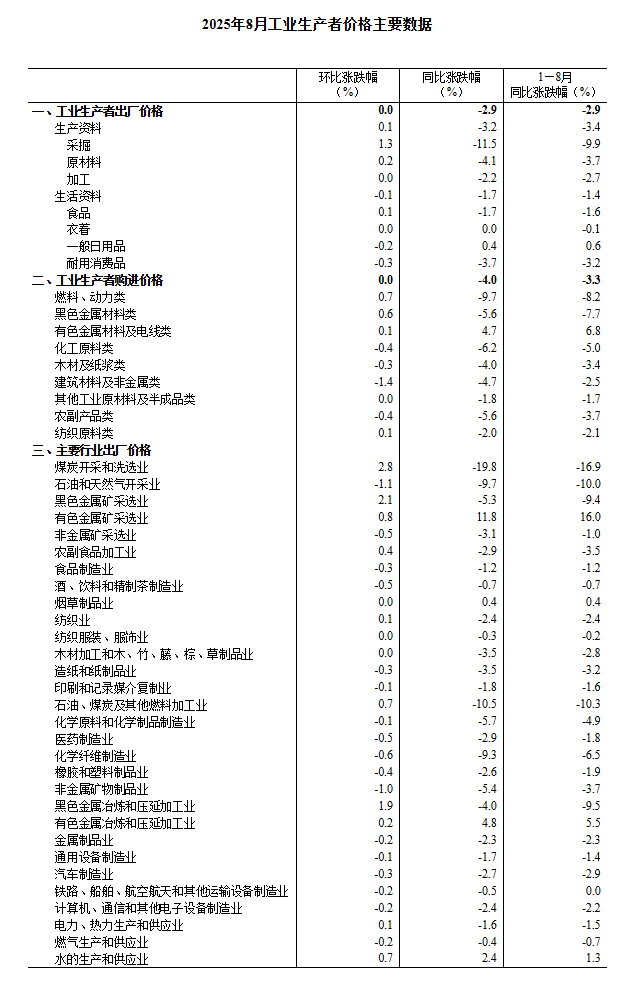
In August 2025, the ex-factory prices of industrial producers nationwide fell 2.9% YoY, with the decline narrowing by 0.7 percentage points from the previous month, while turning from a 0.2% MoM drop to flat. The purchasing prices of industrial producers dropped 4.0% YoY and remained flat MoM. From January to August, the average ex-factory prices of industrial producers fell 2.9% compared with the same period last year, while the purchasing prices declined 3.3%.
I. YoY Changes in Industrial Producer Prices
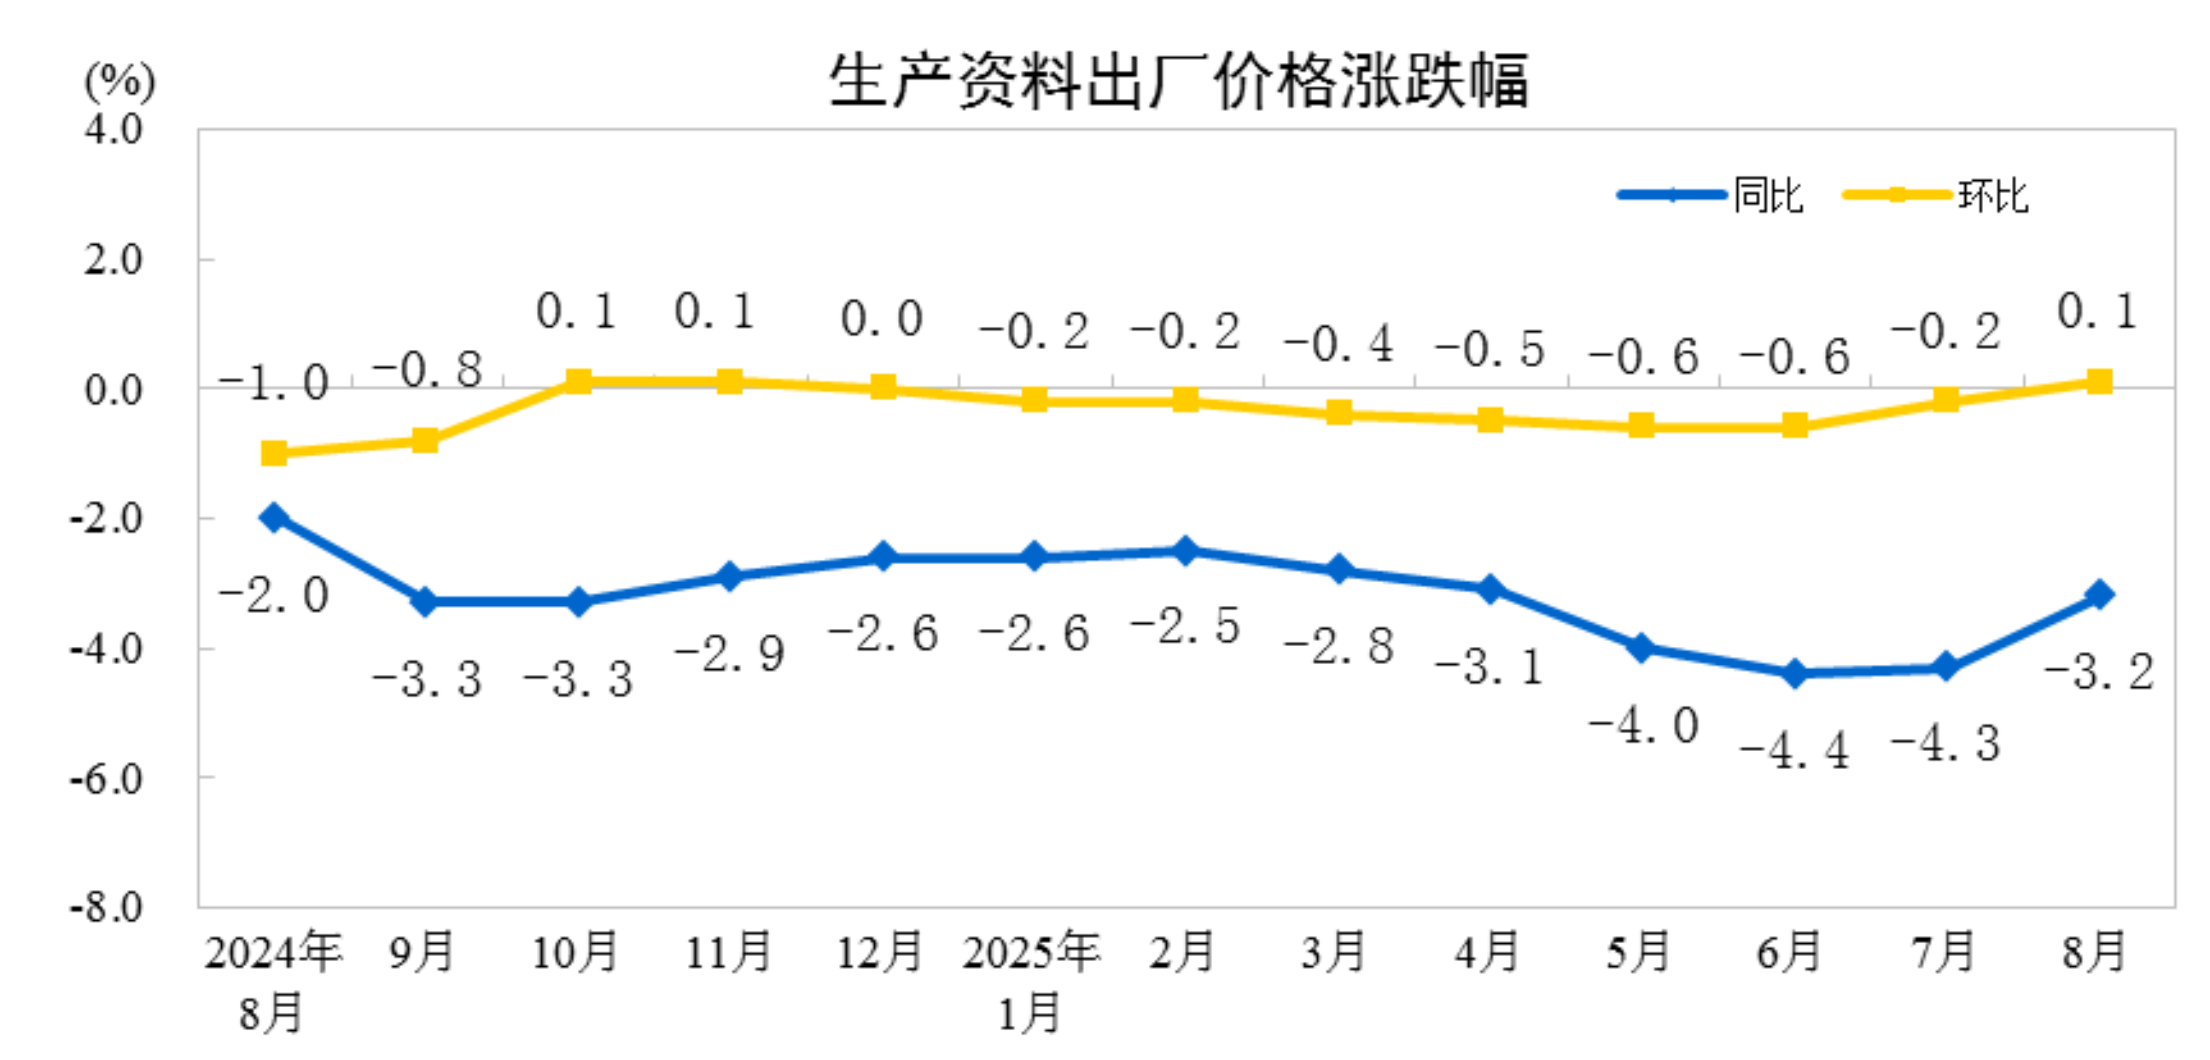
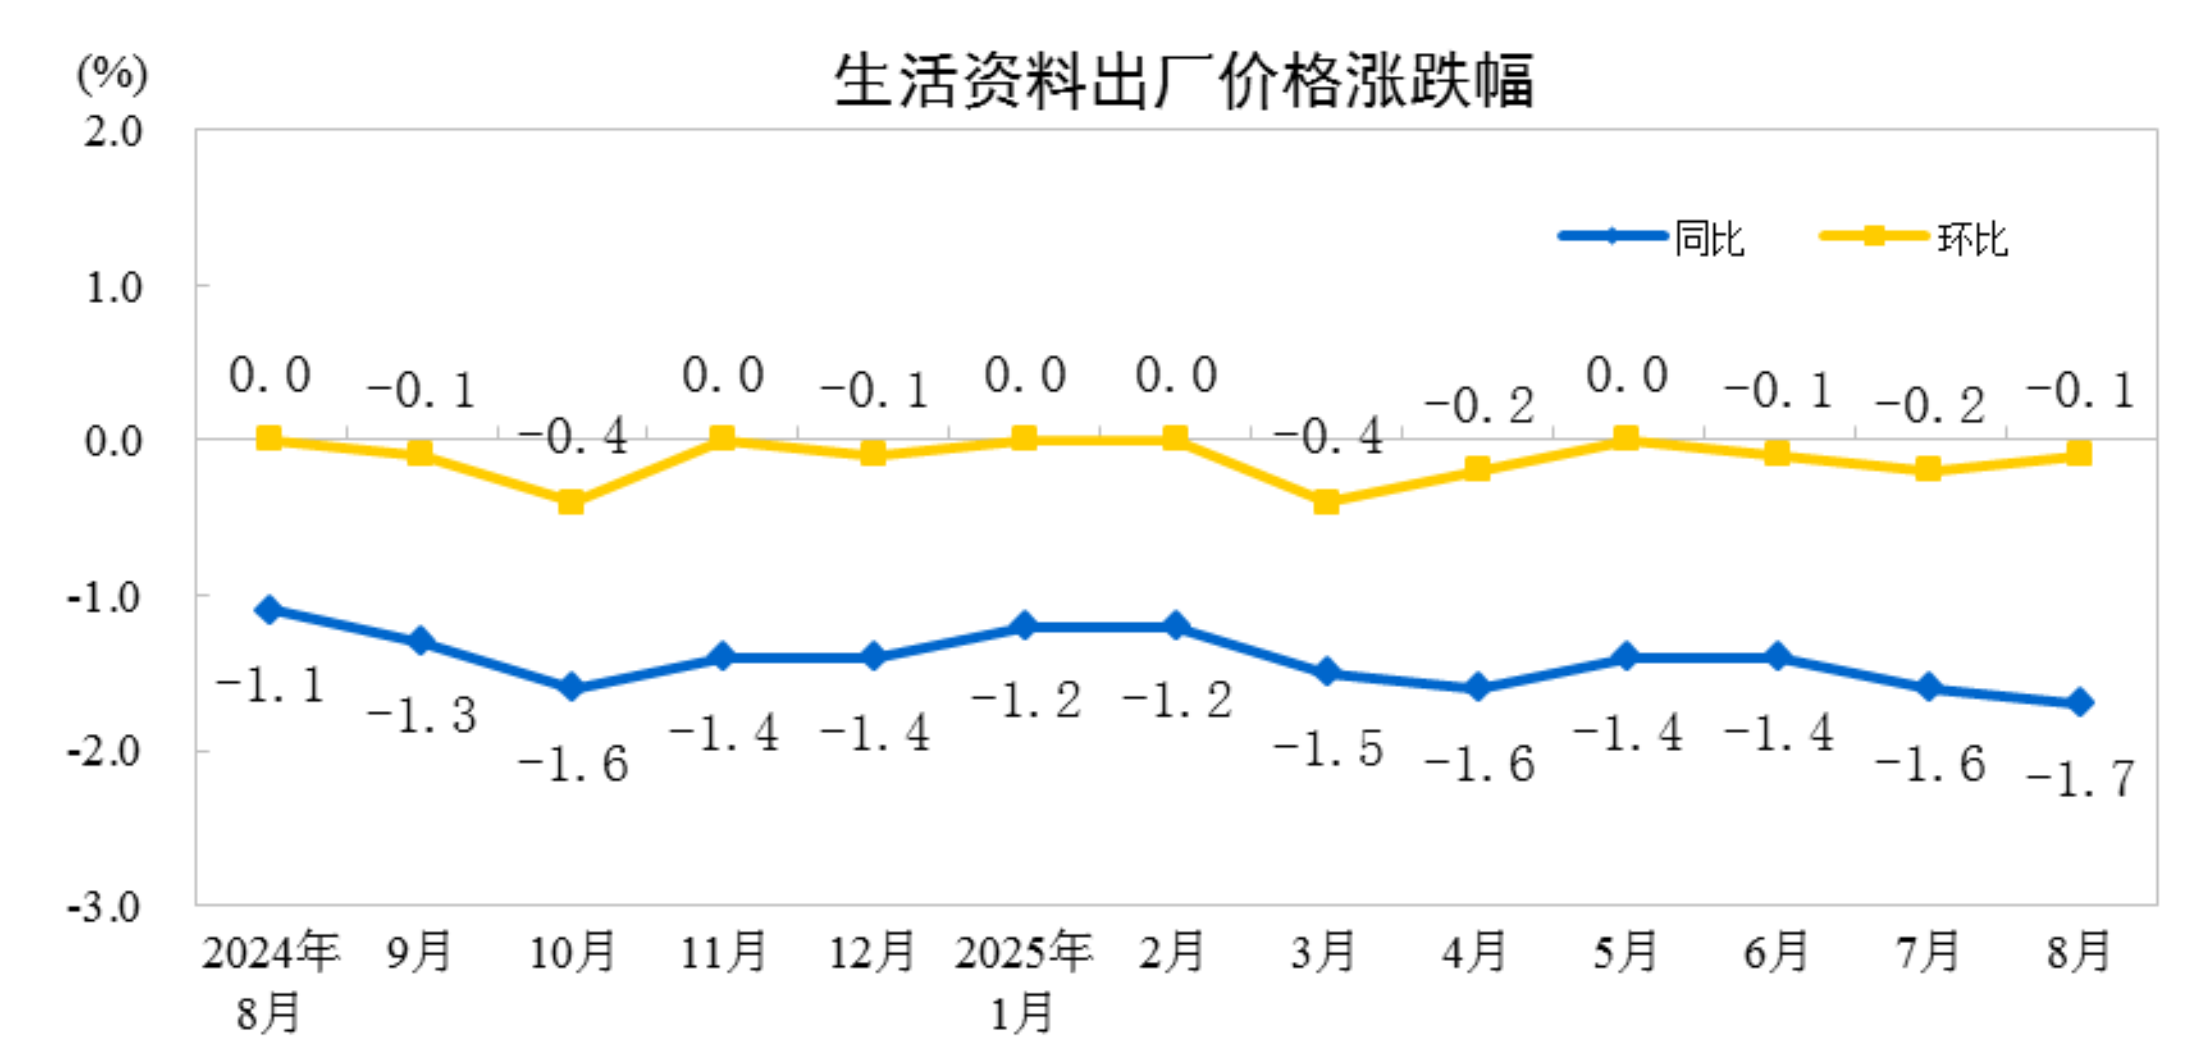
In August, among ex-factory prices of industrial producers, the prices of production materials fell 3.2%, dragging down the overall ex-factory price level by about 2.4 percentage points. Specifically, prices of mining and quarrying dropped 11.5%, raw material prices declined 4.1%, and processing industry prices fell 2.2%. Prices of consumer goods decreased 1.7%, pulling down the overall ex-factory price level by about 0.45 percentage points. Among them, food prices dropped 1.7%, clothing prices remained flat, general daily necessities rose 0.4%, and durable consumer goods fell 3.7%.
Among purchasing prices of industrial producers, fuel and power prices fell 9.7%, chemical raw material prices dropped 6.2%, ferrous metals and agricultural by-product prices both declined 5.6%, building materials and non-metallic prices decreased 4.7%, and textile raw material prices fell 2.0%, while non-ferrous metals and wire prices rose 4.7%.
II. MoM Changes in Industrial Producer Prices
In August, among ex-factory prices of industrial producers, production material prices rose 0.1%, pushing up the overall ex-factory price level by about 0.08 percentage points. Specifically, mining and quarrying prices increased 1.3%, raw material prices rose 0.2%, and processing industry prices remained flat. Consumer goods prices fell 0.1%, dragging down the overall ex-factory price level by about 0.03 percentage points. Among them, food prices rose 0.1%, clothing prices were flat, general daily necessities dropped 0.2%, and durable consumer goods declined 0.3%.
In the purchasing prices of industrial producers, the prices of building materials and non-metallic products fell 1.4%, while those of chemical raw materials and agricultural by-products both dropped 0.4%. Prices of fuel and power rose 0.7%, ferrous metals increased 0.6%, and non-ferrous metals & wires as well as textile raw materials both edged up 0.1%.
Core CPI Continued to Rebound in August 2025 with Narrower YoY Decline in PPI
—Dong Lijuan, Chief Statistician of the Urban Department at the National Bureau of Statistics (NBS), Interprets CPI and PPI Data for August 2025
In August, the consumer market operated steadily overall. The consumer price index (CPI) remained flat MoM but dropped 0.4% YoY. Core CPI, which excludes food and energy prices, rose 0.9% YoY, marking the fourth consecutive month of expanding growth. With continuous optimization in domestic market competition and improved supply-demand relationships in some industries, the producer price index (PPI) shifted from a 0.2% MoM decline in the previous month to flat MoM. It fell 2.9% YoY, with the YoY decline narrowing by 0.7 percentage points from July.
I. Core CPI Continued to Rebound
The YoY decline in CPI was primarily driven by a higher comparison base from the same period last year, coupled with food price increases this month falling below seasonal levels. In terms of carryover effects, price changes from the previous year contributed approximately -0.9 percentage points to the YoY CPI, exerting a 0.4-percentage-point larger downward pull than last month. For new price increases, the CPI remained flat MoM, underperforming seasonal levels by about 0.3 percentage points. These factors jointly led to the YoY decline in CPI. By category, food prices were notably lower. Food prices rose 0.5% MoM, underperforming seasonal levels by 1.1 percentage points, with pork, eggs, and fresh fruit prices all weaker than seasonal trends. Food prices dropped 4.3% YoY, widening the decline by 2.7 percentage points from July, dragging down the YoY CPI by approximately 0.51 percentage points more than last month—exceeding the overall YoY CPI decline. Specifically, pork, fresh vegetables, and egg prices fell 16.1%, 15.2%, and 14.2% YoY, respectively, with declines widening by 6.6, 7.6, and 1.3 percentage points from July. Fresh fruit prices shifted from a 2.8% YoY increase in July to a 3.7% YoY drop. These four items collectively contributed to a 0.47-percentage-point larger downward pull on the YoY CPI compared to July. Non-food prices rose 0.5% YoY, marking the third consecutive month of expanding growth and pushing up the YoY CPI by about 0.43 percentage points.
As policies to expand domestic demand and boost consumption continued to take effect, core CPI posted its fourth straight month of YoY growth expansion. In August, core CPI (excluding food and energy prices) rose 0.9% YoY, with the growth rate widening by 0.1 percentage points from July. Excluding energy, prices of industrial consumer goods rose 1.5% YoY, with the growth rate expanding by 0.3 percentage points from the previous month. Among industrial consumer goods, prices of gold and platinum jewelry surged 36.7% and 29.8% YoY respectively, collectively contributing approximately 0.22 percentage points to the YoY CPI increase. Prices of household appliances and recreational durable goods saw their YoY growth rates widen to 4.6% and 2.4% respectively, jointly adding about 0.09 percentage points to the YoY CPI rise. The YoY decline in prices of fuel-powered passenger vehicles narrowed further to 2.3%. Service prices, which have been gradually expanding since March, rose 0.6% YoY this month, up 0.1 percentage points from the previous month, contributing roughly 0.23 percentage points to the YoY CPI growth. Specifically, prices of domestic services and hairdressing increased 2.3% and 1.0% YoY respectively, maintaining relatively stable growth. Prices of medical and education services rose 1.6% and 1.2% YoY respectively, while vehicle rental fees and tourism prices climbed 0.8% and 0.7% YoY, all showing expanded growth rates.
II. Narrower YoY Decline in PPI
The PPI MoM change ended an eight-month consecutive downward trend, shifting from a 0.2% drop last month to flat this month. Key features of this month's PPI MoM movement: First, improved supply-demand relationships drove price rebounds in some energy and raw material industries. Coal processing prices turned from a 4.7% MoM decline to a 9.7% increase, coal mining and washing prices reversed from a 1.5% drop to a 2.8% rise, ferrous metals smelting and rolling prices switched from a 0.3% decrease to a 1.9% gain, glass manufacturing prices shifted from a 1.5% fall to a 0.1% uptick, and power and heat production and supply prices changed from a 0.9% decline to a 0.1% increase. Second, imported factors led to MoM pullbacks in domestic petroleum and certain nonferrous metal industries. Amid high fluctuations in international nonferrous metal prices, domestic nonferrous metals smelting and rolling prices rose 0.2% MoM, though the growth rate slowed by 0.6 percentage points from the previous month. Specifically, gold and aluminum smelting prices both increased 0.2% MoM, while copper smelting prices dropped 1.1%. Falling international oil prices drove domestic petroleum extraction and refined petroleum product manufacturing prices down 1.4% and 0.6% MoM respectively.
The PPI fell 2.9% YoY, with the decline narrowing by 0.7 percentage points from the previous month—marking the first contraction since March this year. Beyond the base effect from lower year-ago comparisons, China's accelerated implementation of more proactive macro policies has spurred positive price changes in some sectors. First, ongoing optimization of domestic market competition has contributed to narrower YoY price declines in related industries. The construction of a unified national market advanced further, with the disorderly competition among enterprises being addressed and capacity governance in key industries carried out in an orderly manner. The YoY decline in prices of related industries narrowed. The YoY price declines in coal processing, ferrous metals smelting and rolling, coal mining and washing, PV equipment and components manufacturing, and new energy vehicle manufacturing narrowed by 10.3, 6.0, 3.2, 2.8, and 0.6 percentage points MoM, respectively, reducing the downward drag on the YoY PPI by approximately 0.5 percentage points MoM, which was the main reason for the narrowing of the YoY PPI decline. Second, the steady growth of new development momentum boosted the YoY rebound in prices of related industries. The robust growth of emerging industries, the deep integration of technological and industrial innovation, and the improved quality and efficiency of green development contributed to the YoY price rebound in related sectors. Prices of integrated circuit packaging and testing series rose by 1.1%, ship and related equipment manufacturing by 0.9%, communication system equipment manufacturing by 0.3%, and solid waste treatment equipment by 0.3%. Prices of electronic specialty materials manufacturing and smart unmanned aerial vehicle manufacturing shifted from declines of 1.6% and 0.5% MoM to flat YoY. The price decline in the comprehensive utilization of waste resources narrowed by 5.4 percentage points. Third, the increase in demand for upgraded consumption boosted YoY price increases in some industries. Prices of arts and crafts and ceremonial goods manufacturing rose by 13.0%, sports ball manufacturing by 4.7%, traditional Chinese musical instruments by 1.6%, nutritional food manufacturing by 0.9%, special sports equipment and accessories by 0.4%, and health food manufacturing by 0.3%.
Recommended reading: