》Check SMM copper quotes, data, and market analysis
》Subscribe to view historical spot prices of SMM metals
》Click to view the SMM copper industry chain database
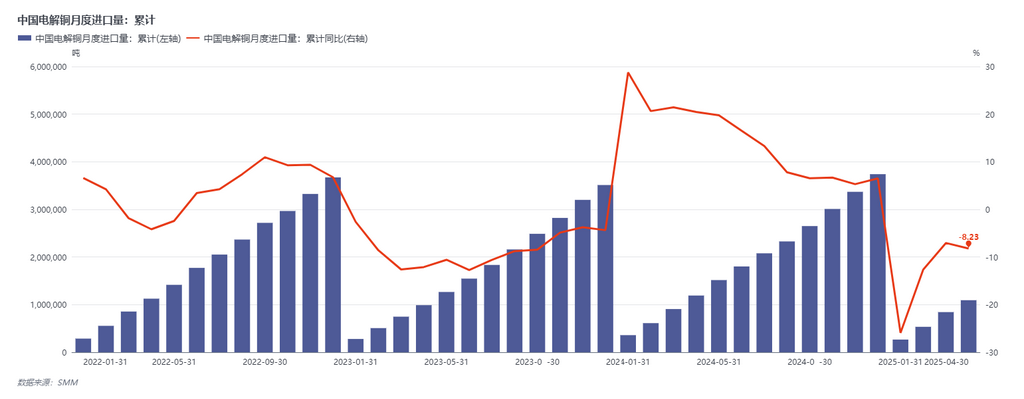
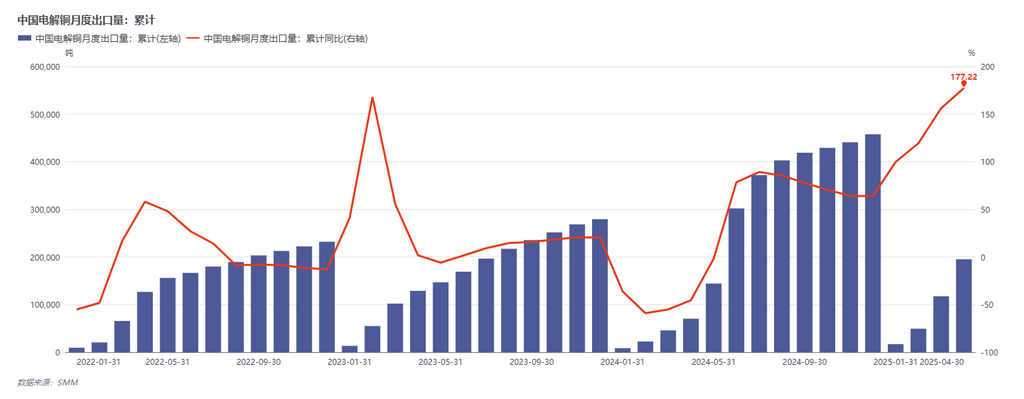
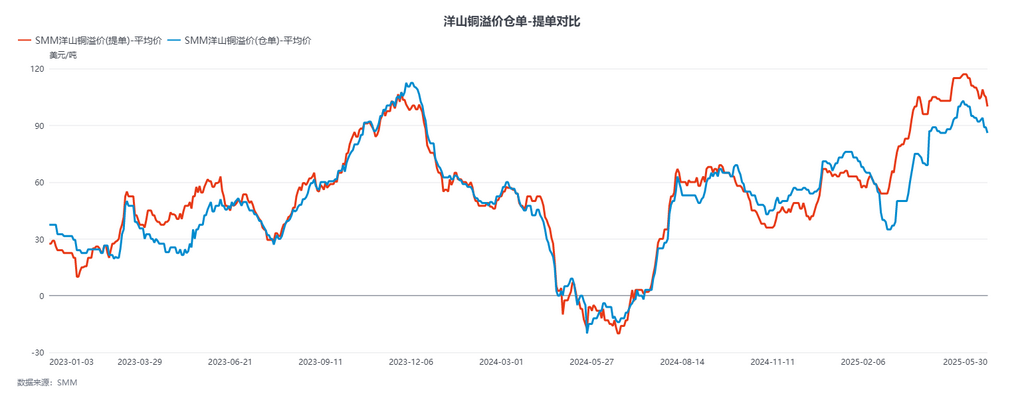
In May, the average premium/discount of SMM #1 copper cathode was 182.89 yuan/mt, and the average price of standard-quality copper was 162.63 yuan/mt. The average B/L price of SMM Yangshan copper (CIF China) was $110.84/mt, the average warrant price was $95.79/mt, and the average EQ price was $75.26/mt. The average premium/discount of SMM #1 copper cathode was 182.89. From January to April, the apparent consumption, after accounting for inventory changes, increased by 12.93%. In terms of overall imports, the cumulative imports from January to April decreased by 8.23%, while exports increased by 177.22% MoM. This was partly influenced by the siphon effect caused by the LME-COMEX price spread, the impact of which on international trade flows will not be elaborated on here. It cannot be overlooked that the shortage of copper concentrates has gradually been transmitted to copper cathode. In the first half of 2024, there were continuous reports of production cuts and even shutdowns at overseas smelters. This suggests that even with new roughing and refining projects coming online in H2, the global supply of copper cathode will not ease. Capacities with higher costs or aging equipment are gradually ceding market share due to tight raw material supply.
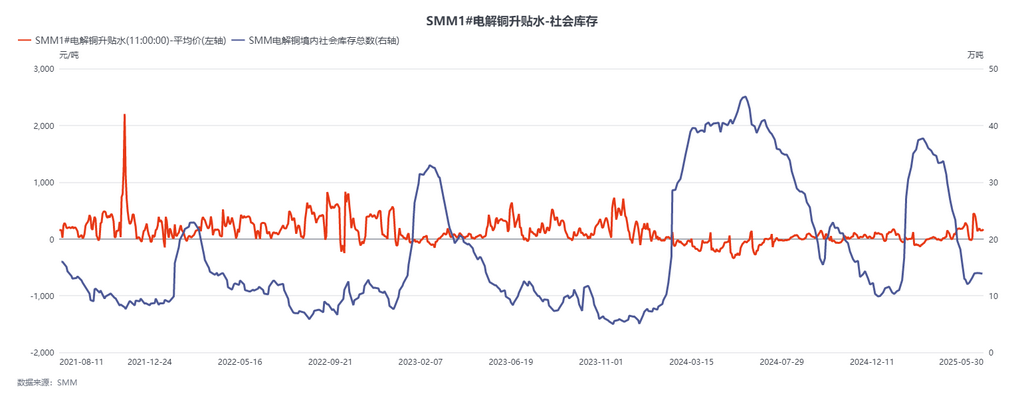
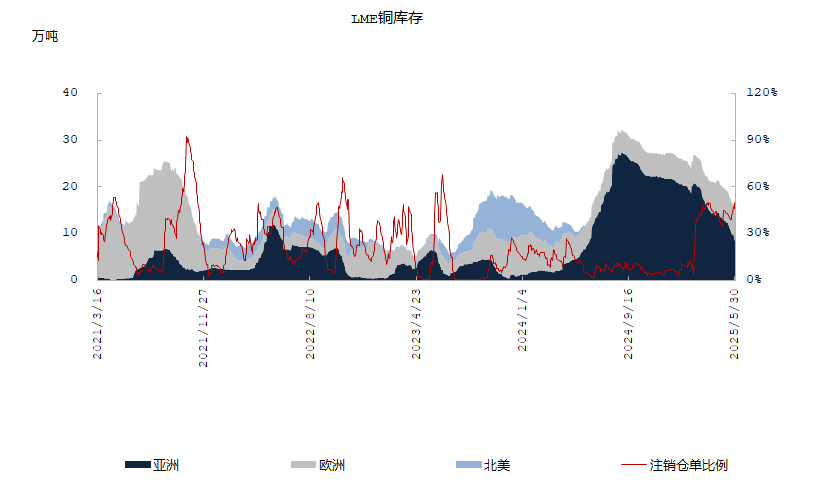
In terms of inventory, the continuous drawdown of LME inventory is driven by large miners and traders' bets on a tight structure in H2. The market gradually observed the strategic position of Africa and Indonesia in the copper cathode supply side and the consumption growth in Southeast Asia and Asia in H1. As a result, LME inventory is expected to gradually draw down in May-June (in fact, it has already started in February). According to market news, the queue for outflows from LME Asia warehouses has already extended to late June. What would happen to the market if LME inventory falls below 50,000 mt in early July? Would the large inventories currently stockpiled in the US flow out to alleviate the tight balance in Asia? Most likely not. Due to cost and time efficiency constraints, the support capacity of Europe and the US (including Russian copper) for Asia is minimal. Therefore, as LME inventory continues to decline, and even the previously stable Russian copper inventory starts to loosen, the most direct impact is that the LME backwardation structure will be pushed higher. The large number of borrow positions established by the market in April will mature in June-July, and the low inventory and high backwardation structure both domestically and overseas will continue to push up spot premiums in China and abroad.
Two questions arise here:
1. What are the conditions for the above assumptions to hold? The first is consumption. From January to April, China's apparent consumption increased by more than 10%, while the expected growth in end-use consumption at the beginning of the year was only 2.3%-3%. The substitution effect caused by tight copper scrap supply alone cannot explain this gap, indicating that consumption in H1 was indeed driven by a significant increase due to rush exports, installation rushes, and short-term low copper prices. However, can the growth in orders be sustained in June-July, or even in the second half of the year? This is a key focus for the market. Currently, copper prices have encountered significant upward resistance near 78,000 yuan/mt, indicating that end-use consumption has limited acceptance of higher prices. In the short term, it is unlikely that consumption support will surge as it did in April. On the other hand, if copper prices pull back from their highs, there could be better-than-expected demand in the off-season in June-July, turning market expectations of tightness into reality.
2. Will the "new capacity" expected in the market in the second half of the year enable inventory levels to return to a safe range? The answer may be no. In the second half of 2025, global copper cathode capacity additions will be concentrated in three large-scale copper cathode projects in Indonesia, India, and China, with a total annual capacity of approximately 1.5 million mt. While this figure seems substantial, a breakdown reveals that the combined actual production in India and Indonesia this year is expected to be only around 200,000 mt in metal content. Domestically, the industry faces challenges such as shrinking smelting profits and a continuous decline in long-term contract BM. With the renewed impact on raw material supply from the Kamoa-Kakula project, it will be difficult for the release of new capacity to offset the shortfall in raw materials.
We make the following assumptions: domestic copper cathode production in June-July is approximately 1.1 million mt, imports from Africa are 110,000-120,000 mt, imports from South America, considering only long-term contracts, are 35,000-40,000 mt, LME monthly destocking is 45,000-50,000 mt, regular imports from Asia (Japan, South Korea, Russia, Kazakhstan) total approximately 55,000-60,000 mt, and imports from other regions are approximately 15,000-20,000 mt. This brings the total supply to 1.1 million mt domestically plus 250,000-290,000 mt in imports. From the perspective of the monthly balance in the early period, a 10% MoM decline in processed material consumption in June-July compared to May would be necessary to keep inventory levels stable and prevent further destocking. A more significant decline would be required to rebuild inventory. From this perspective, the tight balance of copper cathode in China in the second half of the year will gradually become a reality, and the balance in non-US regions will also gradually tighten due to the siphoning effect of domestic shortages.