Data from the National Bureau of Statistics (NBS) showed that in March, the national consumer price index (CPI) fell 0.1% YoY. Among them, urban areas fell 0.1%, while rural areas fell 0.3%; food prices fell 1.4%, while non-food prices rose 0.2%; consumer goods prices fell 0.4%, while service prices rose 0.3%. On average from January to March, the national CPI fell 0.1% compared to the same period last year.
In March, the national producer price index (PPI) fell 2.5% YoY and 0.4% MoM; the purchasing price index for industrial producers fell 2.4% YoY and 0.2% MoM. In Q1, both the PPI and the purchasing price index for industrial producers fell 2.3% compared to the same period last year.
Dong Lijuan, Chief Statistician of the Urban Department of the NBS, interpreted the CPI and PPI data for March 2025.
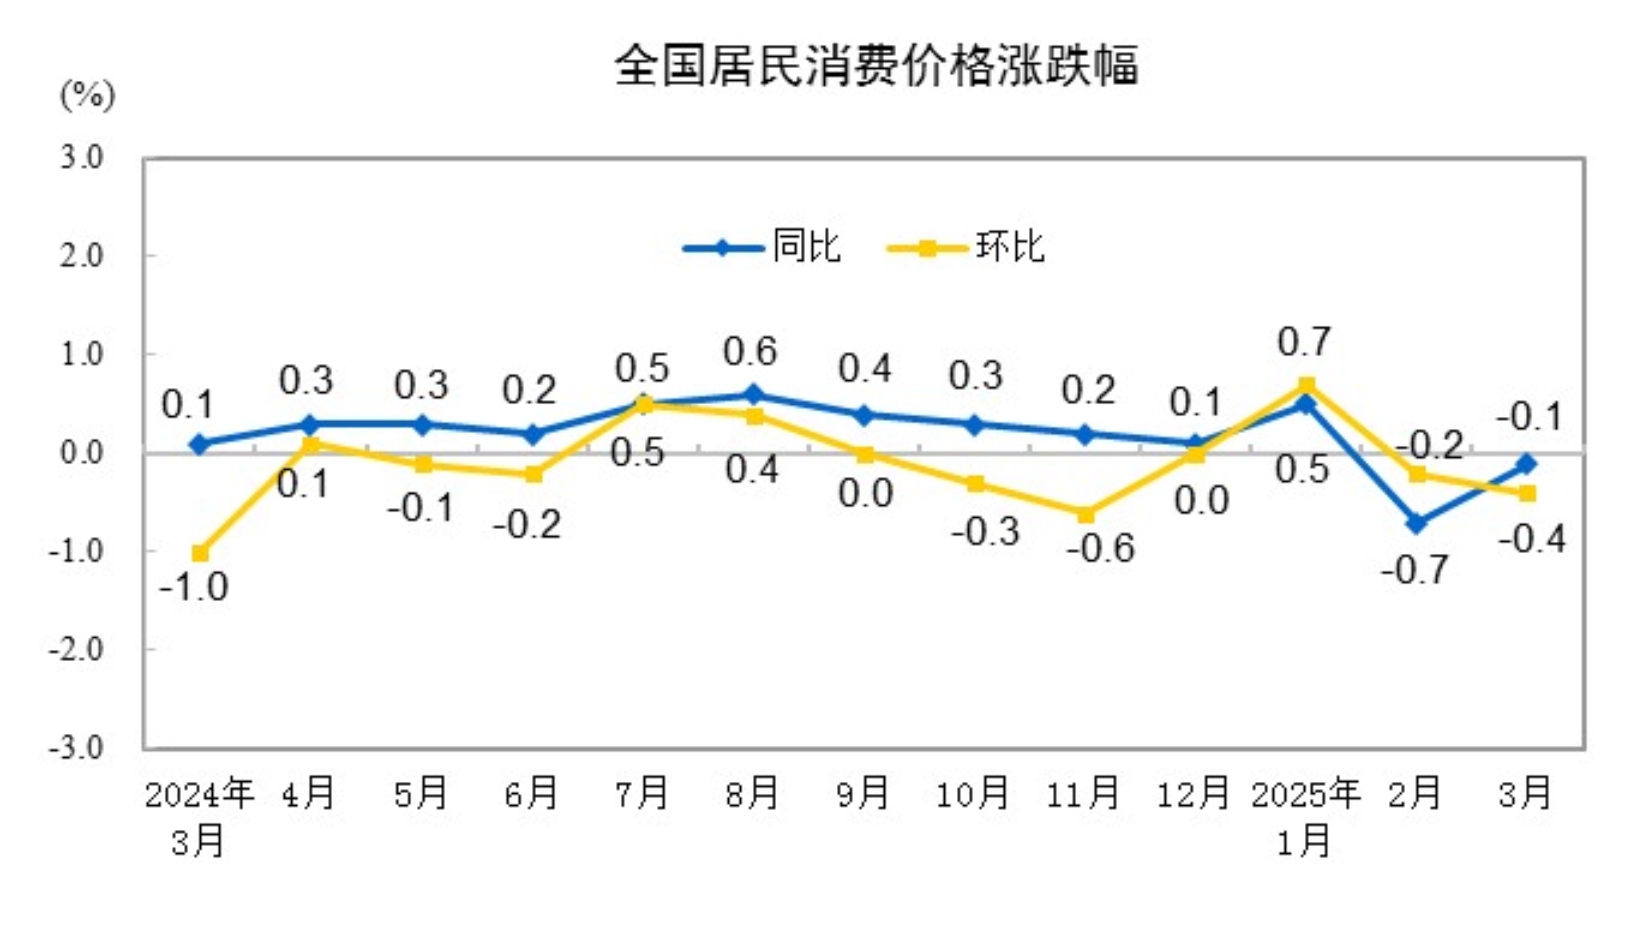
In March 2025, the CPI fell 0.1% YoY.
In March 2025, the national CPI fell 0.1% YoY. Among them, urban areas fell 0.1%, while rural areas fell 0.3%; food prices fell 1.4%, while non-food prices rose 0.2%; consumer goods prices fell 0.4%, while service prices rose 0.3%. On average from January to March, the national CPI fell 0.1% compared to the same period last year.
In March, the national CPI fell 0.4% MoM. Among them, urban areas fell 0.4%, while rural areas fell 0.3%; food prices fell 1.4%, while non-food prices fell 0.2%; consumer goods prices fell 0.4%, while service prices fell 0.4%.
I. YoY Changes in Prices of Various Commodities and Services
In March, prices of food, tobacco, and alcohol fell 0.6% YoY, dragging down the CPI by approximately 0.17 percentage points. Among food items, fresh vegetable prices fell 6.8%, dragging down the CPI by approximately 0.15 percentage points; egg prices fell 1.6%, dragging down the CPI by approximately 0.01 percentage points; grain prices fell 1.5%, dragging down the CPI by approximately 0.03 percentage points; pork prices rose 6.7%, pushing up the CPI by approximately 0.08 percentage points; fresh fruit prices rose 0.9%, pushing up the CPI by approximately 0.02 percentage points.
Among the other seven major categories, six rose and one fell YoY. Among them, prices of other goods and services, and clothing rose 6.2% and 1.3%, respectively; prices of education, culture, and entertainment, and household goods and services rose 0.8% and 0.6%, respectively; prices of housing and healthcare both rose 0.1%; while prices of transportation and communication fell 2.6%.

II. MoM Changes in Prices of Various Commodities and Services
In March, prices of food, tobacco, and alcohol fell 0.9% MoM, dragging down the CPI by approximately 0.24 percentage points. Among food items, fresh vegetable prices fell 5.1%, dragging down the CPI by approximately 0.11 percentage points; egg prices fell 2.7%, dragging down the CPI by approximately 0.02 percentage points; prices of livestock and poultry fell 2.2%, dragging down the CPI by approximately 0.07 percentage points, among which pork prices fell 4.4%, dragging down the CPI by approximately 0.06 percentage points; fresh fruit prices fell 1.6%, dragging down the CPI by approximately 0.03 percentage points.
Among the other seven major categories, three rose, two were flat, and two fell MoM. Among them, prices of household goods and services, clothing, and other goods and services rose 1.3%, 0.7%, and 0.4%, respectively; prices of housing and healthcare were flat; prices of transportation and communication, and education, culture, and entertainment fell 1.4% and 0.8%, respectively.

In March 2025, the PPI fell 2.5% YoY.
In March 2025, the national PPI fell 2.5% YoY and 0.4% MoM; the purchasing price index for industrial producers fell 2.4% YoY and 0.2% MoM. In Q1, both the PPI and the purchasing price index for industrial producers fell 2.3% compared to the same period last year.
I. YoY Changes in Industrial Producer Prices
In March, prices of production materials in the PPI fell 2.8%, dragging down the overall PPI by approximately 2.09 percentage points. Among them, prices of mining and quarrying fell 8.3%, prices of raw materials fell 2.4%, and prices of processing industries fell 2.6%. Prices of consumer goods fell 1.5%, dragging down the overall PPI by approximately 0.38 percentage points. Among them, food prices fell 1.4%, clothing prices fell 0.3%, prices of general daily necessities rose 0.7%, and prices of durable consumer goods fell 3.4%.
In the purchasing price index for industrial producers, prices of ferrous metals fell 7.8%, prices of fuel and power fell 6.8%, prices of chemical raw materials fell 3.4%, prices of agricultural and sideline products fell 3.0%, prices of building materials and non-metals fell 2.1%, and prices of textile raw materials fell 2.0%; prices of non-ferrous metals and wires rose 10.8%.
II. MoM Changes in Industrial Producer Prices
In March, prices of production materials in the PPI fell 0.4%, dragging down the overall PPI by approximately 0.30 percentage points. Among them, prices of mining and quarrying fell 2.9%, prices of raw materials fell 0.6%, and prices of processing industries fell 0.1%. Prices of consumer goods fell 0.4%, dragging down the overall PPI by approximately 0.11 percentage points. Among them, food prices fell 0.2%, prices of clothing and general daily necessities both fell 0.1%, and prices of durable consumer goods fell 1.0%.
In the purchasing price index for industrial producers, prices of fuel and power fell 1.2%, prices of ferrous metals fell 0.6%, prices of building materials and non-metals fell 0.4%, and prices of agricultural and sideline products and textile raw materials both fell 0.1%; prices of non-ferrous metals and wires, and chemical raw materials both rose 0.5%.
In March 2025, the YoY Decline in CPI Narrowed, and Core CPI Rebounded
—Dong Lijuan, Chief Statistician of the Urban Department of the NBS, Interprets the CPI and PPI Data for March 2025
In March, the CPI fell 0.4% MoM and 0.1% YoY, with the decline narrowing significantly; the PPI fell 0.4% MoM and 2.5% YoY. This was mainly influenced by seasonal and international factors. From a marginal perspective, the effects of policies to boost consumer demand further emerged, with the core CPI rebounding significantly, rising 0.5% YoY, and the supply-demand structure improving, showing some positive changes in prices.
I. The MoM Decline in CPI Was Smaller Than Seasonal, the YoY Decline Narrowed, and Core CPI Rebounded Significantly
The MoM decline in CPI was mainly influenced by seasonal factors and falling oil prices. First, as the weather warmed, some fresh foods were in abundant supply, and food supply was generally sufficient. In March, food prices fell 1.4% MoM, dragging down the CPI by approximately 0.24 percentage points, accounting for 60% of the total CPI decline. Among them, prices of fresh vegetables, pork, eggs, and fresh fruit fell 5.1%, 4.4%, 3.1%, and 1.6%, respectively, collectively dragging down the CPI by approximately 0.22 percentage points. Second, the number of travelers decreased during the off-season for tourism, and travel-related prices fell. Among them, air ticket and tourism prices fell 11.5% and 5.9%, respectively, collectively dragging down the CPI by approximately 0.13 percentage points. Third, the impact of falling international oil prices. Domestic gasoline prices fell 3.5% MoM, dragging down the CPI by approximately 0.12 percentage points.
The effects of policies to boost consumer demand gradually emerged, and the impact of the Chinese New Year holiday month faded, showing more positive changes in various aspects. First, the MoM decline in CPI was smaller than the average level of the same period in the past decade, and the increase in industrial consumer goods prices expanded. The CPI fell 0.4% MoM, with the decline being 0.2 percentage points smaller than the average level of the same period in the past decade. The effects of policies such as "trade-in" gradually emerged, and prices of industrial consumer goods excluding energy rose 0.5% MoM, with the increase expanding by 0.3 percentage points compared to the previous month. Among them, prices of household appliances, gold jewelry, and clothing rose 2.8%, 2.3%, and 0.7%, respectively, with the increases all higher than the average level of the same period in the past decade. Second, the YoY decline in CPI narrowed, narrowing by 0.6 percentage points compared to the previous month. Among them, food prices fell 1.4% YoY, with the decline narrowing by 1.9 percentage points compared to the previous month, reducing the downward pull on the CPI by approximately 0.35 percentage points compared to the previous month. Among food items, prices of beef, fresh vegetables, eggs, and aquatic products fell 10.8%, 6.8%, 1.6%, and 0.2%, respectively, with the declines narrowing; fresh fruit prices turned from a 1.8% decline in the previous month to a 0.9% increase; pork prices rose 6.7%, with the increase expanding. Third, the core CPI excluding food and energy prices rebounded significantly, turning from a 0.1% decline in the previous month to a 0.5% increase YoY. Among them, service prices turned from a 0.4% decline in the previous month to a 0.3% increase YoY, changing the impact on the CPI from a 0.15 percentage point downward pull in the previous month to a 0.13 percentage point upward push. Among services, prices of housekeeping, hairdressing, and cultural and entertainment services rose 2.4%, 1.2%, and 0.7%, respectively, while prices of elderly care and education services rose 1.4% and 1.2%. Prices of industrial consumer goods excluding energy rose 0.5% YoY, with the increase expanding by 0.3 percentage points compared to the previous month, increasing the upward push on the CPI by 0.08 percentage points compared to the previous month. Among them, prices of entertainment durable goods and clothing rose 2.0% and 1.5%.
II. PPI Continued to Decline, with Some Industries Showing Positive Changes in Prices
The MoM decline in PPI was mainly due to the following reasons: First, international factors affected domestic oil and some export industry prices downward. Falling international crude oil prices led to a MoM decline in prices of domestic oil-related industries, among which prices of oil and natural gas extraction fell 4.4%, prices of refined petroleum product manufacturing fell 1.7%, and prices of organic chemical raw material manufacturing fell 0.2%. Prices of some export industries fell MoM, with prices of computer, communication, and other electronic equipment manufacturing falling 0.7%, and prices of automobile manufacturing falling 0.4%. Second, seasonal declines in demand for coal and other energy sources. As winter heating in the north gradually ended, demand for heating coal fell, and coal inventories were at high levels. Additionally, new energy power generation had some substitution effect, with prices of coal mining and washing falling 4.3% MoM, and prices of electricity and heat production and supply falling 0.4% MoM, collectively dragging down the PPI by approximately 0.10 percentage points. Third, prices of some raw material industries fell. After the holiday, real estate and infrastructure projects started steadily, and production of steel, cement, and other materials recovered faster than demand, coupled with falling production costs. Prices of ferrous metal smelting and rolling, and non-metallic mineral products both fell 0.5% MoM, collectively dragging down the PPI by approximately 0.05 percentage points.
The rapid development of high-tech industries, the effects of policies to promote consumption and equipment upgrades, and improvements in the supply-demand structure of some industries led to positive changes in prices. First, the development of high-tech industries boosted prices in related industries.With the widespread application of artificial intelligence and high-performance large models, prices in related industries either increased YoY or saw a narrowing decline. The price of wearable smart device manufacturing rose by 4.6%. The price declines in electronic circuit manufacturing, industrial automatic control system device manufacturing, and power electronic component manufacturing narrowed by 0.6, 0.4, and 0.2 percentage points MoM, respectively. Manufacturing technologies for aircraft, ships, and others showed significant advantages, with the price of aerospace vehicle and equipment manufacturing increasing by 2.0% YoY, and the price of ship and related equipment manufacturing rising by 0.7% YoY. Secondly, demand in some consumer goods manufacturing and equipment manufacturing industries increased, leading to price increases. Policies promoting consumption and equipment upgrades have taken effect, steadily releasing demand for some consumer goods and equipment manufacturing products. The price of cultural, educational, art, sports, and entertainment goods manufacturing increased by 7.6% YoY, while the price of leather, fur, feather, and footwear manufacturing rose by 0.5% YoY. The price of new energy vehicle manufacturing decreased by 1.1% YoY, with the decline narrowing by 1.6 percentage points MoM. The price of pharmaceutical equipment manufacturing increased by 6.1% YoY, packaging equipment manufacturing rose by 1.9% YoY, and textile equipment manufacturing increased by 0.2% YoY. Additionally, spring plowing preparations drove seasonal price increases for agricultural materials. As spring plowing work progresses from south to north, demand for agricultural materials has increased, leading to price rises MoM. The price of fertilizer manufacturing increased by 2.5%, seeders rose by 0.7%, herbicides and their preparations increased by 0.4%, and field operation machinery prices rose by 0.2%.