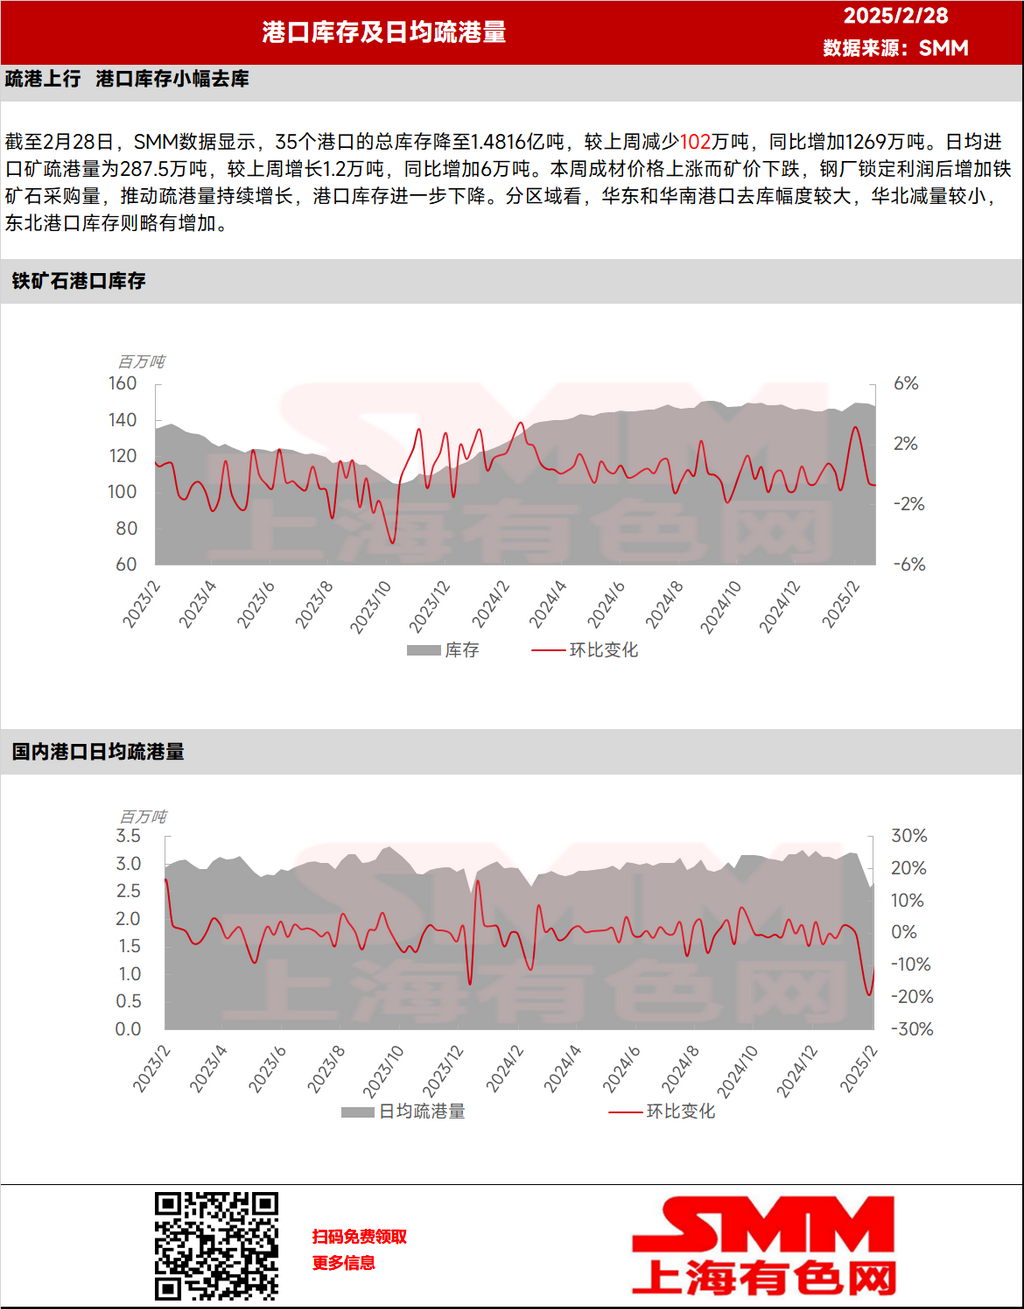
As of February 28, SMM data showed that the total inventory at 35 ports dropped to 148.16 million mt, down 1.02 million mt WoW, up 12.69 million mt YoY. The daily port pick-up volume of imported ore reached 2.875 million mt, up 12,000 mt WoW, up 60,000 mt YoY. This week, finished steel prices rose while ore prices fell. After locking in profits, steel mills increased their iron ore procurement volume, driving a continuous rise in port pick-up volume and further reducing port inventories. By region, east and south China ports saw significant destocking, north China experienced a relatively small decrease, while north-east China ports recorded a slight inventory increase.
![Before the holiday, the black chain is unlikely to see a trend-driven market [SMM Steel Industry Chain Weekly Report].](https://imgqn.smm.cn/usercenter/zUFfM20251217171748.jpg)
![[SMM Chromium Daily Review] Inquiries and Transactions Weakened, Chromium Market Showed Mediocre Performance Before the Holiday](https://imgqn.smm.cn/usercenter/ENDOs20251217171718.jpg)