SHANGHAI, Dec 16 (SMM) – China’s real estate development and sales improved in November, on the back of accelerated growth across the completion of real estate investment, sales of commercial buildings, sources of funds for real estate development enterprises and national real estate climate index.
1. The completion of real estate investment
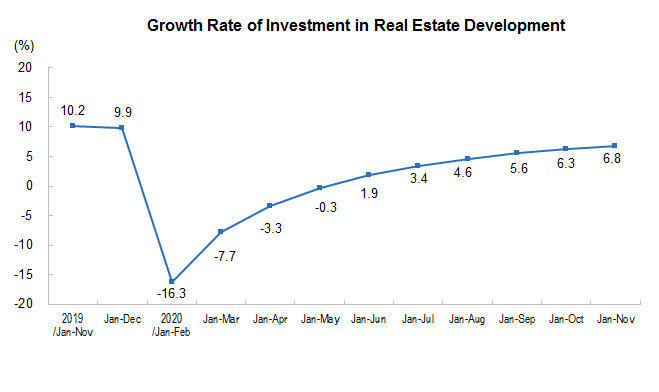
From January to November, the national real estate development investment was 12,949.2 billion yuan, an increase of 6.8 percent year-on-year, 0.5 percentage point higher than that from January to October. Among them, the residential investment was 9,583.7 billion yuan, an increase of 7.4 percent and 0.4 percentage point higher.
From January to November, the investment in real estate development in the eastern region was 6,848.8 billion yuan, with a year-on-year increase of 7.4 percent, an increase of 0.3 percentage point compared with the first ten month; the investment in the central region was 2,601.2 billion yuan, with an increase of 3.6 percent, and the growth rate was increased by 1.2 percentage points; the investment in the western region was 2,974.6 billion yuan, with an increase of 8.3 percent and unchanged growth rate; the investment in northeast China was 524.5 billion yuan, with an increase of 6.2 percent and a growth rate of 0.6 percentage point higher.
From January to November, the housing construction area of real estate development enterprises was 9,024.25 million square meters, a year-on-year increase of 3.2 percent, 0.2 percentage point higher than that in the first ten month. Among them, the residential construction area was 6,379.03 million square meters, an increase of 4.0 percent. The newly started area of housing was 2,010.85 million square meters, down 2.0 percent and a decrease rate of 0.6 percentage point narrower. Among them, newly started residential areas was 1,473.44 million square meters, decreased by 2.7 percent. The completed area of housing was 591.73 million square meters, down 7.3 percent and a decline rage of 1.9 percentage points narrower. Among them, the completed residential area was 426.55 million square meters, a decrease of 5.8 percent.
From January to November, the land purchase area of real estate development enterprises was 205.91 million square meters, a year-on-year decrease of 5.2 percent, an increase of 1.9 percentage points compared with the first ten month. October; land transaction price was 1,389 billion yuan, an increase of 16.1 percent, and a growth rate of 1.3 percentage points higher.
2. Sales of commercial buildings
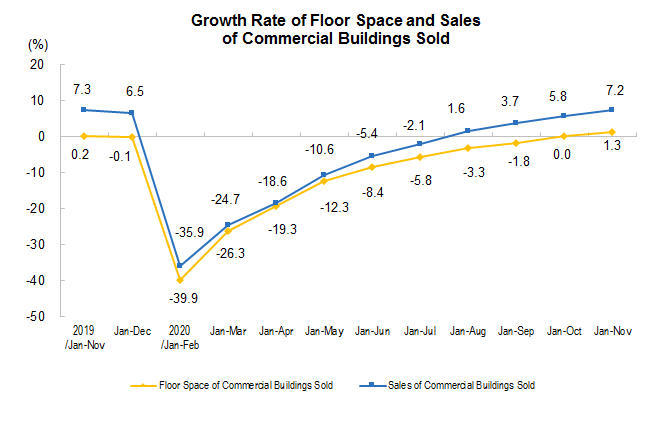
From January to November, the sales area of commercial housing was 1,508.34 million square meters, a year-on-year increase of 1.3 percent, 1.3 percentage points higher than that in the first ten month. Among them, the sales area of residential buildings increased by 1.9 percent, the sales area of office buildings decreased by 12.8 percent, and the sales area of commercial and business buildings decreased by 11.1 percent. The sales volume of commercial housing reached 14,896.9 billion yuan, an increase of 7.2 percent and a growth rate of 1.4 percentage points higher. Among them, the sales of residential buildings increased by 9.5 percent, the sales of office buildings decreased by 10.7 percent, and the sales of commercial buildings decreased by 13.7 percent.
From January to November, the sales area of commercial housing in eastern China was 614.68 million square meters, a year-on-year increase of 5.3 percent, 1.3 percentage points higher than that from January to October; the sales volume was 8,256.8 billion yuan, an increase of 12.6 percent, and a growth rate of 1.5 percentage points higher. The sales area of commercial housing in central China was 410.21 million square meters, a decrease of 3.3 percent, and a decrease rate of 1.7 percentage points narrower; the sales volume of 2,989.8 billion yuan, a decrease of 1.4 percent and a decrease rate of 1.5 percentage points narrower. The sales area of commercial housing in the western region was 420.26 million square meters, an increase of 1.9 percent and a growth rate of 0.9 percentage point higher; the sales volume was 3,126.7 billion yuan, an increase of 4.4 percent and a growth rate of 0.8 percentage point higher. The sales area of commercial housing in northeast China was 63.19 million square meters, a decrease of 7.5 percent, and a decrease rate of 1.3 percentage points narrower; the sales volume of 523.6 billion yuan, a decrease of 3.2 percent and a decrease of 1.6 percentage points narrower.
At the end of November, the area of commercial housing for sale was 492.87 million square meters, 2.04 million square meters less than that at the end of October. Among them, the area for sale of residential buildings decreased by 2.01 million square meters, that of office buildings decreased by 0.34 million square meters, and that of commercial and business buildings increased by 0.12 million square meters.
3. Sources of funds for real estate development enterprises
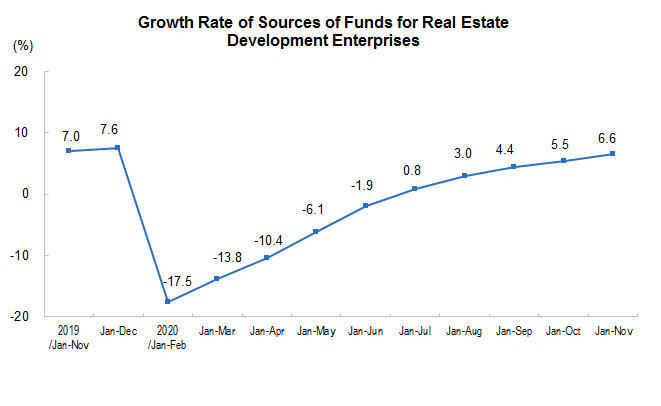
From January to November, the funds of real estate development enterprises reached 17,109.9 billion yuan, a year-on-year increase of 6.6 percent, 1.1 percentage points higher than that in the first ten month. Among them, domestic loans amounted to 2,425.6 billion yuan, an increase of 5.4 percent; utilized foreign capital reached 15.4 billion yuan, down 4.7 percent; self-raised funds reached 5,666.6 billion yuan, an increase of 7.9 percent; deposits and advances received amounted to 5,738.4 billion yuan, an increase of 5.3 percent; and personal mortgage loans reached 2,698.3 billion yuan, an increase of 10.6 percent.
4. National real estate climate index
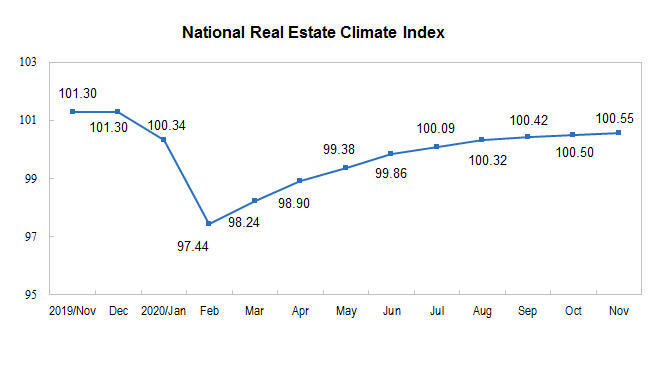
In November, the real estate development climate index (referred to as the "national housing climate index") was 100.55, 0.05 point higher than that in October.
![[SMM 귀금속 익스프레스]](https://imgqn.smm.cn/usercenter/VphiQ20251217171736.jpg)
![[SMM 귀금속 익스프레스]](https://imgqn.smm.cn/usercenter/SSKOK20251217171734.jpeg)