SMM News: CFTC long-short position ratio and gold price reappearance differentiation
Interpretation of A CFTC Gold Futures position report
Founded in 1974, as an independent institution, CFTC is responsible for supervising the American commodity futures, options and financial futures and options markets, protecting market participants and the public from fraud, market manipulation and improper management related to commodity and financial futures and options, and ensuring the openness, competitiveness and financial reliability of the futures and options markets.
CFTC releases the position report of COMEX gold futures at 15:30 eastern time every Friday, recording the position data and changes in the seven days from last Wednesday to Tuesday. The main function of the report is to provide investors with timely information on trading in various futures markets and to enhance the transparency of the futures trading market.
COMEX gold futures position report mainly includes gold non-commercial position (hedge fund-based speculative institution position), commercial position (commercial hedge risk-based commercial hedge position), total position and non-reported position and so on. Figure 1 shows the COMEX Gold position report as of September 8, 2020.
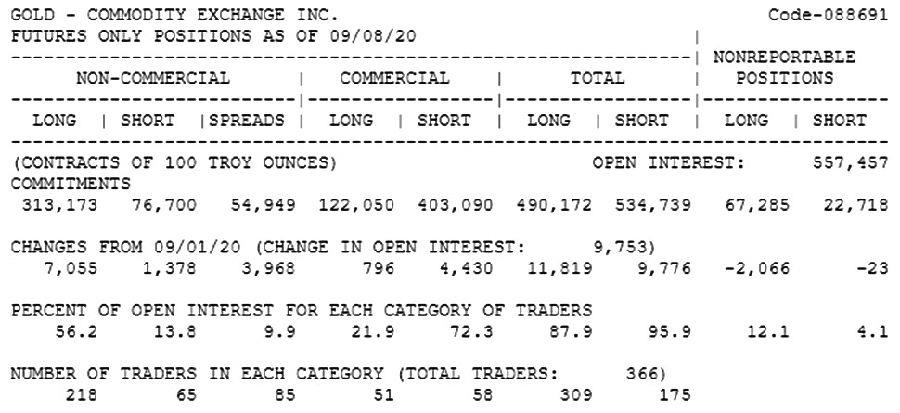
图为截至9月8日CFTC黄金期货持仓报告
Usually investors are most concerned about the change of speculative net position in gold. If the latest is net short, and the previous period is net long, then the speculative market has done a lot of selling to this variety, and the extent of selling is obviously greater than the buying range, which is a bad signal; if the latest net short value is larger than the previous period net short value, it shows that the speculative market as a whole continues to short the variety; If the latest net bulls are larger than the previous net bulls, it means that the speculative market as a whole continues to do more of the variety, and so on.
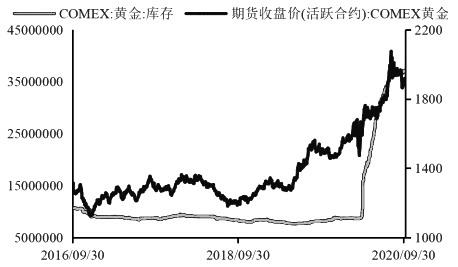
图为COMEX黄金库存变化
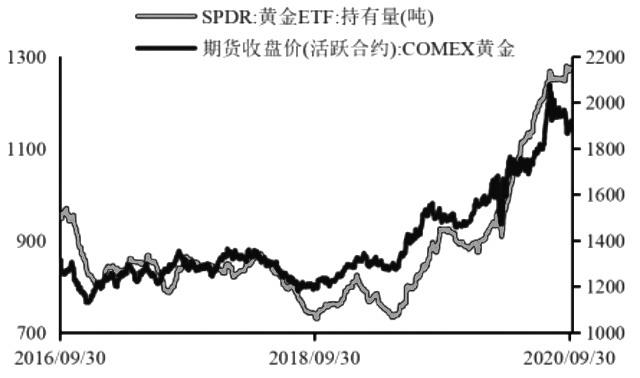
图为黄金ETF持仓量变化
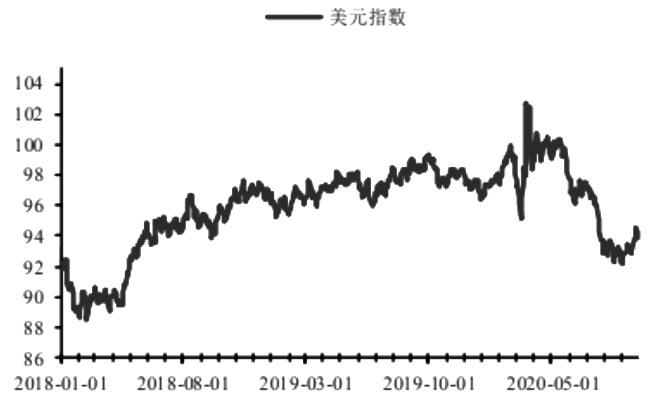
图为美元指数变化
BCFTC黄金期货非商多空力量历史变化
As mentioned above, the non-quotient long position data contains the view of market speculative funds on the future price of gold, and the relative strength of these two forces can be better described by constructing the non-quotient long position ratio. The following chart shows the relationship between CFTC non-quotient long position ratio and gold price during the last gold bull market.
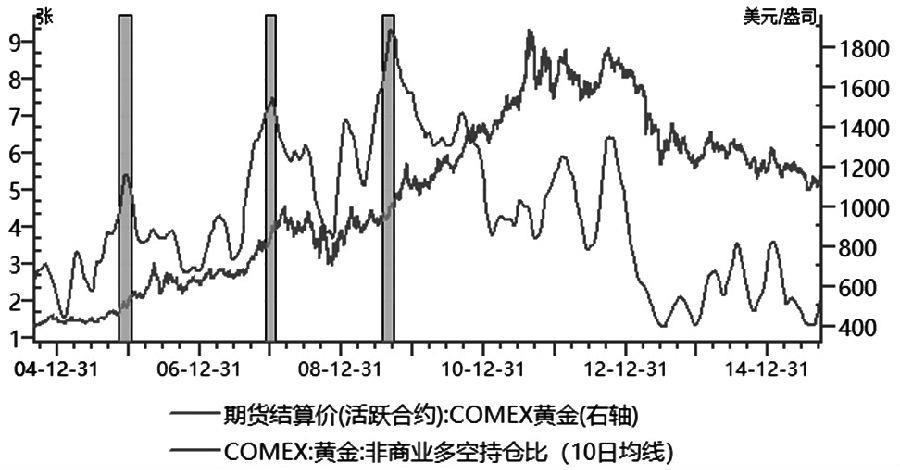
图为CFTC黄金期货非商持仓多空比与金价走势关系
In fact, through the above chart, we can draw the following conclusions: first, there is a significant positive correlation between the CFTC non-quotient long position ratio and the gold price, that is, when the gold price is stronger, it is often accompanied by the increase of the non-quotient long position ratio, while when the gold price is weaker, it is often accompanied by the decrease of the non-quotient long position ratio. The logic behind this phenomenon is obvious. Second, CFTC non-commercial long position than the leading gold price peaked or bottomed out. The reason is that generally non-commercial long positions represent the financial strength of institutions, especially hedge funds, and we have reason to believe that the judgments implied by net long or net short positions of institutional funds are relatively professional, rational and forward-looking. Third, the last round of COMEX gold prices peaked in August 2011, while non-commercial positions peaked in September 2009, 24 months ahead of schedule. During the period from September 2009 to August 2011, there was a serious divergence between the non-commercial position ratio and the gold price, that is, the gold price continued to rise and peaked while the non-commercial long position ratio continued to decline.
Reviewing the changes of COMEX gold CFTC positions from September 2009 to December 2013, we can find that the continuous decline of non-commercial long position ratio can be divided into the following stages:
In the first stage, from September 2009 to February 2011, the high position of non-quotient long position oscillated, the low level of non-quotient short position rebounded, and the ratio of non-quotient long position decreased. At this stage, the market bullish sentiment for the gold price in the future is still high, but the market has been divided, it is difficult for long positions to continue to hit new highs, long trading is extremely crowded, at the same time, short forces began to gradually layout.
In the second stage, from February 2011 to August 2012, both non-commercial long positions and non-business short positions fell, but long positions decreased even more, and the ratio of non-business long to short positions decreased. At this stage, many forces have found that the global economy has gradually stepped out of the haze of the subprime crisis and entered a period of repair with the massive monetary easing support of the Federal Reserve. Various forces expect gold prices to continue to rise weakly, and then take the initiative to close long positions and make a profit out of the market.
In the third stage, from August 2012 to December 2013, gold prices entered the "main kill wave". At this time, non-commercial long positions passively declined, while non-commercial short positions rose actively and rapidly, and the non-commercial long-short position ratio dropped sharply. At this stage, although the Fed's loose monetary environment has not changed, the global economy has entered a period of rapid growth after the crisis, with a sharp rise in global risk appetite and capital outflows from previous safe-haven assets.
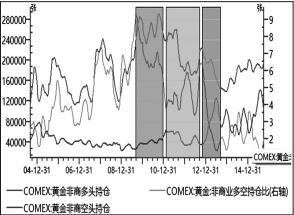
图为2009年至2013年CFTC黄金期货非商多空力量变化趋势
C当前CFTC黄金期货非商多空持仓比与金价趋势
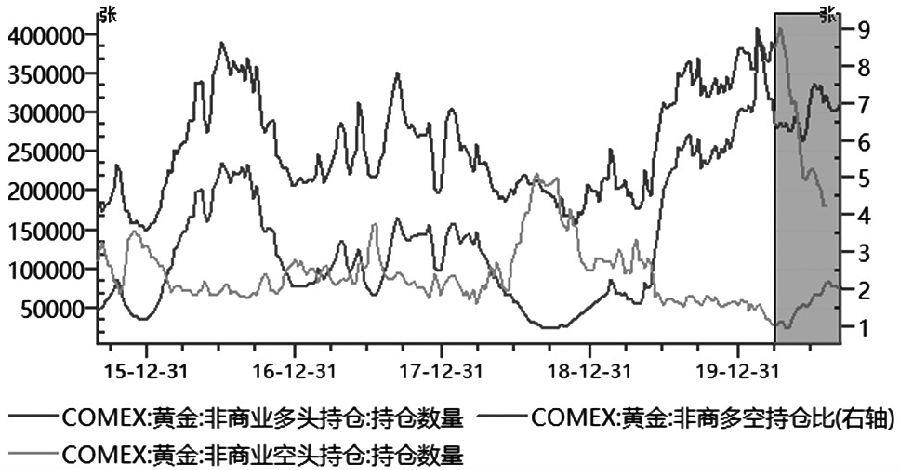
图为CFTC黄金期货非商多空持仓比与金价趋势再现分化
After a round of swings in June this year, COMEX gold prices continued to rise under the influence of a new round of fiscal stimulus news from the European Union and the US Treasury. COMEX gold prices once hit an all-time high of 2069 US dollars per ounce.
While the gold price rose, we found that the non-quotient long position ratio showed the opposite trend, which continued to decline from the high in April this year and completely deviated from the gold price during the rapid rise of gold prices from June to August.
Further analysis shows that the reasons for this deviation are as follows: on the one hand, non-commercial long positions have continued to decline since their highs in late February, and despite the Fed's policy of "unlimited monetary easing" in March, COMEX gold non-merchant long positions have not returned to the levels seen before the dollar liquidity crisis in late February.
We think this may be due to the fact that the collapse in gold prices in March caused a considerable number of long positions to burst, which has not yet recovered, resulting in a moderate increase in non-commercial long positions between June and July, in sharp contrast to the rise in gold prices. As a result, although gold prices rose sharply after the recovery of market liquidity in late March, the non-commercial long positions driving its rise were slightly weaker, and other forces could not be ruled out to play a more important driving role. On the other hand, we see that the number of non-commercial short positions has continued to rise moderately since June, and faster than non-quotient long positions, so that non-commercial long positions have continued to decline from their April highs. In fact, the rise of non-business bears and the improvement of the global epidemic and the pace of repair of the fundamentals of the US economy are basically Synchronize, which is also logical.
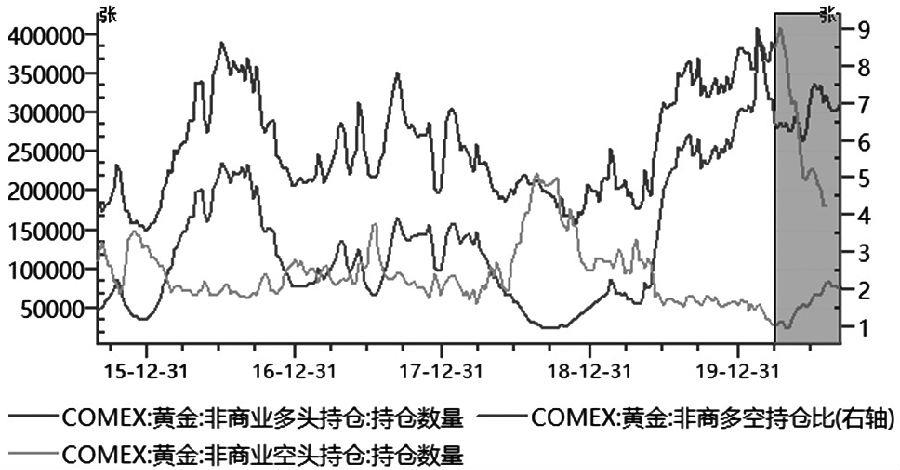
图为CFTC黄金期货非商多空持仓变化
D小结
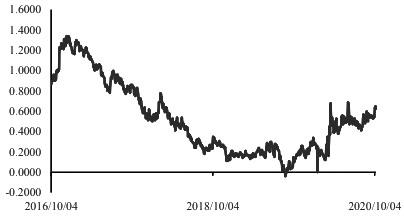
图为美国10年与2年期国债收益率(单位:%)
Overall, if we compare the characteristics of non-commercial positions between the current stage and the top of the previous gold bull market, it is not difficult to find that it is still in the first stage similar to the previous round, that is, long positions begin to decline, while short positions temperature and rise. The top of the last round of non-commercial positions has a time difference of about 24 months from the top of the gold price, so from this point, it may be too early to tell that the gold price has peaked, but this signal is still worthy of our continuous follow-up.
In fact, from a logical point of view, we judge that the first half of 2021 may be a medium-term top of gold prices, and the upward level of global inflation in the first half of 2021 may lead gold prices out of a round of medium-term peaks. On the one hand, it comes from the repair of commodity demand brought about by the global economic repair in the context of monetary easing, driving inflation up moderately. In addition, the change of the Fed's monetary policy framework has led to an essential change in US inflation expectations. The Fed hopes to guide US inflation upward through expectation management, which is likely to be achieved. At that time, if the non-commercial long position ratio continues the downward trend, and non-commercial long positions take the initiative to close profits rather than the rapid rise of short positions, we can mutually confirm this judgment at the top of the medium term.
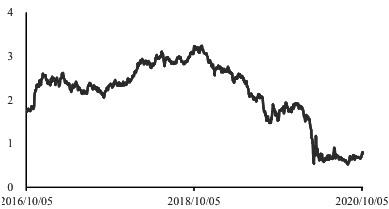
图为美国10年期国债收益率(单位:%)


![[SMM Analisis Makro] Sinyal Hawkish The Fed di Jackson Hole, Meningkatkan Ekspektasi Kenaikan Suku Bunga September](https://imgqn.smm.cn/usercenter/VCNvX20251217171735.jpeg)