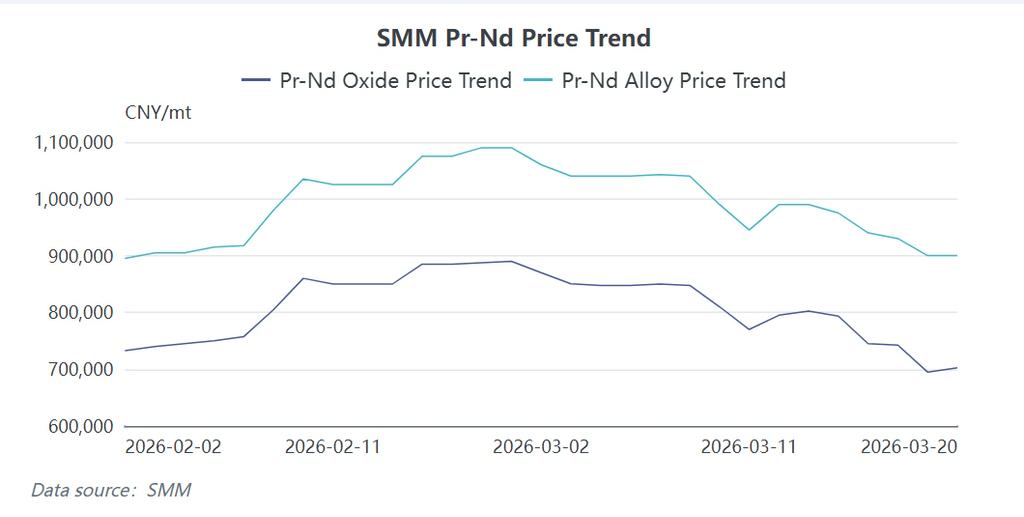
SMM News: As of March 20, 2026, the market price for Praseodymium-Neodymium (Pr-Nd) metal in China stabilized temporarily at 890,000–910,000 RMB/ton. However, a review of the entire month reveals a consistent downward trajectory. Compared to the high of 1.1 million RMB/ton on February 28, prices have plummeted by 200,000 RMB/ton in just three weeks, representing an 18.18% decline. While this correction was influenced by multiple factors—including macro-geopolitical tensions and subdued global growth expectations—the core driver, when stripping away short-term sentiment, is the substantive contraction in terminal demand for Pr-Nd. As the "barometer" of the rare earth permanent magnet industry chain, the health of downstream applications directly dictates the digestion rate of upstream raw materials. This article utilizes the SMM Pr-Nd Terminal Demand Calculation Model to dissect the demand logic for 2026 across three core sectors—New Energy Vehicles (NEVs), Internal Combustion Engine (ICE) vehicles, and Wind Power—explaining the current supply-demand dilemma facing the NdFeB magnet and broader Pr-Nd markets.
I. New Energy Vehicles (NEVs): Structural Divergence Amid Slowing Growth
The traction motors in NEVs remain the absolute cornerstone of Pr-Nd demand, accounting for nearly half of all high-performance NdFeB magnet consumption. However, entering 2026, against a backdrop of intensifying geopolitical friction and macroeconomic pressure, the era of explosive growth for the NEV sector has concluded, giving way to a significant slowdown.
According to data from the China Association of Automobile Manufacturers (CAAM), NEV production in January 2026 was 1.041 million units, a sharp 39% month-on-month (MoM) decline and a marginal 2.5% year-on-year (YoY) increase. Production further slipped in February to 900,000 units, down 13.5% MoM and up only 1.3% YoY. These figures clearly indicate that after years of exponential expansion, the domestic market is approaching its ceiling. The SMM model forecasts that overall NEV growth in 2026 will slow to 14%, with domestic sales growth capped at 5%, while export growth could reach 60%. The primary reason for this "cool domestic, hot foreign" dynamic is that the domestic penetration rate of NEVs neared 50% in 2025, surpassing ICE vehicles for the first time, with total production reaching a massive base of 16.0825 million units. Sustaining double-digit hyper-growth on such a large base is increasingly difficult, shifting the market into a phase of stock competition and moderate growth.
In contrast, exports have become the key engine driving production volume. On one hand, rising oil prices in certain overseas regions have amplified the cost advantages of NEVs. On the other hand, Chinese automakers, leveraging a comprehensive supply chain, maintain extremely low manufacturing costs. Even after factoring in tariffs and logistics, their vehicles remain highly competitive in international markets, garnering strong consumer preference.
Regarding vehicle structure, the ratio of Battery Electric Vehicles (BEVs) to Plug-in Hybrid Electric Vehicles (PHEVs) in 2026 is projected to be 64.55% vs. 35.45%. Although the share of hybrids has increased, their requirement for drive motors ensures rigid demand for magnetic materials remains intact. The ratio of passenger cars to commercial vehicles is expected to remain stable at approximately 80% vs. 20%. In terms of specific consumption (single-unit dosage), passenger cars consume roughly 2.5–4.5 kg of magnetic steel per vehicle, while commercial vehicles, due to higher load and power requirements, consume between 5–7.5 kg. Comprehensive calculations estimate that total NdFeB magnet consumption in the NEV sector for 2026 will reach 80,000 tons, a 12% increase from 71,047 tons in 2025. While total volume is still growing, this growth rate pales in comparison to the 30–50% rates seen in previous years. This gap between historical expectations and current reality is a primary inducer of the price correction.
II. Internal Combustion Engine (ICE) Vehicles: Slight Contraction in a Stock Market
Under the impact of the electrification wave, the traditional ICE vehicle market is undergoing an irreversible decline. While its contribution to NdFeB demand is smaller than that of NEVs, it remains a non-negligible foundational block.
CAAM data shows that ICE vehicle production in January 2026 was 1.409 million units, down 22% MoM and 18% YoY. February production fell further to 1.142 million units, down 19% MoM and 21% YoY. This consecutive two-month double-decline trend confirms the continued squeezing of ICE market share. SMM forecasts that ICE vehicle production in 2026 will contract by 6%, with a total annual output of approximately 17.074 million units.
NdFeB consumption in ICE vehicles is primarily concentrated in Electric Power Steering (EPS) systems and various micro-motors. Based on model assumptions: EPS penetration in ICE vehicles is 89%; the average number of micro-motors per vehicle is 60; and the penetration rate of NdFeB in these micro-motors is 31%. Regarding specific consumption, each EPS unit consumes approximately 0.147 kg of NdFeB, and each micro-motor consumes about 10g. Based on these parameters, total NdFeB consumption in the ICE sector for 2026 is estimated at 5,410 tons, a 1.04% decrease from 2025.
From a price support perspective, since the magnetic material usage per ICE vehicle is relatively low and applications are mostly mature standard components, purchasers tend to adopt a "buy-as-needed" strategy. They are less sensitive to raw material price fluctuations compared to the NEV sector. Consequently, the ICE segment neither provides strong upward momentum nor offers a solid floor during price declines. Its slight demand contraction further exacerbates market pessimism.
III. Wind Power: Dual Blow from Installation Rhythm Adjustments and Technology Shifts
The wind power sector was once another pole of growth for NdFeB demand, particularly offshore wind farms which rely heavily on high-performance permanent magnet direct-drive motors. However, early 2026 data reveals significant fatigue in this sector.
According to the National Energy Administration (NEA), new wind power installed capacity in China was 5.6 GW in January 2026, a staggering 85% MoM drop and a mere 4% YoY increase. In February, new installations were 4.2 GW, down another 25% MoM and plunging 54% YoY. The cliff-like drop in early-year installations is attributed to several factors: winter construction limitations in northern regions, extended approval processes for certain offshore projects, and short-term bottlenecks in grid absorption capacity.
More critically, there is a structural adjustment in technology routes. SMM predicts that overall wind power installation growth in 2026 will be only 2%, accompanied by significant internal shifts. The proportion of direct-drive turbines is expected to drop from 10% in 2025 to 9%, while semi-direct-drive turbines will fall from 30% to 25%. Behind this shift lies a rational choice by original equipment manufacturers (OEMs) under cost pressure. With rare earth prices remaining elevated, the high-cost disadvantage of permanent magnet direct-drive solutions is amplified. Some onshore wind projects are re-evaluating the feasibility of non-permanent magnet technologies, such as doubly-fed induction generators, or redesigning models to reduce reliance on heavy rare earths. Furthermore, while offshore wind farms still predominantly use permanent magnet schemes, their release rhythm is constrained by the complexity of marine engineering construction, making a short-term explosion unlikely.
Based on consumption assumptions of 670 tons/GW for direct-drive turbines and 175 tons/GW for semi-direct-drive turbines, combined with installation forecasts and technology mix changes, SMM calculates that total NdFeB consumption in the wind power sector for 2026 will be only 9,570 tons. This represents a dramatic ~34% decrease from the 14,504 tons consumed in 2025. This startling reduction directly eliminates thousands of tons of potential demand, acting as an "accelerator" for the recent Pr-Nd price decline. The stagnation in wind demand not only reflects short-term industry volatility but also reveals that downstream applications are accelerating their exploration of alternative technologies in a high-cost environment.
Conclusion
In summary, the sharp plunge in Pr-Nd prices in Q1 2026 is the result of a resonance between slowing NEV growth, shrinking ICE volumes, and a cliff-like drop in wind power demand. Although NEV exports provided some incremental volume, it was insufficient to offset the massive gap created by the domestic growth shift and the losses in the wind sector. The weakness in terminal demand has transmitted to mid-stream magnet manufacturers, leading to reduced operating rates and a freeze in raw material procurement intentions, thereby forcing upstream oxide and metal prices to continuously bottom out in search of a new equilibrium.
Due to space constraints, this article has only deeply deconstructed the transportation and energy sectors. In the next installment of this series, we will turn our attention to the more fragmented but voluminous consumer electronics and white goods sectors. We will focus on the energy efficiency upgrade demands for air conditioners and washing machines, the recovery status of mobile phones, laptops, tablets, and smartwatches, and the marginal changes in real estate-related industries such as elevators and electric power tools. Only by comprehensively clarifying the true demand map of each sub-sector can we accurately predict the trajectory of the Pr-Nd market in 2026.