Mine deliveries pick up but shipment schedules determine arrivals
CMOC produced 34,389 tonnes of cobalt in Q3 and sold 6,934 tonnes externally, exceeding its first-half sales of 5,727 tonnes. Even so, quarterly sales amounted to only about one-fifth of output. Copper and cobalt co-production has created different rhythms for production and sales: copper revenue of RMB 52.417 billion in January–September supported mine operations, while cobalt shipments followed quotas and sales revenue was recognised upon delivery.
Glencore adjusted earlier in the processing chain. To prioritise copper output, it retained more cobalt in solution, reducing own-sourced cobalt production to 3,500 tonnes in Q3, down 900 tonnes from Q2. CMOC has already-produced cobalt awaiting shipment; Glencore still needs to recover and process the cobalt held in solution. For Chinese buyers, these two sources of feedstock therefore have different arrival timelines.
The same distinction applies to new capacity. CMOC plans to commission KFM Phase II in 2027, with disclosed additional copper capacity of about 100,000 tonnes a year. The volume of cobalt feedstock reaching Chinese refiners will depend on the mine’s recovery plans and actual shipments.
Falling cobalt prices squeeze refining margins
As mine deliveries accelerated, downstream plants were still drawing down raw materials. By October, average monthly prices for cobalt metal and cobalt sulphate were both below year-earlier levels. New orders were priced lower, while existing feedstock continued to flow through costs at its purchase price. This timing gap showed up first in refiners’ quarterly earnings.
01 Monthly average cobalt product prices (RMB 10,000/t)
|
|
|
|
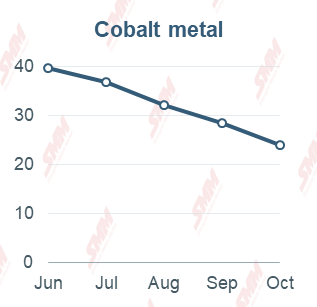
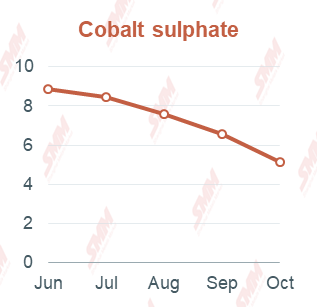
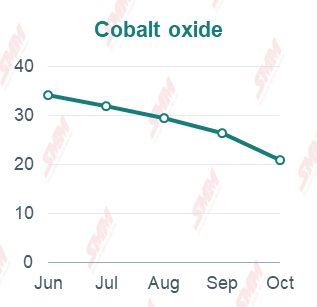
Figure 1. Actual monthly averages, June–October 2026. Each panel uses its own vertical scale. Source: SMM.
Cheaper new feedstock brings relief after older stocks take a hit
Huayou Cobalt’s net profit attributable to shareholders rose 2.23% year on year in January–September. Q3 profit of RMB 803 million, however, was less than half its first-half quarterly average of RMB 1.754 billion. The company cited metal price volatility and higher prices for auxiliary materials such as sulphur. Falling metal selling prices and rising input costs for processes such as acid leaching squeezed refining margins from both sides.
Inventory was the more immediate pressure at Tengyuan Cobalt. Higher copper sales volumes and prices lifted nine-month revenue by 66.43%, but the company swung from an average quarterly profit of RMB 441 million in the first half to a Q3 loss of RMB 266 million. Group net inventories at end-September were RMB 1.029 billion above the start of the year. Nine-month asset impairment losses reached RMB 580 million, mainly from inventory write-downs. The benefit of cheaper feedstock will emerge as new orders are delivered; older inventories took the hit first.
02 Refiners’ attributable net profit (RMB 100 million)
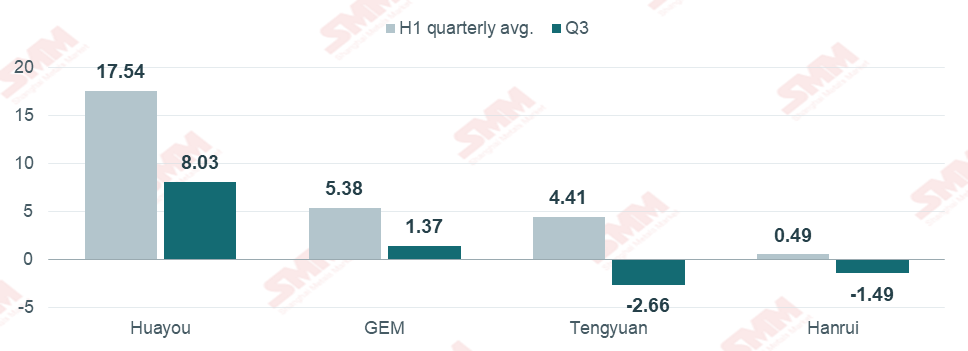
Figure 2. H1 quarterly average equals first-half attributable net profit divided by two. Source: company Q3 reports and calculations from cumulative results.
Non-recurring gains and losses also widened the gap between companies. GEM’s nine-month attributable net profit rose 9.40%, helped by gains on asset disposals, while profit excluding non-recurring items fell 29.34%. Hanrui Cobalt reported an attributable net loss of RMB 51 million, affected by valuation losses on financial assets; excluding non-recurring items, it still earned RMB 15 million over the nine months. In Q3 alone, however, Hanrui also recorded a loss on that adjusted basis.
In October, the pricing coefficients recyclers paid for black mass fell alongside cobalt salt prices. SMM’s survey found that most coefficient adjustments came late in the month, after salt prices had already declined. In the intervening period, black mass purchased at the earlier coefficients was being processed into cobalt salts sold at lower market prices. This lag explains why companies holding expensive stocks still face impairment pressure even as feedstock quotations fall.
Impairments hit earnings while stocks and payment terms tie up cash
Huayou, Tengyuan and CNGR recognised asset impairment losses of RMB 1.296 billion, RMB 580 million and RMB 340 million, respectively, in January–September. These charges reduce asset carrying values without a corresponding cash payment when recognised. Operating cash flow tells a different part of the story: GEM’s net inflow fell 45.25% year on year, mainly because it increased nickel ore reserves, according to the company. CMOC’s net inflow fell 15.08% as net outflows from its base metals trading business increased.
For materials producers, more cash was tied up in feedstock and customer credit. Easpring earned RMB 643 million in the first nine months but recorded a net operating cash outflow of RMB 150 million. Its receivables and inventories at end-September were up RMB 3.273 billion and RMB 1.807 billion from the start of the year. CNGR generated RMB 2.490 billion in operating cash, above attributable net profit of RMB 1.805 billion. Zhenhua New Material generated RMB 170 million in operating cash despite a RMB 284 million loss; its notes payable rose from RMB 460 million to RMB 931 million, deferring some procurement payments until the notes mature.
Financial comparison of selected Chinese companies
Amounts in RMB 100 million. 9M means January–September 2026. Asset impairment losses are consolidated charges, shown as positive amounts and excluding credit impairment losses. NP means net profit attributable to shareholders; OCF means net operating cash flow.
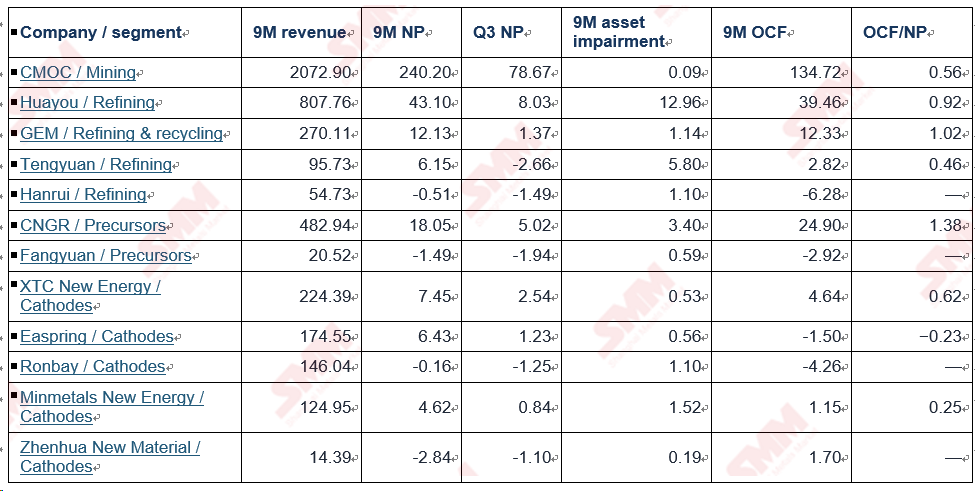
Source: company Q3 2026 reports. Impairment figures cover the consolidated group, including cobalt and other businesses.
OCF/NP is nine-month net operating cash flow divided by attributable net profit, expressed as a multiple. A dash indicates that attributable net profit was negative.
Product mix determines how materials orders translate into cobalt demand
When cobalt salt producers can sell down their stocks depends on the orders reaching materials plants. Chinese ternary cathode output rose slightly in Q3, with growth concentrated in high-nickel 9-series products; combined output of other grades declined. The 9-series uses less cobalt per tonne, limiting the lift to cobalt sulphate buying. By October, production schedules for both precursors and ternary cathodes in China had declined month on month.
CNGR increased sales of battery materials and new energy metals. Q3 attributable net profit rose 32.19% year on year to RMB 502 million, below its first-half quarterly average of RMB 651 million. Fangyuan’s high-nickel ternary precursor shipments grew for a third consecutive quarter, but cobalt sulphate shipments were under pressure in Q3. Narrower margins on its main products, inventory write-downs and fair-value losses resulted in a quarterly loss of RMB 194 million, wiping out the profit accumulated in the first half.
Cathode producers also reported different earnings outcomes as volumes grew. Ronbay’s main-product sales volumes rose 78% year on year in Q3, but cheaper feedstock reduced gross profit per tonne and overseas operating expenses increased, leaving a quarterly loss of RMB 125 million. At Minmetals New Energy, more orders lifted capacity utilisation and spread fixed costs over a larger output base, producing Q3 attributable net profit of RMB 84 million.
03 Ternary materials producers’ attributable net profit (RMB 100 million)
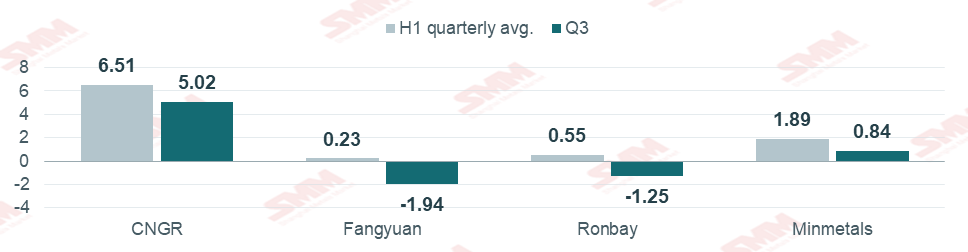
Figure 3. Consolidated group figures. H1 quarterly average equals first-half attributable net profit divided by two. Source: the four companies’ Q3 reports.
LCO output cuts slow purchases of cobalt oxide
XTC New Energy’s sales further illustrate the effect of product mix. Nine-month cathode sales rose 6.25%: cathodes for power batteries increased 19% to 63,100 tonnes, while lithium cobalt oxide (LCO) sales fell 8% to 43,100 tonnes. For cobalt oxide (Co3O4) producers, LCO orders are the direct demand driver. Chinese LCO production schedules fell again in October. Daily feedstock consumption declined faster than inventories, pushing inventory coverage higher for a second consecutive month.
04 Ternary cathode and LCO output (tonnes)
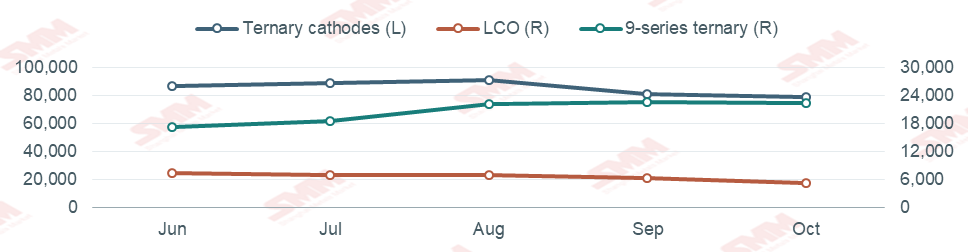
Figure 4. Actual monthly output, June–October 2026. Left axis: total ternary cathodes. Right axis: LCO and 9-series ternary cathodes. Both axes are in tonnes. The 9-series is included in total ternary output. Source: SMM.
Contract deliveries will provide the first signal of Q4 restocking
Falling inventory tonnage would usually prompt replenishment. This time, LCO production cuts have made the remaining feedstock last longer. SMM’s survey shows that some producers still have material to take under previously signed long-term contracts. Even as cobalt oxide producers cut output and lower offers, downstream buyers can wait for firmer orders before taking delivery. Spot trading remains subdued.
05 Downstream cobalt oxide inventories and days of coverage
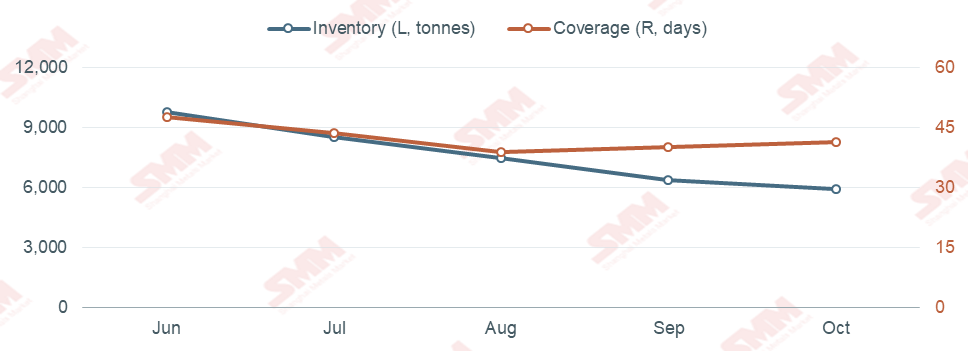
Figure 5. Actual inventories and coverage, June–October 2026. Left axis: tonnes. Right axis: days. Coverage follows SMM’s survey methodology for downstream cathode producers. Source: SMM.
High-voltage LCO is one area to watch for stronger demand. XTC New Energy’s interim report said its 4.53V product had entered mass production, while 4.55V and 4.58V products remained under development. For feedstock suppliers, additional consumption will follow sustained volume orders for the grades already in commercial production.
We are watching two purchasing patterns in Q4. If consumer battery orders prompt LCO plants to raise production schedules, feedstock coverage should shorten first, followed by a possible acceleration in long-term contract deliveries. In power batteries, a recovery in ternary material shipments will provide a smaller boost to cobalt sulphate demand if new orders remain concentrated in high-nickel grades. Precursor producers’ actual purchases from external suppliers will help establish the scale of that demand.