A Premise That Gets Overlooked
Most people tracking sulfur and sulfuric acid treat sulfur as the "upstream raw material" and read acid prices through the lens of cost pass-through. That premise breaks down in the Chinese market, where smelter acid — a by-product — accounts for more than half of supply.
Sulfuric acid has two supply sources with opposite cost logic. Brimstone acid is "buy-and-burn" — its cost moves with the sulfur price, an elastic cost curve. Smelter acid is a by-product of copper, zinc, and nickel smelting; its marginal cost is near zero, and its pricing logic is not cost recovery but inventory clearance and not disrupting the primary metal. Add the market price, and the three form a triangle — and the price is always set by whichever side is the marginal supplier.
Who the marginal supplier is depends on where the sulfur price sits.
This explains every seemingly contradictory move: why acid prices in China can hold firm while sulfur falls, and why international acid prices always follow sulfur.
I. The Sulfur Price Is a "Switch"
Think of the sulfur price as a switch, and the logic becomes clear.
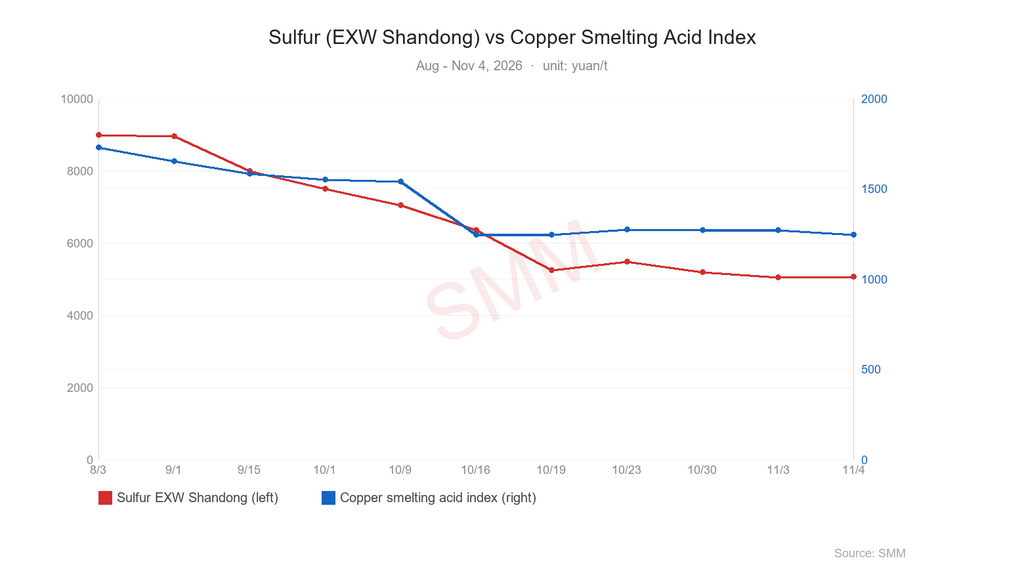
At high levels, the switch is off. When sulfur is expensive, brimstone acid costs far more than smelter acid. Smelter acid is the marginal supplier, and acid prices are set by turnarounds, inventories, and regional supply-demand — the sulfur price barely matters. This was China's norm: sulfur fell for months while smelter acid held still.
Below a threshold, the switch flips. Once the sulfur price breaks a critical level, the brimstone-acid cost curve slips below smelter acid, regains marginal-supplier status, and anchors acid prices downward. That threshold is the cost crossover point between brimstone acid and smelter acid.
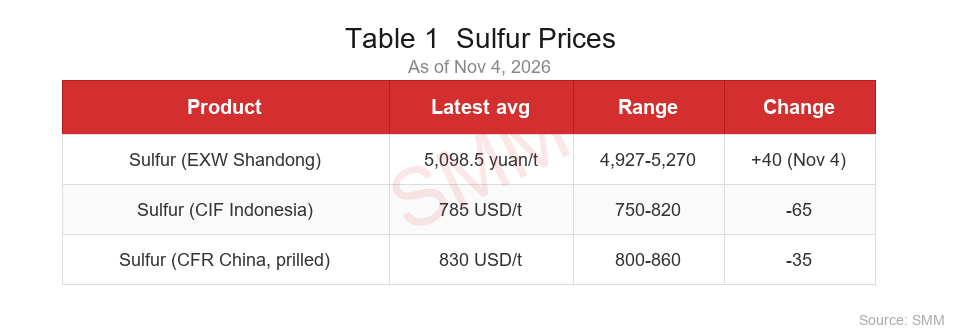
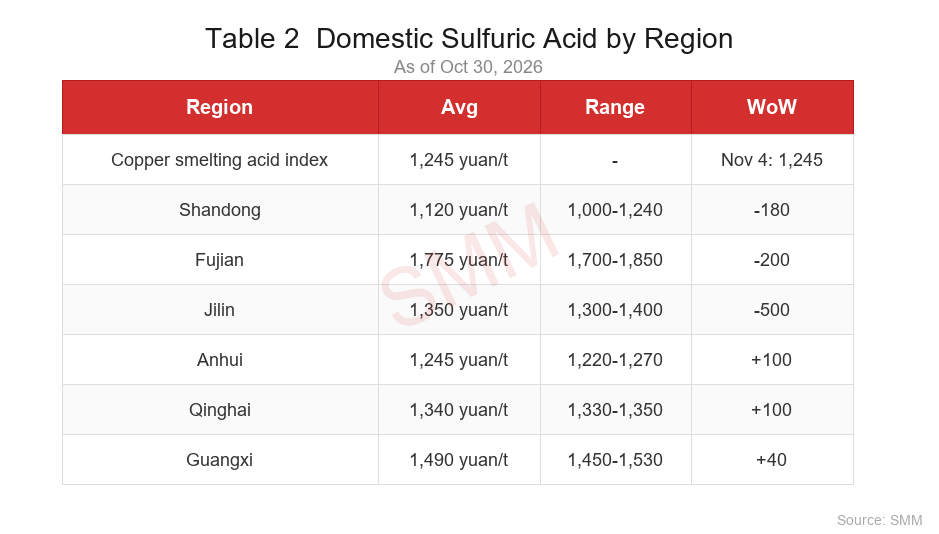
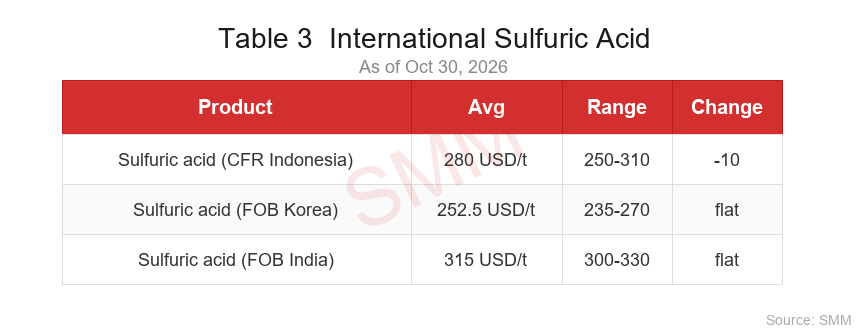
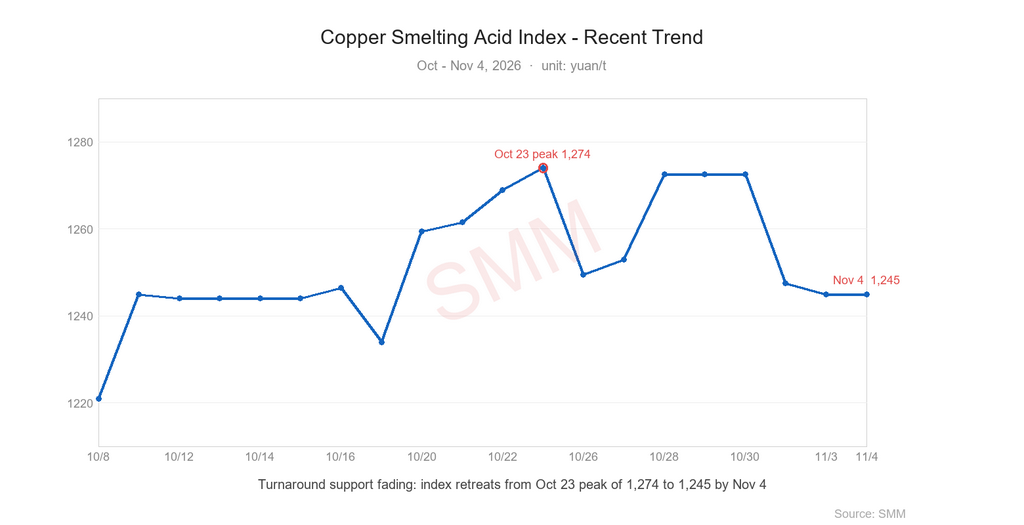
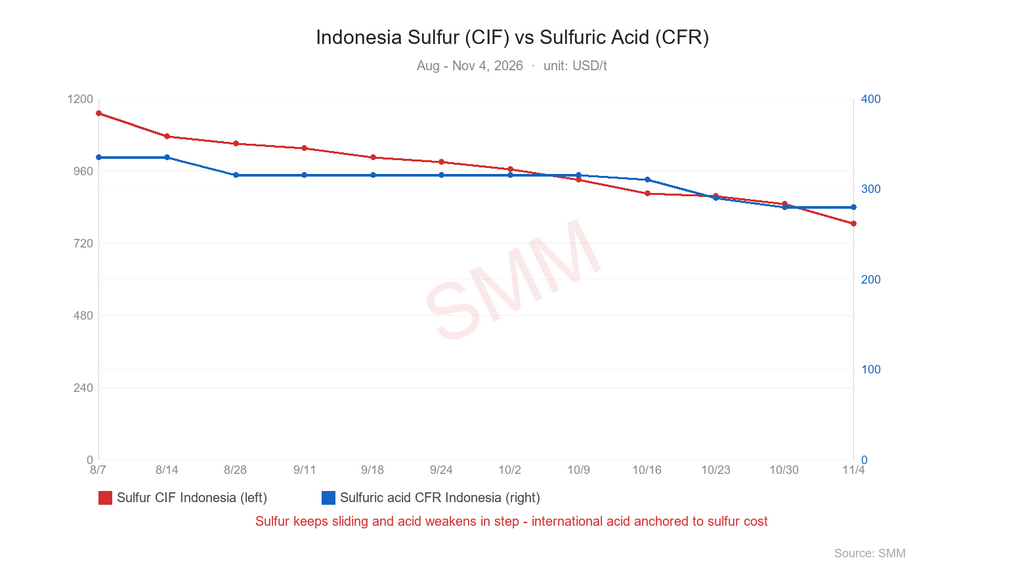
This round of sulfur's collapse is, in essence, the sulfur price crossing that point — turning from an "inert variable" back into an "active variable." SMM data confirms the switch: as of Nov 4, sulfur CIF Indonesia accelerated down to $785/t, the copper smelting acid index retreated from its Oct 23 peak of 1,274 to 1,245, and international acid weakened in tandem. (See Tables 1–3, Figures 1–3.)
II. Three Ways to Read It
Method one: watch the spread, not the point. Convert sulfur (EXW Shandong) into a theoretical per-ton acid cost using a 0.33 conversion factor, then subtract the local smelter-acid price to get a "cost spread." The speed at which this spread narrows matters more than the absolute sulfur decline — a wide spread means the switch is still off; a rapidly narrowing spread means brimstone acid is eating into smelter acid's share and regional prices will fall first; a negative spread means the acid price is locked to the brimstone-acid cost curve.
This round is precisely the "rapid narrowing" phase: while the smelter acid index retreats, sulfur-heavy regions such as Shandong, Fujian, and Jilin fell earlier and harder (Jilin down 500 yuan/t in a single week). The index's "stability" is the result of turnaround support; the regions' "decline" is the real signal of sulfur breaking through.
Method two: split the market, then orient the transmission. The same sulfur decline means opposite things to different markets. In China, cheaper brimstone acid squeezes smelter acid's share, subjecting it to pressure from both weak demand and substitution, while falling by-product revenue compounds the negative-TC losses of copper smelting — SMM estimates November spot smelting losses on copper concentrate could widen to around 6,500 yuan/t. Internationally, Indonesia's HPAL nickel and copper plants are net acid consumers, so cheaper acid directly lowers their costs. Sulfur down is a headwind for smelting in China, a tailwind abroad.
Method three: find the anchor, return to cost. Indonesia is the only market that imports both sulfur and acid at scale and pits them against each other — the best "laboratory" for reading international acid prices. There, buyers are always weighing one question: buy sulfur and make acid, or buy acid directly? When the acid-making cost implied by sulfur (CIF Indonesia $785/t) diverges from imported acid (CFR Indonesia $280/t), the market's purchasing behavior pulls them back toward equilibrium — making the sulfur price the implicit anchor for international acid. Track the divergence between Indonesia's "theoretical acid cost vs acid CFR": the wider it is, the stronger the pull of acid toward sulfur.
III. Conclusion
The three methods reduce to a single framework: watch the spread to tell whether the switch has flipped; split the market to orient the call before you write; find the anchor to read convergence against cost.
Sulfur is not the "upstream" of sulfuric acid; it is the "switch" of acid pricing. By switching the identity of the marginal supplier, it decides whether acid is priced by cost or by clearance. Understand the switch, and you understand the two ways domestic and international acid respond to sulfur — and you can locate the true direction of acid prices in every swing of sulfur.