August Gives Back More Than July Gained
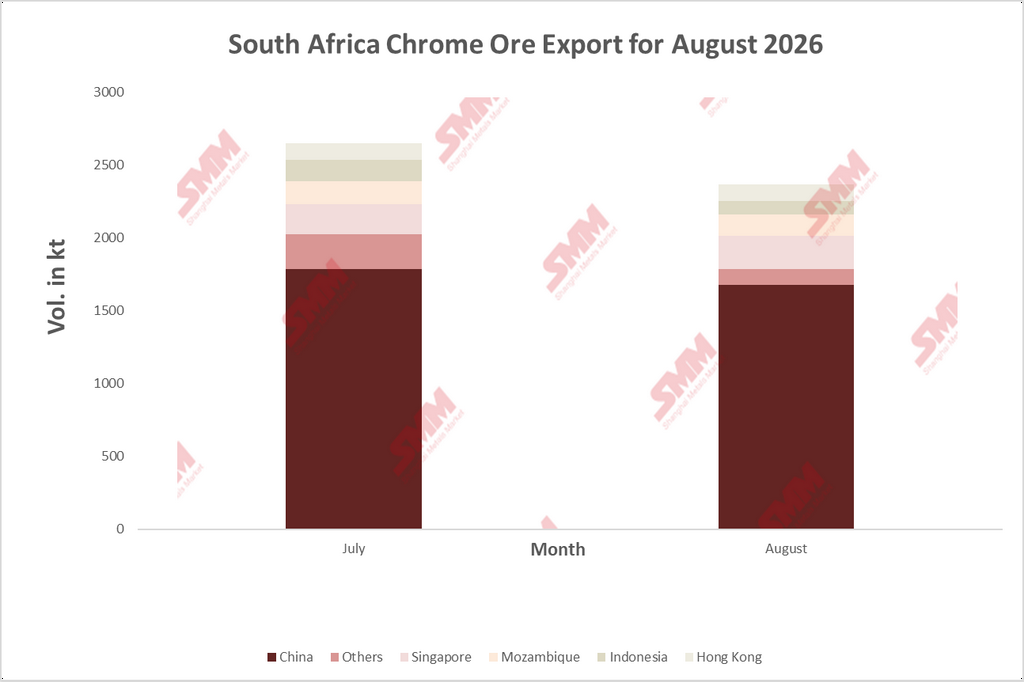
South Africa's chrome ore exports fell to 2.36 million tonnes (2,363.8 kt) in August 2026, down 10.75% month-on-month from July's restated 2,648.5 kt, a drop of 284.8 kt. The decline more than erases July's gain of roughly 245 kt and takes volumes below June's 2.40 million tonnes, making August the weakest month in the April–August series. July's high now looks like a one-month spike within a range that has held between roughly 2.36 and 2.65 million tonnes since April, rather than the start of a new leg higher. All month-on-month comparisons use July as restated in the latest SARS dataset.
A Spike Gives Way to a Return Below the Range
Exports ran at 2.47 million tonnes in April, 2.43 million tonnes in May and 2.40 million tonnes in June before July's 2.65 million tonnes. Against the roughly 2.46 million tonne average of the five months from April to August, August sits about 4% lower. The softness is consistent with SMM's weekly departure tracking, which showed loadings from South African and Mozambican ports easing in mid-to-late August, to 448,500 mt in the week ended August 14 and 376,000 mt in the week ended August 28.
China's Share Rises Even as Its Volume Falls
China took 1,674.4 kt in August, down 6.09% (108.6 kt) from July but still 3.1% above June. Its share of total exports rose from 67.3% to 70.8%, the highest of the June–August period, because the rest of the market contracted much faster. Exports to all other destinations combined fell 20.35%, from 865.6 kt to 689.4 kt. That decline of 176.2 kt accounts for about 62% of the total drop in exports, with China accounting for the other 38%.
China's customs data point the same way. SMM's analysis of China Customs figures shows August chrome ore imports at 2.3619 million tonnes, down 9.42% month-on-month and up 12.5% year-on-year. Imports from South Africa were 1.89 million tonnes, down 13.13% month-on-month and up 7.77% year-on-year, bringing January–August arrivals from South Africa to 15.28 million tonnes, up 31.42%. Cargoes loaded in South Africa typically reach Chinese ports several weeks later, so the two series are not synchronized, but both show buying cooling after a very strong first half.
Why Chinese Buyers Stepped Back
The cause sits on the Chinese side of the trade. Large volumes arrived in concentrated batches in the first half, and port inventories have since stayed near or above 5 million tonnes, at 5.04 Mt on September 24 after a 5.32 Mt peak on September 11. The market then entered its consumption off-season, with stainless steel tender prices falling and ferrochrome prices trending lower, squeezing smelter margins. Some smelters cut output or halted production, and spot chrome ore purchasing slowed accordingly. South African 40–42% fines at Tianjin have since eased to 52.5–53 yuan/mtu by late September, from 58.5–59 yuan/mtu in late February. In a market carrying this much stock, buyers have little reason to chase cargoes, and the August export figures show South African shipments adjusting to that.
Secondary Destinations: Singapore Gains, Indonesia Gives Back
Singapore was the only named destination to grow, rising 10.33% to 224.5 kt and lifting its share from 7.7% to 9.5%. That makes it the largest destination outside China among the individually reported markets, and its volumes are 18.9% above June's. As an established commodity trading and blending hub, Singapore's gain is consistent with ore being placed into intermediary storage while Chinese spot buying is slow, rather than with new end-use demand.
Indonesia fell 40.0%, from 150.0 kt to 90.0 kt, and its share dropped from 5.7% to 3.8%, reversing most of the July jump that had carried it past the UAE. Indonesia's volumes are lumpy at this scale. Even so, the July–August average of 120.0 kt remains about 54% above June's 77.8 kt, so the underlying build-out of Indonesian ferrochrome and stainless capacity still supports direct ore imports, only not in a straight line. Mozambique eased 5.05% to 149.9 kt, still 8.5% above June and consistent with steady volumes through the Maputo corridor. Hong Kong was virtually unchanged at 112.4 kt, against 112.5 kt in July.
The “Others” grouping was the largest single contributor to the decline. With the UAE now captured within “Others”, restated July “Others” volumes of 241.7 kt fell 53.4% to 112.6 kt in August, a drop of 129.1 kt that accounts for roughly 73% of the total fall in exports outside China.
Supply Stays Ample While Smelting Recovers Slowly
August's softness reflects slower buying, not tighter supply. Ferrochrome restarts in South Africa have been gradual. The Wonderkop and Boshoek smelters began restarting only at the end of June, after Eskom and the Glencore-Merafe venture finalized the pricing agreements on the 62 cents/kWh tariff NERSA approved on May 29, so surplus ore continues to be sold rather than smelted locally. Platinum-group-metals producers are also still expanding chromite recovery as a by-product revenue stream. With SMM's assessment that the global ferrochrome surplus is unlikely to reverse in the short term, South African export growth has so far been limited by Chinese appetite, not by South African availability.
Policy Still Not Constraining Volumes
The proposed ITAC export-permit system and the export tax discussed at rates of up to 25% remain unimplemented, with neither gazetted or enacted, and the government's new industrial strategy returned the chrome export levy to the agenda in June. Nothing in August's trade data points to policy having redirected ore into domestic smelting. The decline traces to Chinese demand and inventory conditions, not to regulation.
|
Outlook: August looks more like a trough in departures than a new baseline. SMM's tracking shows a September rebound in loadings, and Chinese port stocks have started to draw, falling from a September 11 peak of 5.32 million tonnes to 5.04 million tonnes by September 24. The restocking appetite that would support a stronger recovery is not yet visible: Tsingshan and other major mills cut their October ferrochrome tender prices by RMB 200 per 50 mtu unit and held back restocking. Export volumes in the coming months will therefore depend on how quickly Chinese inventories clear and whether smelter margins recover. China's share of South African shipments is likely to stay above two-thirds, while secondary destinations such as Singapore and Indonesia will keep moving month to month with trading and shipment timing. |
![[SMM Chromium Flash] China’s High-Carbon FeCr Capacity Utilization Slips to 56% in September, Southern Output Retreats](https://imgqn.smm.cn/usercenter/HGHao20251217171725.jpg)
![[SMM Chromium Flash] Valterra’s Processing Optimization Delivers R203 Million in Annual Savings](https://imgqn.smm.cn/usercenter/QmrGh20251217171725.jpg)
![[SMM Chromium Analysis] South Africa's Ferrochrome Exports Surge 20% in August, Led by North American Demand](https://imgqn.smm.cn/production/admin/votes/imagesxLaEN20261013211045.png)